. 2014 Dec 12;289(50):34601-19.
doi: 10.1074/jbc.M114.569244. Epub 2014 Oct 27.

Loss of nucleolar histone chaperone NPM1 triggers rearrangement of heterochromatin and synergizes with a deficiency in DNA methyltransferase DNMT3A to drive ribosomal DNA transcription

Affiliations

Loss of nucleolar histone chaperone NPM1 triggers rearrangement of heterochromatin and synergizes with a deficiency in DNA methyltransferase DNMT3A to drive ribosomal DNA transcription

Karl Holmberg Olausson et al. J Biol Chem. .

Abstract

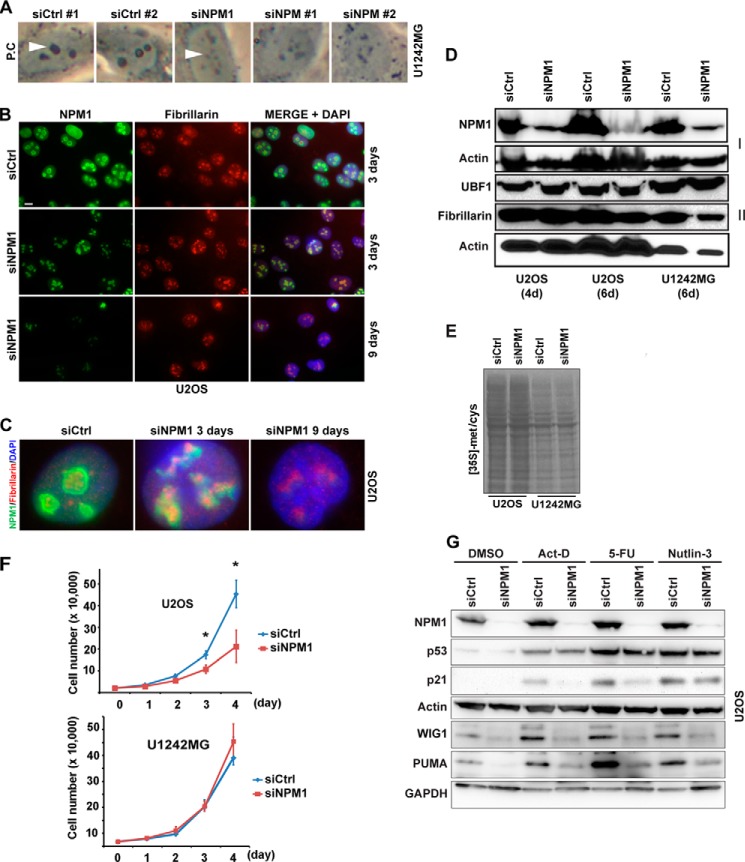
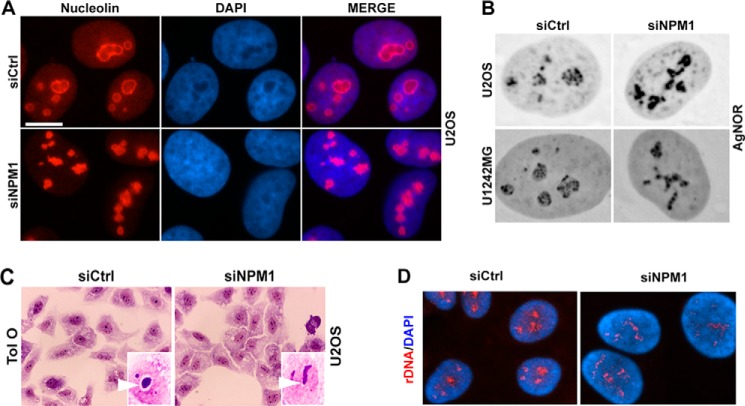
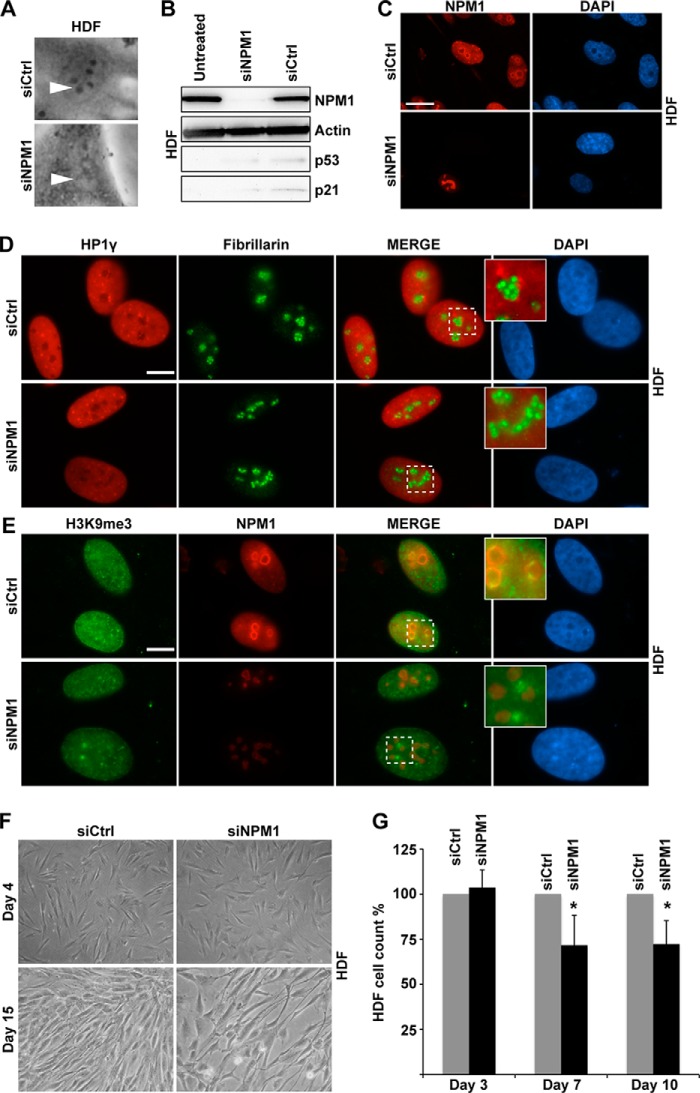
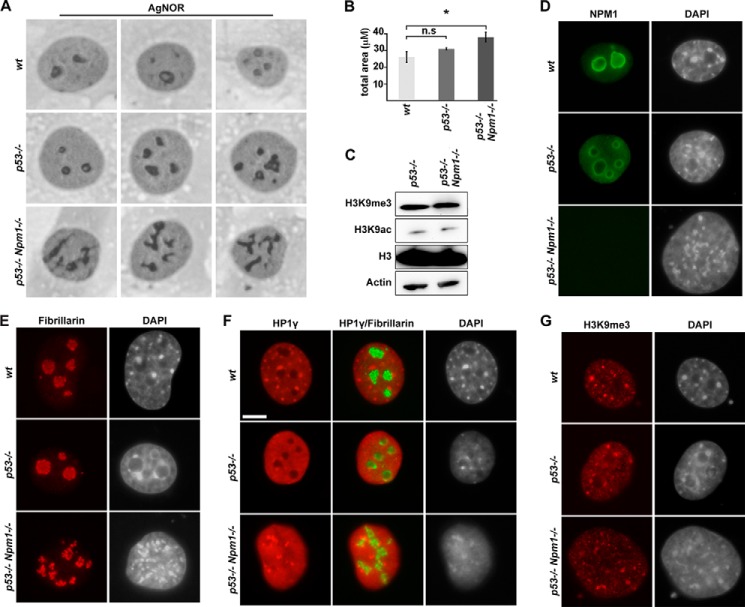
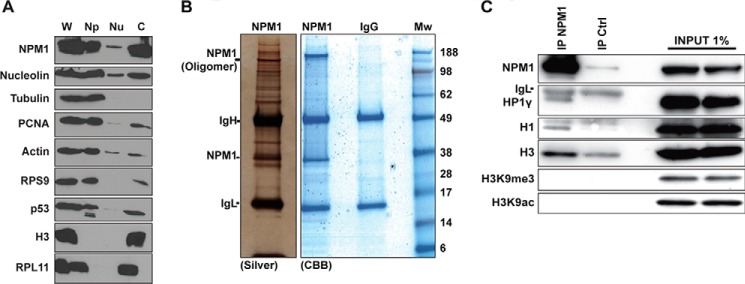
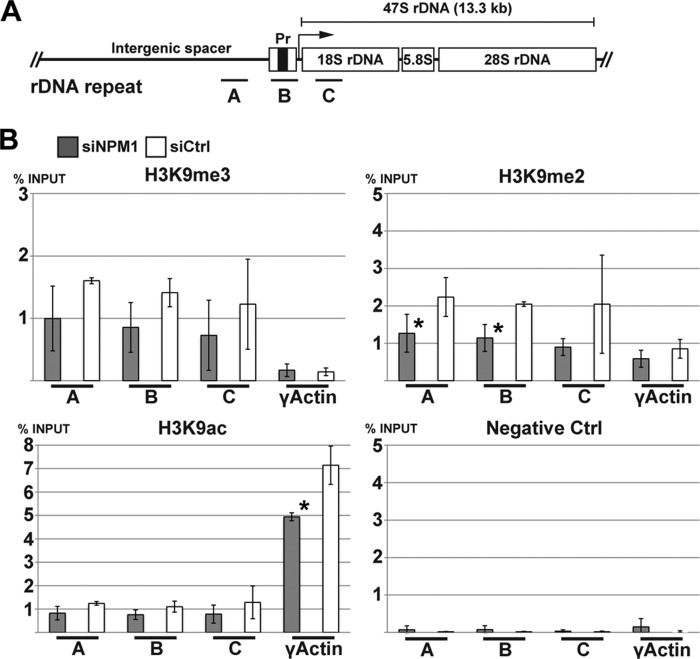
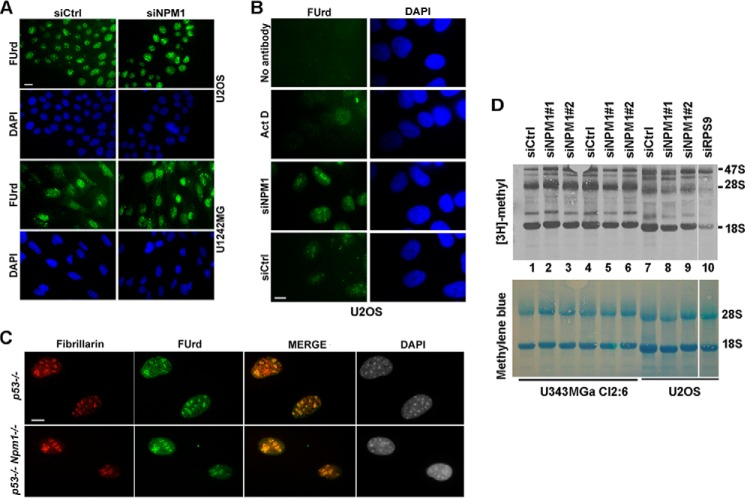
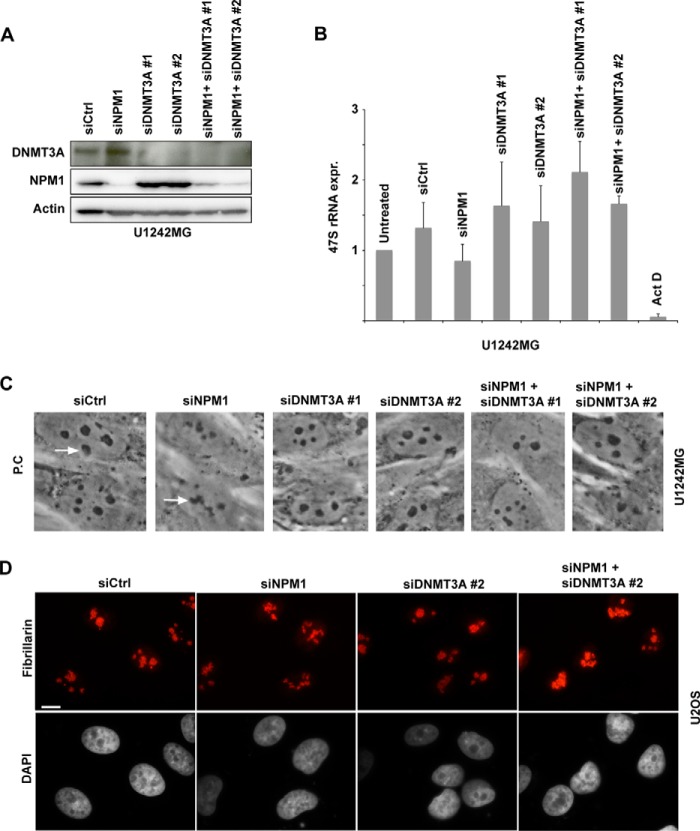
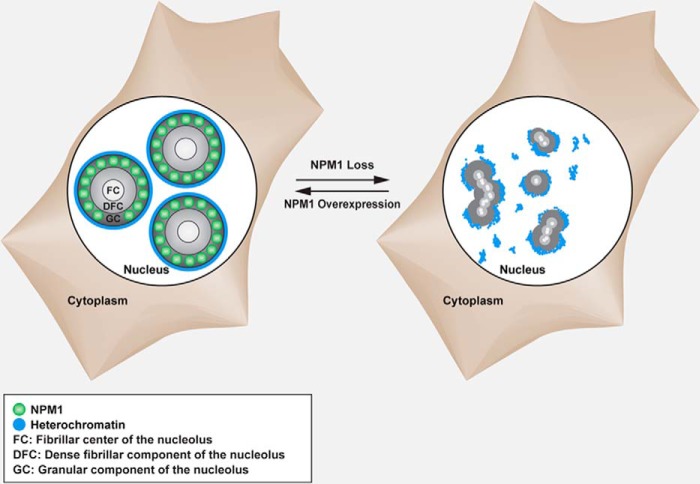
Nucleoli are prominent nuclear structures assembled and organized around actively transcribed ribosomal DNA (rDNA). The nucleolus has emerged as a platform for the organization of chromatin enriched for repressive histone modifications associated with repetitive DNA. NPM1 is a nucleolar protein required for the maintenance of genome stability. However, the role of NPM1 in nucleolar chromatin dynamics and ribosome biogenesis remains unclear. We found that normal fibroblasts and cancer cells depleted of NPM1 displayed deformed nucleoli and a striking rearrangement of perinucleolar heterochromatin, as identified by immunofluorescence staining of trimethylated H3K9, trimethylated H3K27, and heterochromatin protein 1γ (HP1γ/CBX3). By co-immunoprecipitation we found NPM1 associated with HP1γ and core and linker histones. Moreover, NPM1 was required for efficient tethering of HP1γ-enriched chromatin to the nucleolus. We next tested whether the alterations in perinucleolar heterochromatin architecture correlated with a difference in the regulation of rDNA. U1242MG glioma cells depleted of NPM1 presented with altered silver staining of nucleolar organizer regions, coupled to a modest decrease in H3K9 di- and trimethylation at the rDNA promoter. rDNA transcription and cell proliferation were sustained in these cells, indicating that altered organization of heterochromatin was not secondary to inhibition of rDNA transcription. Furthermore, knockdown of DNA methyltransferase DNMT3A markedly enhanced rDNA transcription in NPM1-depleted U1242MG cells. In summary, this study highlights a function of NPM1 in the spatial organization of nucleolus-associated heterochromatin.

Keywords: DNA Methyltransferase; Heterochromatin; Histone; Histone Chaperone; Histone Modification; Nucleolus; Ribosome Assembly; p53.


Figures

FIGURE 1.
FIGURE 1.
NPM1 depletion alters nucleolar morphology. A, phase-contrast (P.C) images of U1242MG cells reveal the morphology of nucleoli in cells transfected with different siRNAs that target NPM1. A number of validated NPM1 siRNAs were used including siNPM1-1 and siNPM1-2. The On-Target SMARTpool NPM1 siRNA was denoted siNPM1. Depletion of NPM1 resulted in deformation of the normally round and phase-dense nucleoli into nonsymmetrical nucleoli with reduced phase contrast. The white arrowheads point at nucleoli in some selected cells. Magnification, ×20. B, U2OS cells were transfected with siCtrl or siNPM1 for 3 and 9 days and subsequently subjected to double immunofluorescence staining for NPM1 (green) and fibrillarin (red). Nuclei were identified by DAPI. Scale bar: 10 μm. C, zoom-in images of representative cells in B. In siCtrl-treated cells, NPM1 preferentially stained the periphery of the nucleolus, whereas the fibrillarin antibody stained the internal regions of the nucleolus (left image). In siNPM1-treated cells, fibrillarin was more concentrated to the smaller foci, and the nucleolar structure was distorted (middle image). D, whole cell protein extracts from U2OS and U1242MG cells treated with siNPM1 or siCtrl were resolved by SDS-PAGE. The levels of NPM1, UBF1, and fibrillarin were determined by IB (4d, 4 days; 6d, 6 days). β-Actin served as a loading control on each of the two separate blotting membranes used, denoted I and II. E, estimation of nascent protein synthesis by [35S]methionine/cysteine labeling in U2OS and U1242MG cells transfected with siNPM1 or siCtrl. The labeling was conducted for 3 h at 6 days after the first siRNA transfection occasion. F, the effect of NPM1 depletion on cell proliferation was analyzed in U2OS and U1242MG cells that had been depleted of NPM1 (siNPM1) or mock-treated (siCtrl) for 6 days. To obtain cell proliferation curves, 20,000 cells/treatment were seeded in each well of the 6-well plate. Shown is the mean ± S.D. from a triplicate experiment (*, p < 0.05). G, NPM1 depletion in U2OS cells affects the p53 response. U2OS cells were transfected with siNPM1 or siCtrl for 6 days followed by exposure to DMSO (control), actinomycin D (Act-D, 5 nm), 5-fluorouracil (5-FU, 50 μm), and Nutlin-3 (10 μm) for 18 h. Protein extracts were made from the cells and resolved by SDS-PAGE. Relative levels of NPM1, p53, WIG1 (also known as ZMAT3 or PAG608), PUMA, and p21 were determined by IB. β-Actin and GAPDH served as loading controls. Note that WIG1, PUMA, and GAPDH were developed on a separate blotting membrane.
FIGURE 2.
FIGURE 2.
Changes in Ag-NOR staining patterns and altered localization of rDNA in NPM1-depleted cells. A, nucleolin immunolocalization (red) in NPM1-depleted and control U2OS cells. Scale bar: 10 μm. B, representative micrographs of Ag-NOR-stained NPM1-depleted U2OS and U1242MG cells. Magnification, ×40. C, Toluidine blue O staining of U2OS cells depleted of NPM1 versus siCtrl. Insets illustrate the perinucleolar white halo in siCtrl cells, lost in siNPM1-treated cells. Magnification, ×40. D, rDNA localization in cells depleted of NPM1. Interphase U2OS cells were subjected to fluorescent in situ hybridization to visualize the localization of the rDNA. The rDNA was hybridized to a probe specific for the NOR region (red), and nuclei were stained with DAPI (blue).
FIGURE 3.
FIGURE 3.
Redistribution of perinucleolar heterochromatin in NPM1 knockdown cells. A, DAPI staining of representative cell nuclei from NPM1-depleted U2OS and U1242MG cell cultures indicates loss of the condensed and brightly stained perinucleolar chromatin. The darker DAPI-negative regions correspond to nucleoli. B, U2OS and U1242MG cell cultures transfected with NPM1 siRNA or siCtrl were subjected to immunofluorescence staining for H3K27me3, H3K9me3, H3K4me3, and H3K9ac. NPM1-depleted cells display redistribution of perinucleolar heterochromatin as revealed by H3K27me3 and H3K9me3 staining. The altered structure of nucleoli was easily seen in the case of H3K4me3 and H3K9ac, whereas these histone modifications were very sparse in the nucleoli, as seen by immunofluorescence. The white arrowheads point at nucleoli in selected images. Scale bar: 5 μm. C, U2OS cells depleted of NPM1 were subjected to immunofluorescence staining for HP1γ. Dispersed localization of the normally perinucleolar HP1γ was observed. Cells were counterstained with DAPI. The white arrowheads point at nucleoli. Scale bar: 5 μm. D, U1242MG cells were transfected with siCtrl or siNPM1. Whole cell extracts were made from cell cultures at day 10 and were separated by SDS-PAGE, transferred to membranes followed by IB with anti-H3, anti-H4, anti-H3K9ac, anti-H3K9me3, anti-H3K4me3, anti-H4K20me, and anti-H4panAc antibodies. E, same cell extracts as in D, analyzed by IB for NPM1, β-actin, and H1 (using the AE-4 antibody). CBB staining of total protein is shown as an additional control for loading and equal total histone levels. F, U2OS cells were transfected with siCtrl or siNPM1. Whole cell extracts made from cell cultures at day 6 were separated by SDS-PAGE and transferred to membranes followed by IB with anti-H3K9ac, anti-H3K9me3, anti-H3K4me3, and anti-H4K20me antibodies. Ponceau S staining (Ponc S) of the core histones served as a loading control.
FIGURE 4.
FIGURE 4.
NPM1 depletion alters the structure of nucleoli in normal human diploid fibroblasts. A, phase-contrast images of a representative HDF from siCtrl and siNPM1-treated cultures. The white arrowheads point at nucleoli. Magnification, ×20. B, verification of NPM1 knockdown in HDFs. Levels of NPM1, p53, and p21 were determined by IB at day 8 after the first siRNA transfection occasion (day 0). C, detection of NPM1 by immunofluorescence staining in HDF cultures transfected with siCtrl or siNPM1. Nuclei were stained with DAPI. Scale bar: 20 μm. D, HDFs depleted of NPM1 were subjected to double immunofluorescence staining for HP1γ and fibrillarin. Insets are zoom-in images of representative nucleoli. Scale bar: 10 μm. E, HDFs depleted of NPM1 were double stained for H3K9me3 and NPM1. Insets are zoom-in images of representative nucleoli. F, morphology of HDFs transfected with siNPM1 or siCtrl indicated no overt changes in gross cell morphology at early time point (day 4). At day 15 the HDF cultures treated with siNPM1 appeared less cell-dense. Magnification, ×20. G, reduced numbers of HDFs were consistently seen in cultures treated with siRNA at days 7 and 10. Shown is the relative cell number at days 4, 7, and 10. The number of cells in siCtrl cultures was set to 100% in each case, and the percentage of cells in siNPM1-treated cultures relative to siCtrl is given. Shown is one representative experiment in triplicate (*, p < 0.05).
FIGURE 5.
FIGURE 5.
Altered nucleolar morphology and disrupted heterochromatin organization in p53−/−,Npm1−/− mouse embryonic fibroblasts. A, phase-contrast images of Ag-NOR-stained WT, p53−/−, and p53−/−,Npm1−/− MEFs. Three cells for each genotype are shown. B, average Ag-NOR area representing analysis of 30 cells/genotype (mean ± S.D.; *, p < 0.05). n.s, non-significant. C, whole cell extracts from p53−/−,Npm1−/− and p53−/− MEFs were resolved by SDS-PAGE and transferred to membranes followed by IB with anti-H3, anti-H3K9ac, and anti-H3K9me3 antibodies. D, images of WT, p53−/−, and p53−/−,Npm1−/− MEF nuclei stained with a mouse monoclonal anti-NPM1 antibody. E, representative images of WT, p53−/−, and p53−/−,Npm1−/− MEF nuclei stained with a rabbit anti-fibrillarin antibody. F, WT, p53−/−, and p53−/−,Npm1−/− MEFs were double stained for HP1γ and fibrillarin. Scale bar: 10 μm. G, immunofluorescence staining for H3K9me3 in WT, p53−/−,and p53−/−,Npm1−/− MEFs. Cells in D--G were counterstained with DAPI.
FIGURE 6.
FIGURE 6.
NPM1 levels dictate the structure of the nucleolus. A, U2OS cells were transfected with WT NPM1 (Myc-NPM1) and mutant NPM1 (Myc-NPM1-(117–294)). Two days post-transfection, the cells were fixed and immunofluorescence-stained for the Myc tag using the 9E10 mAb and H3K9me3 by using a rabbit polyclonal antibody. Nuclei were stained with DAPI. The DAPI and H3K9me3 staining of representative cell nuclei indicated that the perinucleolar heterochromatin had become more dense and accentuated in wild type Myc-NPM1-expressing cells than in cells transfected with mutant Myc-NPM1-(117–294). B and C, exogenous expression of WT Myc-NPM1 in p53−/−,Npm1−/− MEFs restored nucleolar morphology to WT. p53−/−,Npm1−/− MEFs were transfected with Myc-NPM1, and after 2 days the cells were fixed and stained for NPM1 and fibrillarin (B) or NPM1 and H3K9me3 (C). D, failure of mutant NPM1 to restore nucleolar morphology in p53−/−,Npm1−/− MEFs to WT. Cells were transfected with Myc-NPM1-(117–294) mutant and stained for the Myc tag and H3K9me3.
FIGURE 7.
FIGURE 7.
Identification of linker histone H1.5 isoform and HP1γ as NPM1-associated proteins. A, biochemical fractionation of proteins revealed that NPM1 is abundant in the chromatin fraction. Protein content in whole cell extracts (W) was compared with that obtained in a biochemical fractionation procedure using the same number of cells. Detergent-soluble proteins (Np), low-salt extracted nucleoplasmic proteins (Nu), and remaining chromatin (c)-bound proteins were separated. Histone H3 served as a marker for the chromatin fraction, and α-tubulin was used for the detergent-soluble protein fraction. B, U1242MG cells corresponding to 10 subconfluent p100 plates were subjected to nuclear complex co-IP. The immunoprecipitates were separated by SDS-PAGE, and the gels were subsequently stained with silver or CBB. IgH, immunoglobulin heavy chain; IgL, immunoglobulin light chain; Mw, molecular weight (kDa). Positions of IgH, IgL, and NPM1 are indicated. C, proteins extracted using the nuclear complex co-IP kit were immunoprecipitated with mouse monoclonal anti-NPM1 antibody overnight or an isotype IgG control antibody (IP Ctrl), and the material bound to beads was analyzed by SDS-PAGE followed by immunoblotting using anti-NPM1, anti-H3, anti-H3K9me3, anti-H3K9ac, anti-H1.5, and anti-HP1γ.
FIGURE 8.
FIGURE 8.
NPM1 is required for nucleolar tethering of HP1γ-enriched foci. A, U2OS cells were transfected singly with plasmids encoding EGFP alone, EGFP-HP1α, EGFP-HP1β, EGFP-HP1γ, and EGFP-HP1γ-mut (C59R) as indicated. Twenty-four hours after transfection, cell lysates were prepared, and co-IP was conducted with a rabbit anti-GFP antibody. The precipitates were resolved by SDS-PAGE, transferred to a nitrocellulose membrane, and blotted with a mouse anti-NPM1 antibody or a mouse anti-GFP antibody, respectively. Approximately 5% of the cell lysate is shown as loading control. IP, immunoprecipitation. B, U2OS cells were transfected with plasmids encoding wild type EGFP-HP1γ or EGFP-HP1γ mutant. After 2 days (48 h) the cells were fixed, immunofluorescence-stained for NPM1 (red), and overlaid with the green GFP signal. WT EGFP-HP1γ, but not the C59R mutant, co-localized with NPM1 in the perinucleolar regions as indicated by arrowheads. C, p53−/−,Npm1−/− MEFs were transfected with plasmids encoding EGFP-HP1γ, Myc-NPM1, or empty pCDNA3 vector. Cells were stained for NPM1 (red) and fibrillarin (blue), which were merged with the green EGFP signal. D, cells from the experiment shown in C were evaluated for perinucleolar association of rounded HP1γ foci. Shown are the percentages of WT, p53−/−, and p53−/−,Npm1−/− cells that displayed nucleolus-associated round HP1γ foci. Data were determined from three independent experiments, and 200 cells were evaluated for EGFP-HP1γ and EGFP-HP1γ + Myc-NPM1 plasmid combinations, respectively. Shown is mean ± S.D. *, p < 0.05.
FIGURE 9.
FIGURE 9.
Reduced silencing of rDNA in NPM1-depleted U1242MG glioma cells. A, schematic representation of the rRNA gene locus in human. Each rDNA repeat unit consists of a conserved rRNA coding sequence transcribed by pol I and a divergent intergenic spacer region. The mature 18S, 5.8S, and 28S rRNAs are derived from a polycistronic rRNA precursor transcript (47S pre-rRNA) by separation from externally and internally transcribed spacers. The rRNA gene was targeted with three different primer pairs, A, B, and C, binding to different regions of the gene. Primer pair A binds the upstream promoter, B binds in the initial promoter segment, and C binds the 18S region. B, quantitative ChIP analysis of the rDNA in cross-linked chromatin from U1242MG cells depleted of NPM1 and precipitated with anti-H3K9me2, anti-H3K9me3, and anti-H3K9ac antibodies. The γ-actin gene promoter region served as an internal control. Protein A beads alone were used as a negative control. Shown is the mean ± S.D. from three independent experiments (biological replicates), each performed in triplicate (*, p < 0.05).
FIGURE 10.
FIGURE 10.
rDNA transcription and processing in NPM1-depleted cells. A, 5-FUrd incorporation in NPM1-depleted U1242MG and U2OS cells. The cells were incubated in 2 mm 5-FUrd for 10 min. Scale bar: 20 μm. B, control reactions for 5-FUrd labeling included no primary antibody control and 5-FUrd labeling in actinomycin D-treated U2OS cells (10 nm actinomycin D (Act D) for 2 h) resulting in a much reduced signal. As a comparison, 5-FUrd labeling is also shown in siNPM1- and siCtrl-treated U2OS cells. Scale bar: 10 μm. C, 5-FUrd incorporation in p53−/− and p53−/−,Npm1−/− cells. The cells were incubated in 2 mm 5-FUrd for 10 min. Incorporation of 5-FUrd into newly made RNA in A–C was detected by a primary antibody against BrdU followed by a secondary FITC-conjugated anti-mouse antibody. In C, cells were also stained for fibrillarin, revealing co-localization of 5-FUrd and fibrillarin in nucleoli. Scale bar: 10 μm. D, synthesis and processing of rRNA. U2OS cells (lanes 7–10) or U343MGa Cl2:6 cells (lanes 1–6) were transfected with siRNA oligonucleotides as indicated. Lanes 4–6 are a replicate experiment of lanes 1–3. Knockdown and control cells were labeled with [methyl-3H]methionine for 2 h. Ribosomal protein S9 (RPS9) siRNA served as a positive control for disrupted processing of rRNA (31). Newly synthesized 47S, 28S, and 18S rRNA species are indicated (upper panel), and the total 28S and 18S rRNA transferred to the membrane was visualized by methylene blue (lower panel).
FIGURE 11.
FIGURE 11.
Knockdown of NPM1 and DNMT3A enhances rDNA transcription. A, U1242MG cells were transfected with siCtrl, siNPM1, siDNMT3A-1, siDNMT3A-2, or combinations thereof. Protein extracts were made from the cells and resolved by SDS-PAGE. Relative levels of NPM1 and DNMT3A were determined by IB. β-Actin served as a loading control. B, real-time qRT-PCR was used to measure the levels of 47S pre-rRNA in U1242MG cells depleted of NPM1, DNMT3A, or both NPM1 and DNMT3A. Shown is the mean ± S.D. of a triplicate experiment (biological replicates) in which the untreated cell population was set to 1 (arbitrary units). Actinomycin D (Act D), included as a control, was used at a concentration of 5 nm. The difference between siNPM1-depleted cells and cells co-depleted of NPM1 and DNMT3A was significant (p < 0.05). C, phase-contrast (P.C) images of U1242MG cells reveal the morphology of nucleoli in cells transfected with different siRNAs that target NPM1 or DNMT3A. The arrows point at nucleoli. D, U2OS cells were transfected with siCtrl, siNPM1, siDNMT3A-2, or a combination of siNPM1 and siDNMT3A-2 and subsequently were subjected to immunostaining for fibrillarin (red) after 6 days. Nuclei, identified by DAPI, are visualized in black-and-white mode. Scale bar: 10 μm.
FIGURE 12.
FIGURE 12.
Effects of NPM1 on nucleolar structure. This is a schematic illustration of the effects of NPM1 loss or NPM1 overexpression on nucleolar structure.

Similar articles

Cited by

References

    1. McStay B., Grummt I. (2008) The epigenetics of rRNA genes: from molecular to chromosome biology. Annu. Rev. Cell Dev. Biol. 24, 131–157 - PubMed
    1. Hamperl S., Wittner M., Babl V., Perez-Fernandez J., Tschochner H., Griesenbeck J. (2013) Chromatin states at ribosomal DNA loci. Biochim. Biophys. Acta 1829, 405–417 - PubMed
    1. Boisvert F. M., van Koningsbruggen S., Navascués J., Lamond A. I. (2007) The multifunctional nucleolus. Nat. Rev. Mol. Cell. Biol. 8, 574–585 - PubMed
    1. Boulon S., Westman B. J., Hutten S., Boisvert F. M., Lamond A. I. (2010) The nucleolus under stress. Mol. Cell 40, 216–227 - PMC - PubMed
    1. Németh A., Längst G. (2011) Genome organization in and around the nucleolus. Trends Genet. 27, 149–156 - PubMed

Publication types

MeSH terms