. 2015 Jul;240(7):936-45.
doi: 10.1177/1535370214555666. Epub 2014 Oct 27.

Rapamycin ameliorates IgA nephropathy via cell cycle-dependent mechanisms

Affiliations

Rapamycin ameliorates IgA nephropathy via cell cycle-dependent mechanisms

Jihua Tian et al. Exp Biol Med (Maywood). 2015 Jul.

Abstract

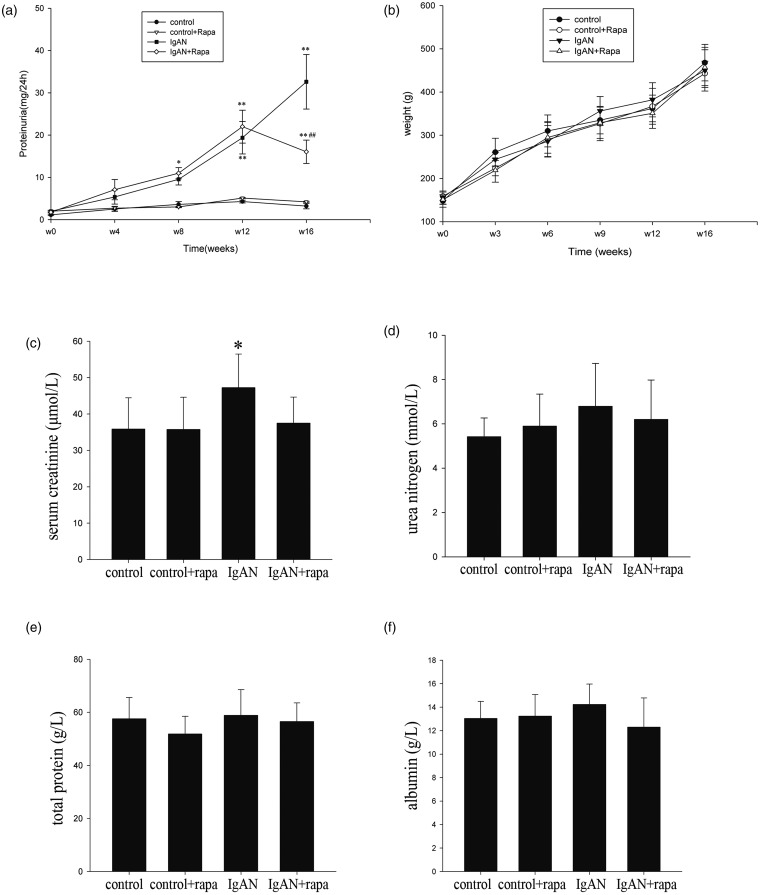
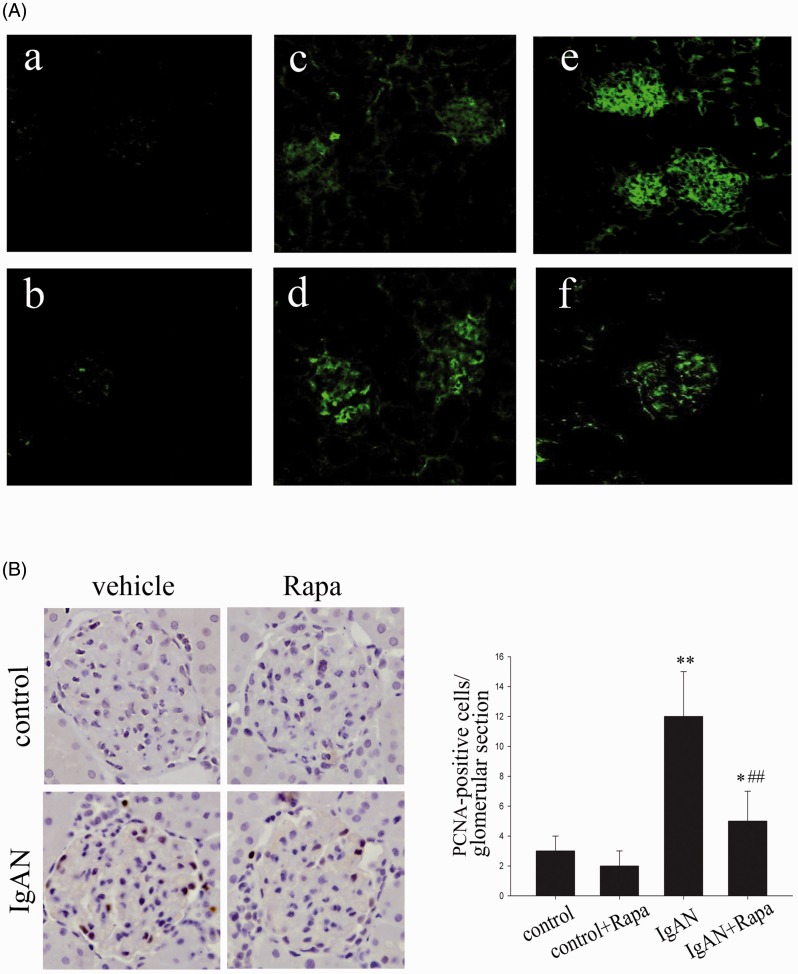
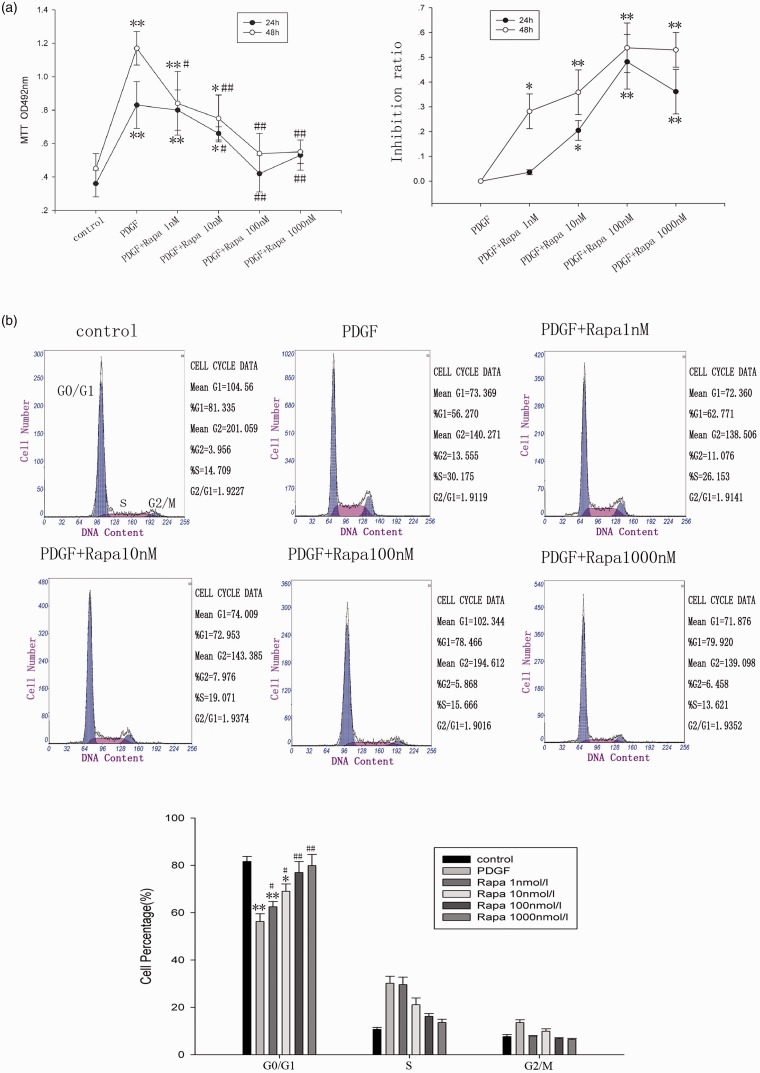
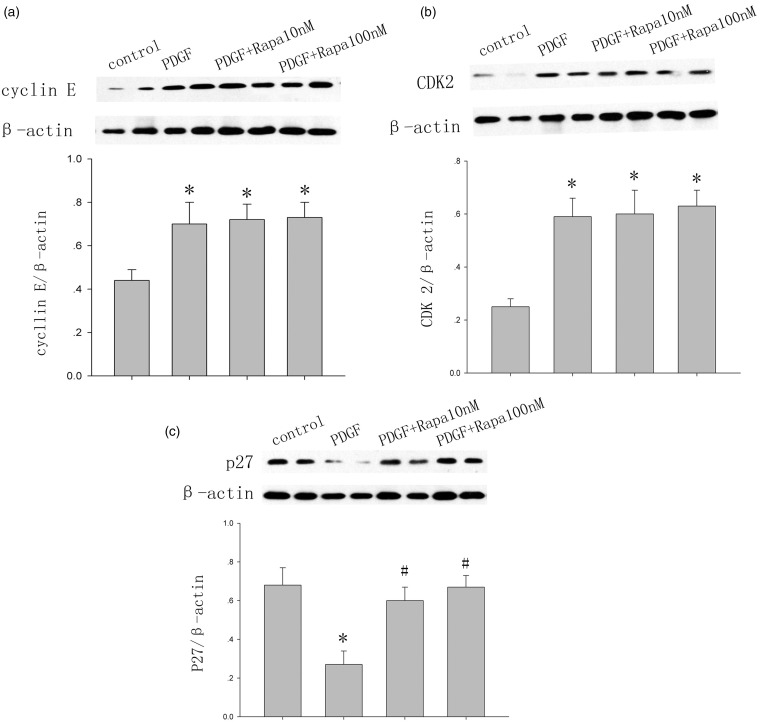
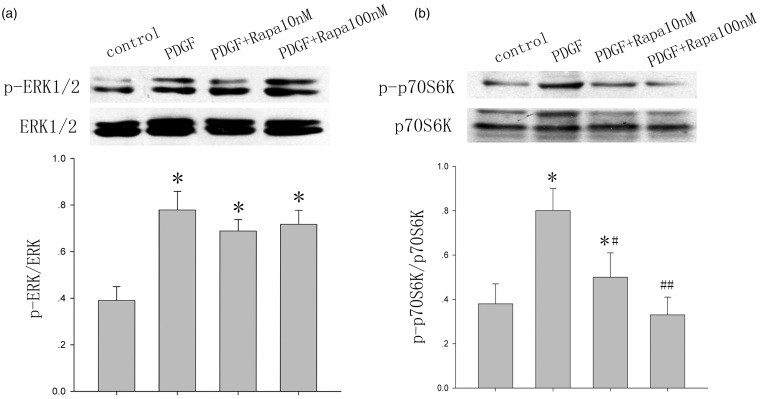
IgA nephropathy is the most frequent type of glomerulonephritis worldwide. The role of cell cycle regulation in the pathogenesis of IgA nephropathy has been studied. The present study was designed to explore whether rapamycin ameliorates IgA nephropathy via cell cycle-dependent mechanisms. After establishing an IgA nephropathy model, rats were randomly divided into four groups. Coomassie Brilliant Blue was used to measure the 24-h urinary protein levels. Renal function was determined using an autoanalyzer. Proliferation was assayed via Proliferating Cell Nuclear Antigen (PCNA) immunohistochemistry. Rat mesangial cells were cultured and divided into the six groups. Methylthiazolyldiphenyl-tetrazolium bromide (MTT) and flow cytometry were used to detect cell proliferation and the cell cycle phase. Western blotting was performed to determine cyclin E, cyclin-dependent kinase 2, p27(Kip1), p70S6K/p-p70S6K, and extracellular signal-regulated kinase 1/2/p- extracellular signal-regulated kinase 1/2 protein expression. A low dose of the mammalian target of rapamycin (mTOR) inhibitor rapamycin prevented an additional increase in proteinuria, protected kidney function, and reduced IgA deposition in a model of IgA nephropathy. Rapamycin inhibited mesangial cell proliferation and arrested the cell cycle in the G1 phase. Rapamycin did not affect the expression of cyclin E and cyclin-dependent kinase 2. However, rapamycin upregulated p27(Kip1) at least in part via AKT (also known as protein kinase B)/mTOR. In conclusion, rapamycin can affect cell cycle regulation to inhibit mesangial cell proliferation, thereby reduce IgA deposition, and slow the progression of IgAN.

Keywords: IgA nephropathy; Rapamycin; cell cycle proteins; mesangial cell.


Figures

Figure 1
Figure 1
Functional parameters in IgA nephropathy after rapamycin treatment. (a) 24-h Urinary protein levels. Four weeks after BGG was administered intragastrically, proteinuria developed in the IgAN rats. Rapamycin treatment (initiated in week 12) significantly reduced protein excretion, but the proteinuria remained more severe compared with the control rats at week 16 (n = 10/group at week 4; n = 9/group at week 8; n = 8/group at week 12–16). (b) The mean body weight of the rats. IgA nephropathy and low-dose rapamycin did not affect the body weight of the rats (n = 10/group at week 3, 6; n = 9/group at week 9; n = 8/group at week 12–16). (c) Serum creatinine slightly increased in the IgAN rats at week 16 (n = 8/group). For urea nitrogen (D), total protein (E), and albumin (F), there was no significant difference among the groups (n = 8/group). The data are presented as the means ± SD. *P < 0.05, **P < 0.01 vs. control; #P < 0.05, ##P < 0.01 versus IgAN
Figure 2
Figure 2
Rapamycin inhibited IgA deposition and cellular proliferation in glomeruli. (A) IgA deposition in the glomeruli was visualized by direct immunofluorescence. (a) control (16 weeks); (b) control with rapamycin treatment (16 weeks); (c) IgA nephropathy model (8 weeks); (d) IgA nephropathy model (12 weeks); (e) IgA nephropathy model (16 weeks); and (f) IgA nephropathy model with rapamycin treatment for 4 weeks (16 weeks). All of the sections were imaged with a confocal immunofluorescence microscope (200 × magnification). (B) Cell proliferation was detected via PCNA immunohistochemistry at week 16 (n = 8/group, 400 × original magnification). The data are presented as the mean ± SD. *P < 0.05, **P < 0.01 versus control; ##P < 0.01 versus IgAN. (A color version of this figure is available in the online journal.)
Figure 3
Figure 3
Rapamycin reduced mesangial cell proliferation and arrested the cell cycle in the G1 phase. (a) MTT assay for cell proliferation. Rapamycin inhibited cell proliferation induced by PDGF-B at 24 and 48 h. Rapamycin treatment at 1 nmol/L for 48 h but not 24 h significantly suppressed MC proliferation. There was no significant difference among the groups using 100 nmol/L or 1000 nmol/L (n = 6/group). (b) Flow cytometry was used to analyze the cell cycle. Rapamycin dose-dependently arrested cells in the G1 phase; therefore, the number of cells in the S phase was significantly lower (n = 6/group). The data are presented as the mean ± SD. *P < 0.05, **P < 0.01 versus control, #P < 0.05, ##P < 0.01 versus PDGF. (A color version of this figure is available in the online journal.)
Figure 4
Figure 4
The effect of rapamycin on cell cycle proteins. (a and b) The expression of cyclin E (a) and CDK2 (b) was increased by PDGF-B, but no inhibitory effect was observed using 10 or 100 nmol/L of rapamycin. (c) The level of p27Kip1 was analyzed by Western blotting. Rapamycin upregulated p27Kip1 expression at 10 and 100 nmol/L (two samples per group). Data are representative of three independent experiments. *P < 0.05 versus control; #P < 0.05 versus PDGF; mean ± SD
Figure 5
Figure 5
Rapamycin inhibited p70S6K phosphorylation, but did not affect p44/42 MAPK phosphorylation. (a) PDGF induced p44/42 MAPK phosphorylation, and rapamycin did not reduce p44/42 MAPK phosphorylation. (b) The levels of p-p70S6K and p70S6K were analyzed by Western blotting. Phosphorylated p70S6K was elevated in the PDGF group, and effectively inhibited by rapamycin in a dose-dependent manner. The data are presented as the fold increase in the ratio of phosphoprotein to total protein. The bar graph illustrates the mean ± SD from three independent experiments. *P < 0.05 versus control, #P < 0.05, ##P < 0.01 versus PDGF

References

    1. Donadio JV, Grande JP. IgA nephropathy. N Engl J Med 2002; 347(10): 738–48. - PubMed
    1. Floege J, Feehally J. IgA nephropathy: recent developments. J Am Soc Nephrol 2000; 11(12): 2395–403. - PubMed
    1. Lai KN. Pathogenesis of IgA nephropathy. Nat Rev Nephrol 2012; 8(5): 275–283. - PubMed
    1. Kurogi Y. Mesangial cell proliferation inhibitors for the treatment of proliferative glomerular disease. Med Res Rev 2003; 23(1): 15–31. - PubMed
    1. Shankland SJ. Cell cycle regulatory proteins in glomerular disease. Kidney Int 1999; 56(4): 1208–15. - PubMed

Publication types