. 2014 Oct 27;207(2):225-35.
doi: 10.1083/jcb.201405050.

Septins promote stress fiber-mediated maturation of focal adhesions and renal epithelial motility

Affiliations

Septins promote stress fiber-mediated maturation of focal adhesions and renal epithelial motility

Lee Dolat et al. J Cell Biol. .

Abstract

Organogenesis and tumor metastasis involve the transformation of epithelia to highly motile mesenchymal-like cells. Septins are filamentous G proteins, which are overexpressed in metastatic carcinomas, but their functions in epithelial motility are unknown. Here, we show that a novel network of septin filaments underlies the organization of the transverse arc and radial (dorsal) stress fibers at the leading lamella of migrating renal epithelia. Surprisingly, septin depletion resulted in smaller and more transient and peripheral focal adhesions. This phenotype was accompanied by a highly disorganized lamellar actin network and rescued by the actin bundling protein α-actinin-1. We show that preassembled actin filaments are cross-linked directly by Septin 9 (SEPT9), whose expression is increased after induction of renal epithelial motility with the hepatocyte growth factor. Significantly, SEPT9 overexpression enhanced renal cell migration in 2D and 3D matrices, whereas SEPT9 knockdown decreased migration. These results suggest that septins promote epithelial motility by reinforcing the cross-linking of lamellar stress fibers and the stability of nascent focal adhesions.


Figures

Figure 1.
Figure 1.
Septin filaments interface with RSF and TA stress fibers in the leading lamellae of renal epithelia. (A) Confocal images of SEPT2 (green), actin stress fibers (phalloidin; red), and FAs (paxillin; white) in HGF-treated (16 h) MDCK epithelia. White arrows point to RSFs that connect with the TA. (B) 3D rendering of the lamellar region outlined in A. Arrows point to SEPT2 fibers that localize on FA-anchored RSFs. Bars, 1 µm. (C) Quantification of SEPT2 colocalization with F-actin (green) and vice versa (red). Error bars indicate SEM. (D) SIM images show ventral and dorsal optical sections from the lamellar region of an HGF-treated MDCK cell. The arrowhead points to SEPT9 localization on the dorsal segment of an RSF that connects with the TA. (E) SIM images show an HGF-treated MDCK cell stained for F-actin (phalloidin; red), SEPT2 (green), and paxillin (white). FA-anchored RSF (1) and TA filaments (2) are shown in higher magnification. Arrowheads point to SEPT2 localization on and between actin filaments. (F) Still frames show FA formation (paxillin-mCherry; red) and subsequent recruitment of SEPT2-YFP (green). Arrows point to septin accumulation at the distal end of a nascent focal adhesion. (G) TIRF microscopy kymograph shows recruitment of SEPT2-YFP (green) to a nascent RSF (ABP140-ABD-mCherry, red). (H) Inverted monochrome images show frames from spinning disk confocal time-lapse microscopy of HGF-treated MDCK cells expressing ABP140-ABD-mCherry and SEPT2-YFP. A subset of TA filaments and an RSF were pseudo-colored red and superimposed onto the inverted monochrome image of the SEPT2-YFP channel. SEPT2-YFP elements recruited to the junction of the RSF with the TA were pseudo-colored green. The overlay image shows the pseudocolored stress fibers and SEPT2 outlined in the inverted monochrome frames. The arrow points to the RSF end and its junction point with the TA.
Figure 2.
Figure 2.
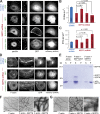
Septins regulate the organization of the lamellar actin network and are required for the stabilization of nascent FAs. (A) Confocal images of MDCK cells, which were transfected with mCherry-expressing plasmids that encode for control or SEPT2 shRNAs and stained for paxillin after treatment with HGF. The red broken line highlights the cell edge. Panels on the right show enlarged views of the black boxed region. (B and C) Graphs show FA size and number from MDCK cells (n = 20) treated with control, SEPT2, and SEPT9 shRNAs. (D) Graph shows FA distance from the cell edge of MDCK cells (n = 10) treated with control (n = 903 FAs), SEPT2 #1 (n = 749 FAs), SEPT2 #2 (n = 512 FAs), and SEPT9 shRNAs (n = 840 FAs). (E) The graph shows FA lifetime in three different MDCK cells treated with control (n = 6,066 FAs) and SEPT2 shRNAs (n = 10,528 FAs). (F) The graph shows the rates of FA (n = 45) assembly and disassembly in cells treated with control and SEPT2 shRNAs. (G) Representative profiles of the kinetics of paxillin-GFP fluorescence in MDCK cells treated with control and SEPT2 shRNAs. (H) Confocal images show 786-O cells stained for total paxillin (red) and phosphorylated pY118-paxillin (green). Insets show GFP expression from plasmids encoding for control and SEPT2 shRNAs. Panels on the right show enlarged views from the boxed regions. (I) Bar graphs show the ratio of the fluorescence intensity of pY118-paxillin to total paxillin in MDCK cells (n = 10) treated with control (n = 740 FAs) and SEPT2 shRNAs (n = 962 FAs), and 786-O cells (n = 10) treated with control (n = 757 FAs) and SEPT2 shRNAs (n = 602 FAs). (J) Confocal images of control and SEPT2-depleted MDCK cells stained for F-actin (phalloidin; red) and paxillin (white). Insets show GFP expression from plasmids encoding for control and SEPT2 shRNAs. Panels on the right show enlarged views of the boxed region. (K) The plot shows line scans of phalloidin fluorescence across the leading edges of MDCK cells (n = 13) treated with control (n = 54 line scans) and SEPT2 shRNAs (n = 56 line scans). Fluorescence quantifications were performed with a custom MATLAB code (supplemental code 1). (L and M) Graphs show the mean number of RSFs per lamellar length (L) and mean length of RSFs (M) in MDCK cells treated with control (n = 43) and SEPT2 shRNAs (n = 72). (N) Inverted monochrome frames show ABP140-ABD-mCherry from total internal reflection fluorescence (TIRF) microscopy of MDCK cells treated with control or SEPT2 shRNAs and HGF. Arrows point to RSFs that persist and grow over time in control cells, and stress fibers that dissipate in SEPT2-depleted cells. Error bars indicate SEM. **, P < 0.01; ***, P < 0.001.
Figure 3.
Figure 3.
SEPT9 functions as an actin cross-linking protein in FA maturation. (A) Confocal images of paxillin-stained MDCK cells transfected with mCherry-expressing plasmids that encode for control or SEPT2 shRNAs, and RLC-DD-GFP, α-actinin-GFP, or GFP vectors. The boxed regions are enlarged in the panels on the immediate right. Bars, 10 µm. (B and C) Graphs show FA size (B) and number per square micrometer (C) in control cells expressing GFP (n = 1,650 FAs; 25 cells), and SEPT2 knockdown cells expressing GFP (n = 1,567 FAs; 24 cells), α-actinin-1-GFP (n = 1,556 FAs; 20 cells), RLC-DD-GFP (n = 1,962 FAs; 18 cells), and α-actinin-1-ΔABD-GFP (n = 1,962 FAs; 20 cells). Error bars indicate SEM. *, P < 0.05; **, P < 0.01; ***, P < 0.001. (D) Confocal images of MDCK cells transfected with mCherry-expressing plasmids encoding for control or SEPT2 shRNAs, and α-actinin-1-GFP or GFP vectors. Cells were stained for F-actin (phalloidin). The boxed regions are enlarged in the panels on the immediate right. Bars, 10 µm. (E) The Coomassie-stained gel shows equal volumes of supernatant (S) and pellet (P) fractions from low-speed sedimentation of prepolymerized actin filaments in the presence of recombinant SEPT2/6/7 and SEPT9. (F and G) Negative stain EM images of actin filaments in the absence and presence of recombinant SEPT6 or SEPT9. Boxed regions (F) are shown at a higher magnification in G. Bars, 0.5 µm.
Figure 4.
Figure 4.
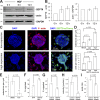
SEPT9 promotes the motility of renal epithelia during EMT. (A) Western blot of HGF-treated MDCK cell lysates probed for SEPT9, actin, and GAPDH. (B) Graphs show the median, lowest, and highest (error bars) ratio values of the SEPT9, actin, and GAPDH band intensities from three independent experiments. Values were normalized to the protein band intensity ratios at 0 h of HGF treatment. (C) Maximum intensity projections from 3D confocal microscopy images of HGF-treated renal cysts of stable MDCK cells expressing SEPT9-mCherry (green) at low and high levels of expression. 3D renal cysts were grown in collagen and stained for nuclei (DAPI; blue) and F-actin (phalloidin; red). (D) Graphs show the number of extensions per MDCK cyst (n = 23) and the number of cells per extension from untransfected (n = 18), low-expressing (n = 35), and high-expressing (n = 51) MDCK cysts (n = 15). (E) Mean number of extensions per cyst after treatment with DMSO (n = 23) and FCF (n = 19). (F and G) Graphs show the mean percentage of transmigrated 786-O cells expressing GFP and SEPT9-GFP (F), and control and SEPT9 shRNAs from 20 different areas of a transwell filter. (H and I) Graphs show the mean velocity (H; n = 16) and axial ratio of the long to short axes (I; n = 31) of MDCK cells migrating in a 3D matrix in the presence of HGF after transfection with control or SEPT9 shRNAs. Error bars indicate SEM. **, P < 0.01; ***, P < 0.001.

References

    1. Bai, X., Bowen J.R., Knox T.K., Zhou K., Pendziwiat M., Kuhlenbäumer G., Sindelar C.V., and Spiliotis E.T.. 2013. Novel septin 9 repeat motifs altered in neuralgic amyotrophy bind and bundle microtubules. J. Cell Biol. 203:895–905. 10.1083/jcb.201308068 - DOI - PMC - PubMed
    1. Berginski, M.E., and Gomez S.M.. 2013. The Focal Adhesion Analysis Server: a web tool for analyzing focal adhesion dynamics. F1000 Res. 2:68 - PMC - PubMed
    1. Bowen, J.R., Hwang D., Bai X., Roy D., and Spiliotis E.T.. 2011. Septin GTPases spatially guide microtubule organization and plus end dynamics in polarizing epithelia. J. Cell Biol. 194:187–197. 10.1083/jcb.201102076 - DOI - PMC - PubMed
    1. Bravo-Cordero, J.J., Hodgson L., and Condeelis J.. 2012. Directed cell invasion and migration during metastasis. Curr. Opin. Cell Biol. 24:277–283. 10.1016/j.ceb.2011.12.004 - DOI - PMC - PubMed
    1. Burridge, K., and Wittchen E.S.. 2013. The tension mounts: stress fibers as force-generating mechanotransducers. J. Cell Biol. 200:9–19. 10.1083/jcb.201210090 - DOI - PMC - PubMed

Publication types