. 2014 Dec;166(4):2115-32.
doi: 10.1104/pp.114.250647. Epub 2014 Oct 27.

gigantea suppresses immutans variegation by interactions with cytokinin and gibberellin signaling pathways

Affiliations

gigantea suppresses immutans variegation by interactions with cytokinin and gibberellin signaling pathways

Aarthi Putarjunan et al. Plant Physiol. 2014 Dec.

Abstract

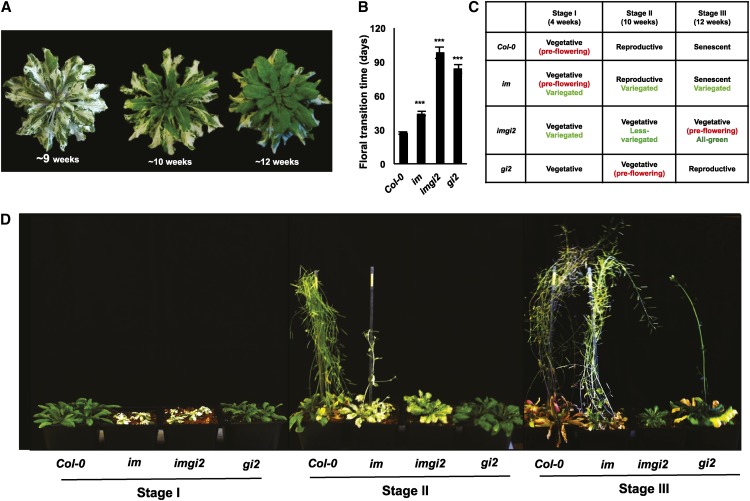
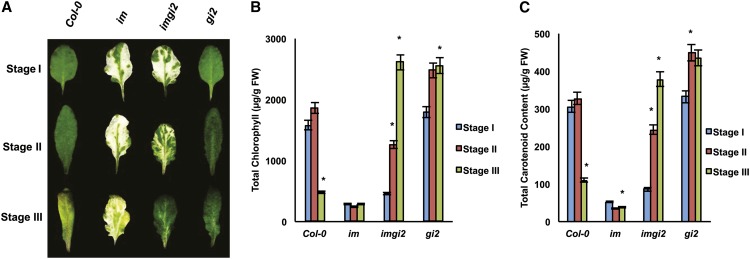
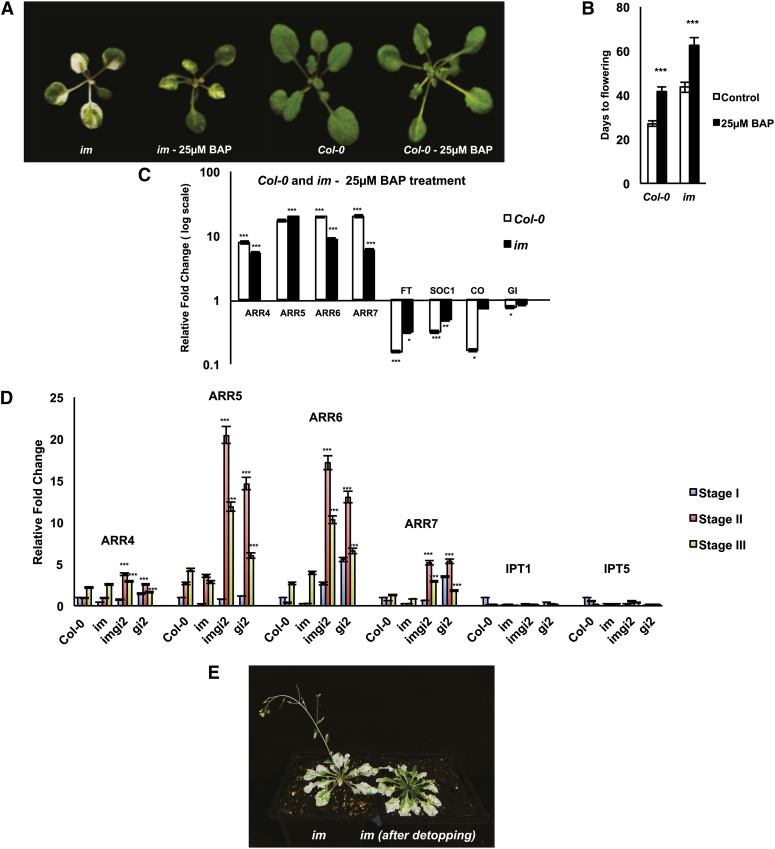
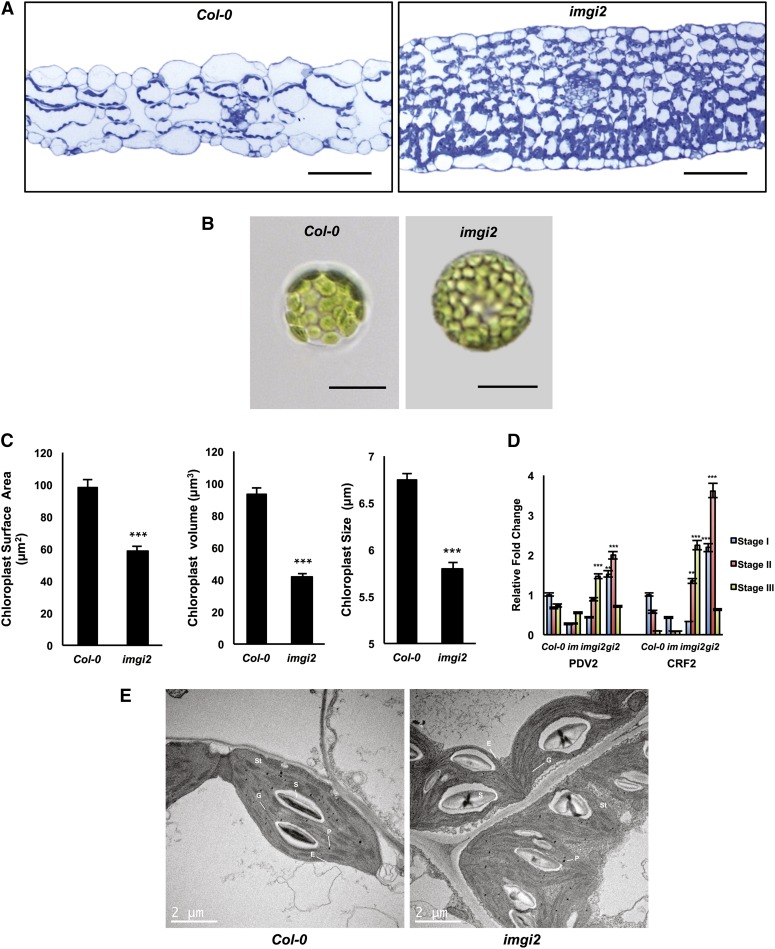
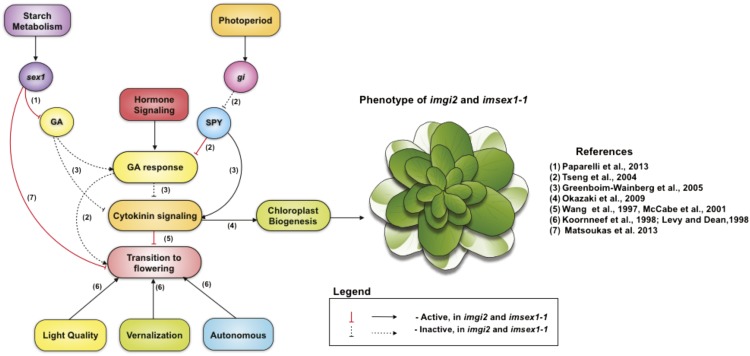
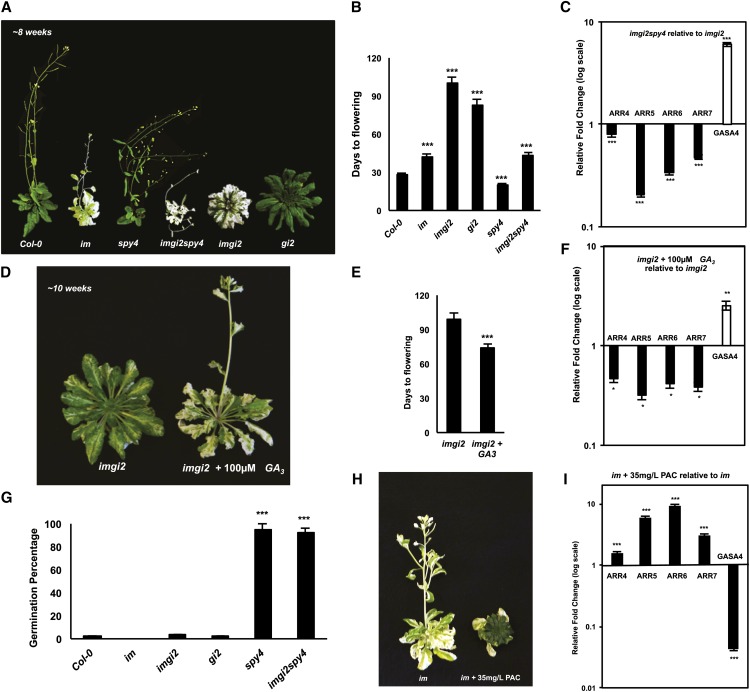
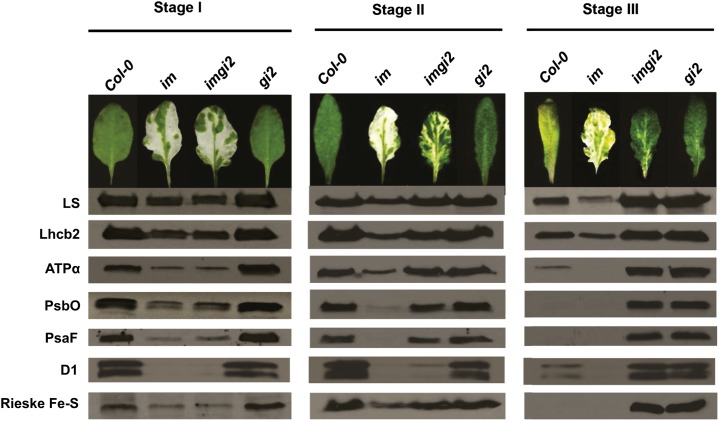
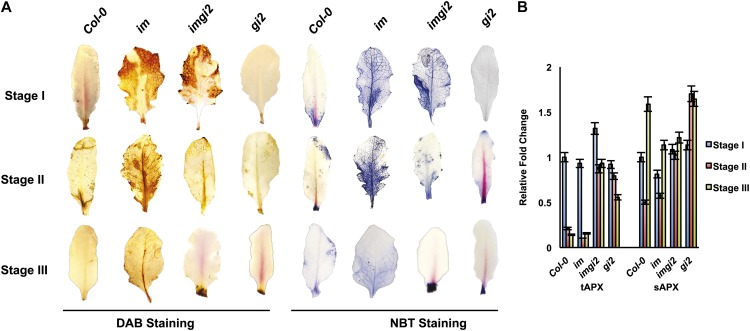
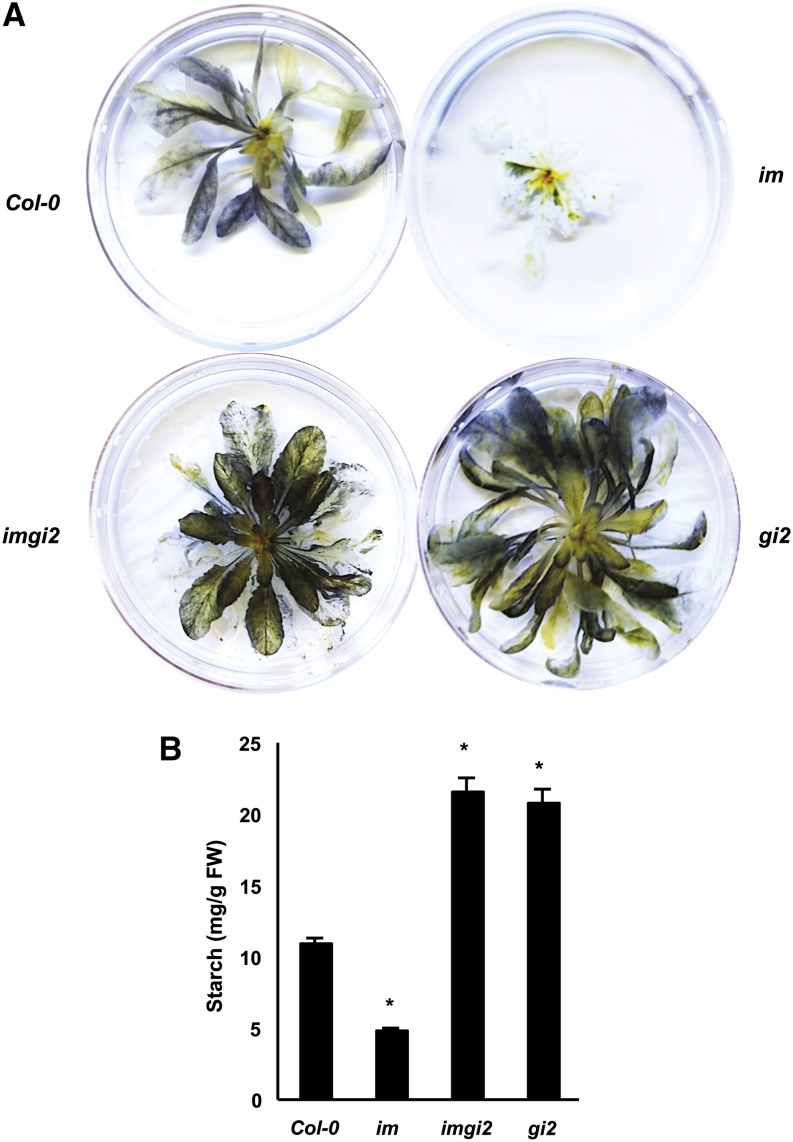
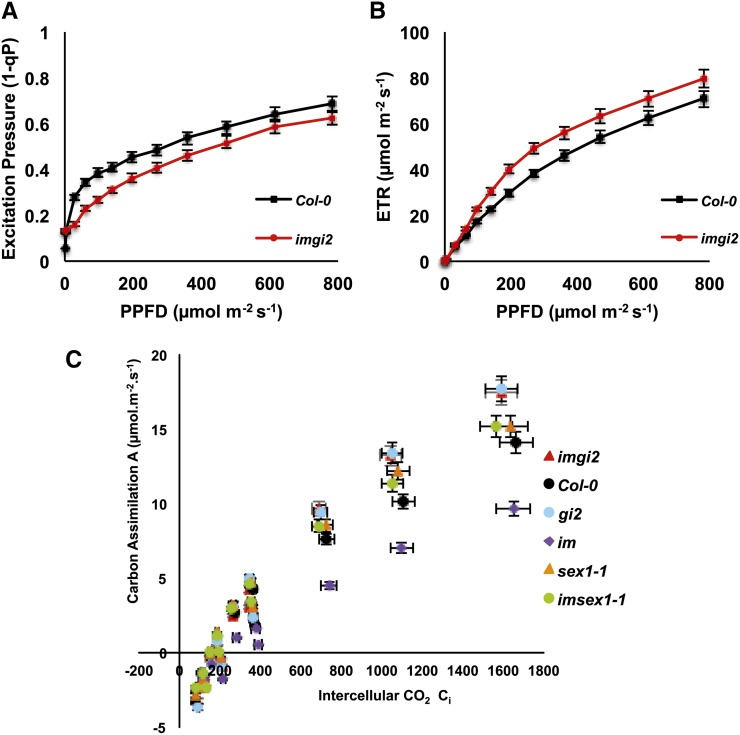
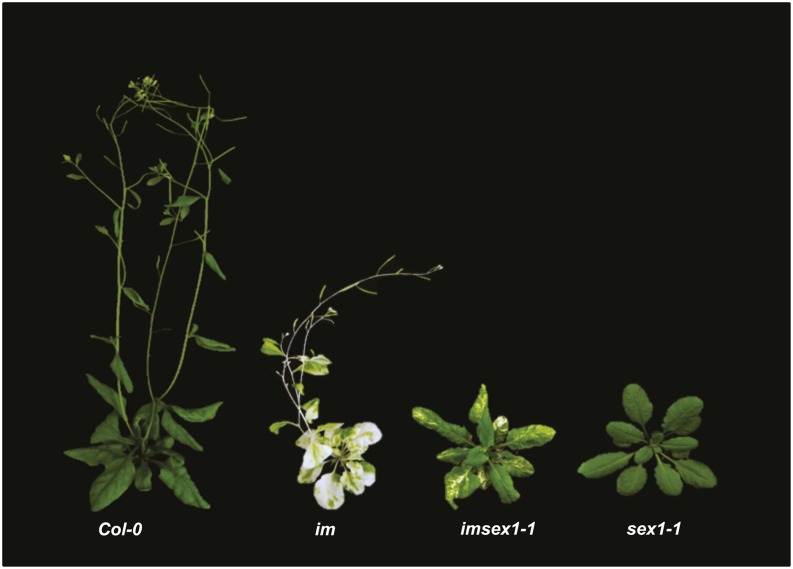
The immutans (im) variegation mutant of Arabidopsis (Arabidopsis thaliana) is an ideal model to gain insight into factors that control chloroplast biogenesis. im defines the gene for PTOX, a plastoquinol terminal oxidase that participates in the control of thylakoid redox. Here, we report that the im defect can be suppressed during the late stages of plant development by gigantea (gi2), which defines the gene for GI, a central component of the circadian clock that plays a poorly understood role in diverse plant developmental processes. imgi2 mutants are late flowering and display other well-known phenotypes associated with gi2, such as starch accumulation and resistance to oxidative stress. We show that the restoration of chloroplast biogenesis in imgi2 is caused by a development-specific derepression of cytokinin signaling that involves cross talk with signaling pathways mediated by gibberellin (GA) and SPINDLY (SPY), a GA response inhibitor. Suppression of the plastid defect in imgi2 is likely caused by a relaxation of excitation pressures in developing plastids by factors contributed by gi2, including enhanced rates of photosynthesis and increased resistance to oxidative stress. Interestingly, the suppression phenotype of imgi can be mimicked by crossing im with the starch accumulation mutant, starch excess1 (sex1), perhaps because sex1 utilizes pathways similar to gi. We conclude that our studies provide a direct genetic linkage between GI and chloroplast biogenesis, and we construct a model of interactions between signaling pathways mediated by gi, GA, SPY, cytokinins, and sex1 that are required for chloroplast biogenesis.


Figures

Figure 1.
Figure 1.
Growth stages of imgi2, gi2, im, and the wild type. A, imgi2 rosettes at 9, 10, and 12 weeks after germination. Plants were grown at 22°C under conditions of continuous illumination (100 μmol m−2 s−1). B, Time taken to achieve the floral transition in the wild type (Col-0), im, imgi2, and gi2. Values represent averages ± se of five independent replicates relative to Col-0 (***P < 0.001). C, Summary table of developmental stages associated with Col-0, im, imgi2, and gi2 at 4 weeks (stage I), 10 weeks (stage II), and 12 weeks (stage III) after germination. D, Representative Col-0, im, imgi2, and gi2 plants examined at the three developmental stages.
Figure 2.
Figure 2.
Leaf morphologies and pigment analyses. A, Leaf developmental stages of representative, fully expanded leaves of Col-0, im, imgi2, and gi2. B and C, Chlorophyll and carotenoid contents of the leaves in A. Values represent averages ± se of three independent replicates relative to stage I plants (*P < 0.05). FW, Fresh weight.
Figure 3.
Figure 3.
Cytokinin responses. A, Three-week-old im and Col-0 plants were sprayed with 25 μm BAP every 3 d for a period of 2 weeks; shown are plants after treatment for 2 weeks. B, Time taken to achieve the floral transition in the plants in A. Values represent averages ± se of five independent replicates (***P < 0.001 relative to control plants). C, Total cell RNAs were isolated from im and Col-0 leaves that emerged after the 2-week BAP treatment, and real-time qRT-PCR analyses were performed to examine the expression of cytokinin response genes (ARR4ARR7) and marker genes for the floral transition. Values are normalized to ACTIN and relative to control im and Col-0 and represent averages ± se of three technical and two biological replicates (***P < 0.001, **P < 0.01, *P < 0.05). D, Real-time qRT-PCR for cytokinin response genes (ARR4ARR7) and cytokinin biosynthesis genes (IPT1 and IPT5) in Col-0, im, imgi2, and gi2 across all three developmental stages. The values are normalized to ACTIN and relative to Col-0 stage I plants for each gene and represent averages ± se of three technical and two biological replicates (***P < 0.001 and **P < 0.01 relative to Col-0 stage I plants). E, Representative im and detopped im plants approximately 7 weeks after germination; im was detopped at approximately 6 weeks.
Figure 4.
Figure 4.
imgi2 leaf and chloroplast morphologies. A, Light micrographs of cross sections from fully expanded Col-0 and imgi2 leaves at the same developmental stage (just prior to flowering) stained with 1% (w/v) Toluidine Blue. Bars = 50 μm. B, Bright-field images of imgi2 and Col-0 protoplasts isolated from leaves (as in A). Bars = 20 μm. C, Chloroplast surface area, volume, and length in Col-0 and imgi2. Values represent averages ± se of 50 independent replicates. imgi2 plastids show a significant decrease in all three parameters in comparison with Col-0 (***P < 0.001). D, Expression analysis using real-time qRT-PCR for PDV2 and CRF2 in Col-0, im, imgi2, and gi2 across all three developmental stages. Values are normalized to ACTIN and relative to Col-0 stage I plants and represent averages ± se of three technical and two biological replicates (***P < 0.001 and **P < 0.01). E, Transmission electron micrographs of Col-0 and imgi2 chloroplasts from leaves just prior to flowering. E, Envelope; G, grana; P, plastoglobule; S, starch granule; St, stroma.
Figure 5.
Figure 5.
Mechanism of variegation suppression in imgi2 and imsex1-1. Through its interaction with SPY and GA signaling, gi causes a derepression of cytokinin signaling that alters chloroplast biogenesis as well as the floral transition time in imgi2. imsex1-1 plants resemble the phenotype of imgi2 plants, possibly by utilizing the same downstream components (cytokinin-GA signaling pathways) as imgi2, causing the suppression of variegation late in development.
Figure 6.
Figure 6.
Rescue of imgi2 by spy and GA. A, Representative Col-0, im, spy4, imgi2spy4, imgi2, and gi2 at approximately 8 weeks after germination. Plants were grown as in Figure 1A. B, Time taken to achieve the floral transition in Col-0, im, spy4, imgi2spy4, imgi2, and gi2. Values represent averages ± se of five independent replicates (***P < 0.001 relative to Col-0 plants). C, qRT-PCR analysis of cytokinin response genes (ARR4ARR7) and a GA response gene, GASA4, in imgi2spy4 and imgi2 at the same developmental stage (just prior to flowering). Expression values were normalized to ACTIN and relative to imgi2 plants and represent averages ± se of three technical and two biological replicates (***P < 0.001). D, Four-week-old imgi2 plants were watered with or without 100 μm GA3 twice weekly for 6 weeks. E, Time taken to achieve the floral transition in the plants in D. Values represent averages ± se of five independent replicates (***P < 0.001 relative to imgi2 plants of the same age). F, qRT-PCR analysis of cytokinin response genes (ARR4ARR7) and a GA response gene, GASA4, in the plants in D. Values were normalized to ACTIN and relative to nontreated imgi2 plants and represent averages ± se of three technical and two biological replicates (**P < 0.01 and *P < 0.05). G, Col-0, im, imgi2, gi2, spy4, and imgi2spy4 seeds were plated on MS medium supplemented with 35 mg L−1 PAC. The average germination percentage was determined after 10 d from 75 seeds sown on three independent plates (25 seeds per plate). Values represent averages ± se for percentage of seedlings that germinated on each of the plates (***P < 0.001 relative to Col-0). H, Representative im and PAC-treated im plants. Plants were grown as in Figure 1A and watered with or without PAC (35 mg L−1); PAC treatment commenced approximately 2 weeks after germination and continued for another 4 weeks. I, qRT-PCR analysis of cytokinin response genes (ARR4ARR7) and the GA response gene, GASA4, in the plants in H (i.e. 6 weeks after germination). Expression values were normalized to ACTIN and relative to im control plants and represent averages ± se of three technical and two biological replicates (***P < 0.001).
Figure 7.
Figure 7.
Photosynthetic protein accumulation. Total leaf proteins were isolated from the top two fully expanded rosette leaves of Col-0, im, imgi2, and gi2 at stages I to III. The proteins were loaded on an equal fresh weight basis for electrophoresis via 12% SDS-PAGE. Immunoblot analysis used polyclonal antibodies to the large subunit of Rubisco (LS), the light-harvesting complex protein (Lhcb2), the α-subunit of ATP synthase (ATPα), PSII subunit O (PsbO), PSI subunit F (PsaF), PSII reaction center protein (D1), and the Rieske Fe-S center of the cytochrome b6f complex (Rieske Fe-S).
Figure 8.
Figure 8.
ROS accumulation. A, DAB and NBT staining to detect H2O2 and O2, respectively, in Col-0, im, imgi2, and gi2 across all three developmental stages. B, Expression analysis using real-time qRT-PCR for stromal APX (sAPX) and thylakoid APX (tAPX) genes in Col-0, im, imgi2, and gi2 at stages I to III. Expression values are normalized to ACTIN and relative to stage I Col-0 plants and represent averages ± se of three technical and two biological replicates.
Figure 9.
Figure 9.
Starch accumulation. A, Qualitative analysis of starch accumulation in Col-0, im, imgi2, and gi2 at the same developmental stage (just prior to flowering). Plants were removed from the soil and stained with potassium iodide/iodine solution (Lugol’s iodine), destained in water for 1 h, and then photographed. B, Quantitative analysis of starch levels in Col-0, im, imgi2, and gi2 at the same developmental stage (prior to flowering). Values represent averages ± se of three independent replicates (*P < 0.05 relative to Col-0 plants). FW, Fresh weight.
Figure 10.
Figure 10.
Photosynthesis and carbon assimilation. A and B, Chlorophyll fluorescence parameters were measured on detached leaves from imgi2 and Col-0 under varying light intensities. Excitation pressure is a measure of the redox state of the first stable electron acceptor of PSII and is quantified using the parameter 1-qP (photochemical quenching), and ETR is the relative linear electron transport rate. C, CO2 assimilation rates (A) with respect to the internal CO2 concentrations (Ci) in Col-0, im, imgi2, gi2, imsex1-1, and sex1-1 plants at the same developmental stage (just prior to flowering). The A-Ci curves were plotted at a photosynthetic photon flux density of 200 μmol m−2 s−1. Values represent averages ± se of five biological replicates.
Figure 11.
Figure 11.
Suppression of variegation in imsex1-1 double mutants. Representative Col-0, im, imsex1-1, and sex1-1 plants are shown approximately 10 weeks after germination. The imsex1-1 plants are late flowering and produce variegated leaves early in development but all-green leaves later in development, similar to imgi2 plants.

References

    1. Albrecht M, Klein A, Hugueney P, Sandmann G, Kuntz M (1995) Molecular cloning and functional expression in E. coli of a novel plant enzyme mediating ζ-carotene desaturation. FEBS Lett 372: 199–202 - PubMed
    1. Aluru MR, Bae H, Wu D, Rodermel SR (2001) The Arabidopsis immutans mutation affects plastid differentiation and the morphogenesis of white and green sectors in variegated plants. Plant Physiol 127: 67–77 - PMC - PubMed
    1. Aluru MR, Stessman DJ, Spalding MH, Rodermel SR (2007) Alterations in photosynthesis in Arabidopsis lacking IMMUTANS, a chloroplast terminal oxidase. Photosynth Res 91: 11–23 - PubMed
    1. Baerr JN, Thomas JD, Taylor BG, Rodermel SR, Gray GR (2005) Differential photosynthetic compensatory mechanisms exist in the immutans mutant of Arabidopsis thaliana. Physiol Plant 124: 390–402
    1. Cao S, Jiang S, Zhang R (2006) The role of GIGANTEA gene in mediating the oxidative stress response and in Arabidopsis. Plant Growth Regul 48: 261–270

Publication types

MeSH terms

Associated data

LinkOut - more resources