

Comparative Analysis of Sorghum bicolor Proteome in Response to Drought Stress and following Recovery
- PMID: 25349737
- PMCID: PMC4198819
- DOI: 10.1155/2014/395905
Comparative Analysis of Sorghum bicolor Proteome in Response to Drought Stress and following Recovery
Abstract
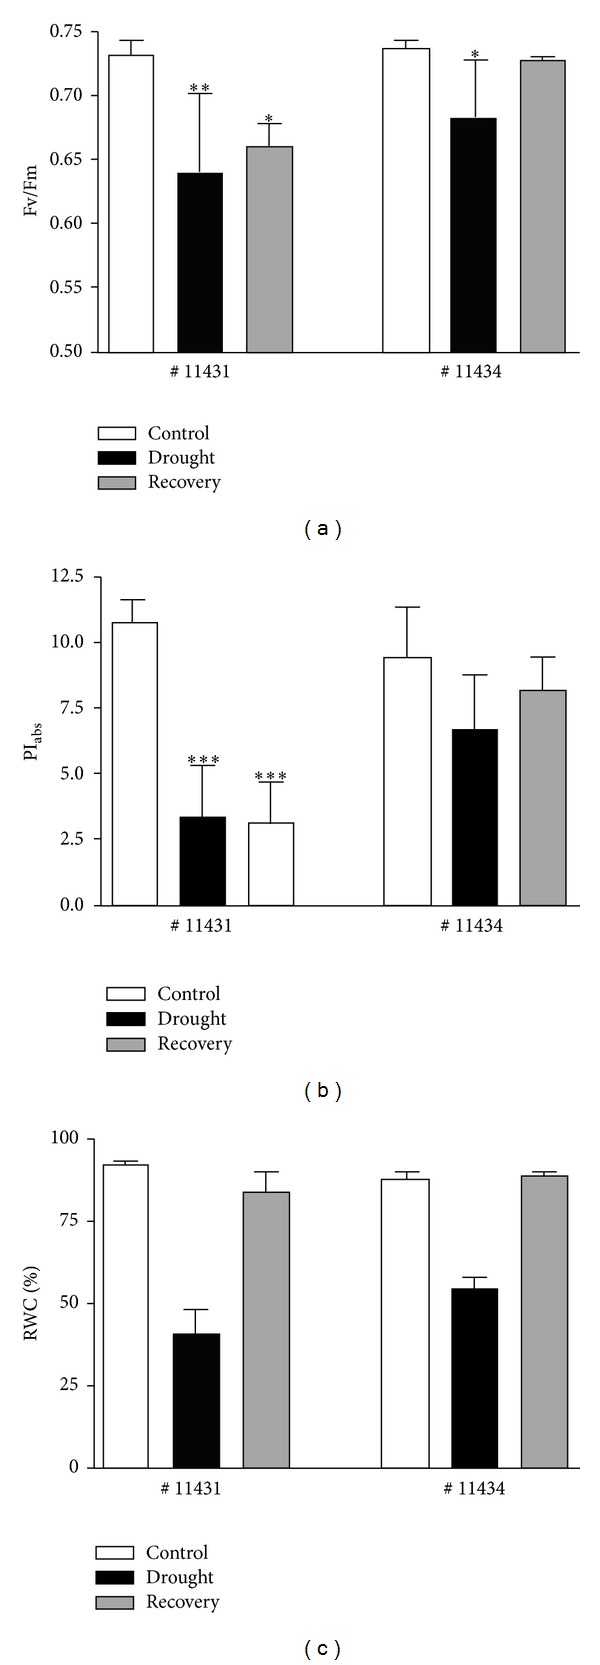
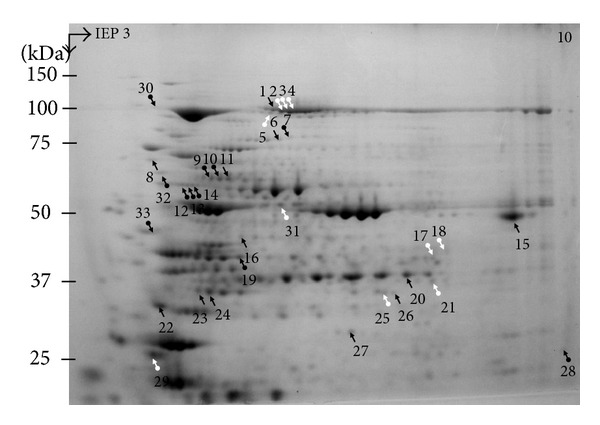
The adaptive response of Sorghum bicolor landraces from Egypt to drought stress and following recovery was analyzed using two-dimensional difference gel electrophoresis, 2D-DIGE. Physiological measurements and proteome alterations of accession number 11434, drought tolerant, and accession number 11431, drought sensitive, were compared to their relative control values after drought stress and following recovery. Differentially expressed proteins were analysed by Matrix assisted laser desorption ionisation time-of-flight mass spectrometry, MALDI-TOF-MS. Alterations in protein contents related to the energy balance, metabolism (sensu Mewes et al. 1997), and chaperons were the most apparent features to elucidate the differences between the drought tolerant and sensitive accessions. Further alterations in the levels of proteins related to transcription and protein synthesis are discussed.
Figures
Similar articles
-
Comparative analysis of barley leaf proteome as affected by drought stress.Planta. 2013 Mar;237(3):771-81. doi: 10.1007/s00425-012-1798-4. Epub 2012 Nov 6. Planta. 2013. PMID: 23129216
-
Proteomic responses of drought-tolerant and drought-sensitive cotton varieties to drought stress.Mol Genet Genomics. 2016 Jun;291(3):1293-303. doi: 10.1007/s00438-016-1188-x. Epub 2016 Mar 3. Mol Genet Genomics. 2016. PMID: 26941218
-
Integrated proteomic analysis of Brachypodium distachyon roots and leaves reveals a synergistic network in the response to drought stress and recovery.Sci Rep. 2017 Apr 7;7:46183. doi: 10.1038/srep46183. Sci Rep. 2017. PMID: 28387352 Free PMC article.
-
Leaf proteome characterization in the context of physiological and morphological changes in response to copper stress in sorghum.Biometals. 2016 Jun;29(3):495-513. doi: 10.1007/s10534-016-9932-6. Epub 2016 Apr 11. Biometals. 2016. PMID: 27067443
-
Proteome research: complementarity and limitations with respect to the RNA and DNA worlds.Electrophoresis. 1997 Aug;18(8):1217-42. doi: 10.1002/elps.1150180804. Electrophoresis. 1997. PMID: 9298643 Review.
Cited by
-
Comparative physiological and root proteome analyses of two sorghum varieties responding to water limitation.Sci Rep. 2020 Jul 16;10(1):11835. doi: 10.1038/s41598-020-68735-3. Sci Rep. 2020. PMID: 32678202 Free PMC article.
-
Deciphering Reserve Mobilization, Antioxidant Potential, and Expression Analysis of Starch Synthesis in Sorghum Seedlings under Salt Stress.Plants (Basel). 2021 Nov 15;10(11):2463. doi: 10.3390/plants10112463. Plants (Basel). 2021. PMID: 34834826 Free PMC article.
-
Conventional and Omics Approaches for Understanding the Abiotic Stress Response in Cereal Crops-An Updated Overview.Plants (Basel). 2022 Oct 26;11(21):2852. doi: 10.3390/plants11212852. Plants (Basel). 2022. PMID: 36365305 Free PMC article. Review.
-
Epiallelic changes in known stress-responsive genes under extreme drought conditions in Brassica juncea (L.) Czern.Plant Cell Rep. 2017 Jan;36(1):203-217. doi: 10.1007/s00299-016-2072-1. Epub 2016 Nov 14. Plant Cell Rep. 2017. PMID: 27844102
-
Elucidation and analyses of the regulatory networks of upland and lowland ecotypes of switchgrass in response to drought and salt stresses.PLoS One. 2018 Sep 24;13(9):e0204426. doi: 10.1371/journal.pone.0204426. eCollection 2018. PLoS One. 2018. PMID: 30248119 Free PMC article.
References
-
- Anjum SA, Xie X-Y, Wang L-C, Saleem MF, Man C, Lei W. Morphological, physiological and biochemical responses of plants to drought stress. African Journal of Agricultural Research. 2011;6(9):2026–2032.
-
- Boyer JS. Plant productivity and environment. Science. 1982;218(4571):443–448. - PubMed
-
- Shao H-B, Chu L-Y, Jaleel CA, Manivannan P, Panneerselvam R, Shao M-A. Understanding water deficit stress-induced changes in the basic metabolism of higher plants-biotechnologically and sustainably improving agriculture and the ecoenvironment in arid regions of the globe. Critical Reviews in Biotechnology. 2009;29(2):131–151. - PubMed
-
- Shinozaki K, Yamaguchi-Shinozaki K. Gene networks involved in drought stress response and tolerance. Journal of Experimental Botany. 2007;58(2):221–227. - PubMed
LinkOut - more resources
Full Text Sources
Other Literature Sources