. 2014 Oct 28;9(10):e110545.
doi: 10.1371/journal.pone.0110545. eCollection 2014.

TLR3 and TLR9 agonists improve postexposure vaccination efficacy of live smallpox vaccines

Affiliations

TLR3 and TLR9 agonists improve postexposure vaccination efficacy of live smallpox vaccines

Tomer Israely et al. PLoS One. .

Abstract

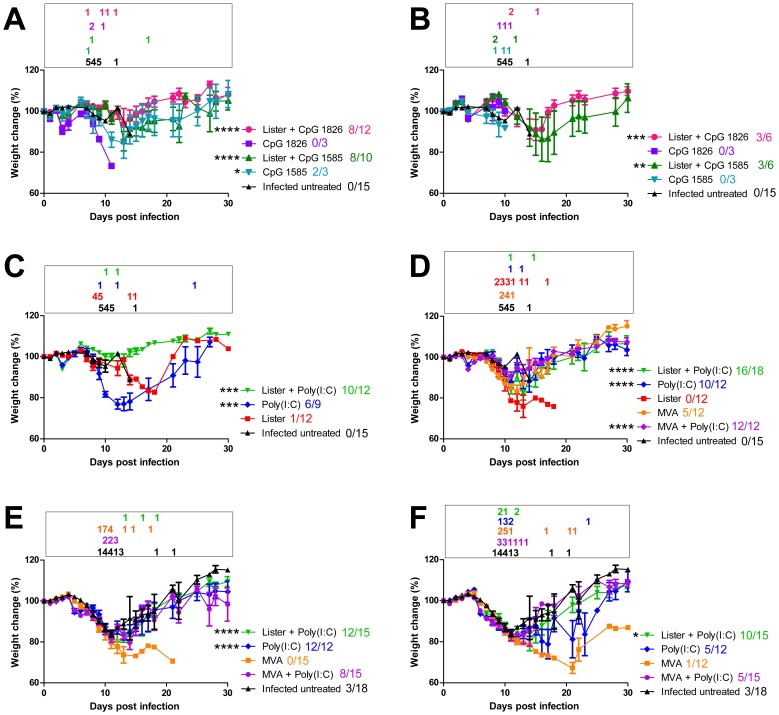
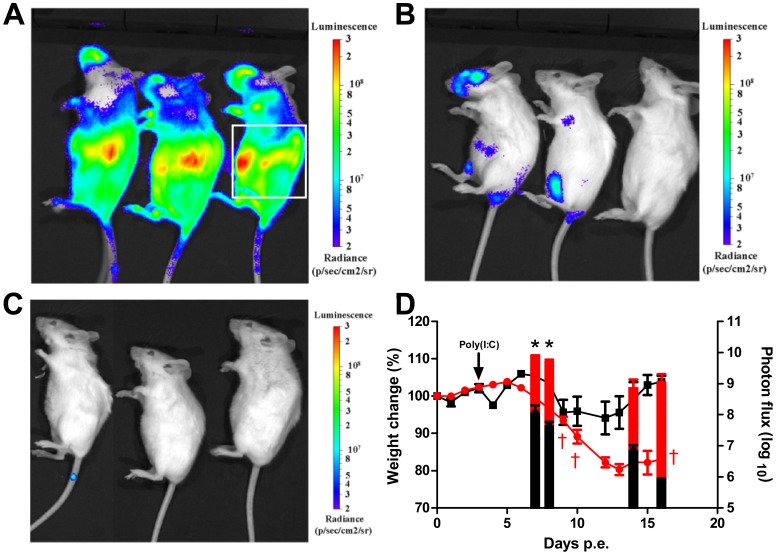
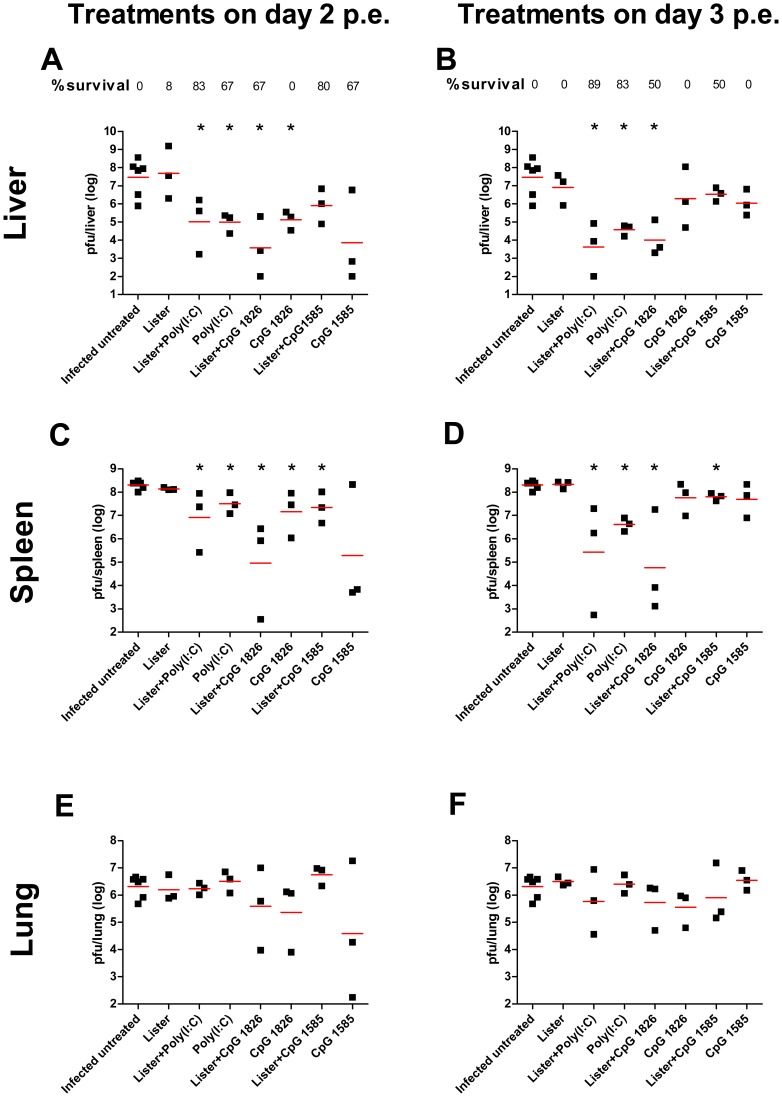
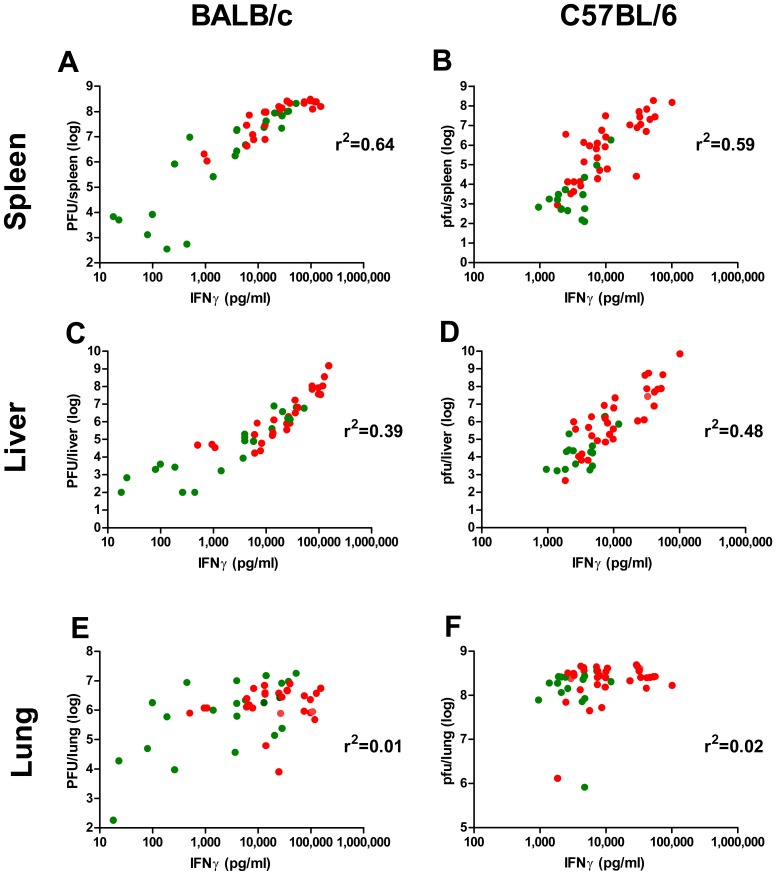
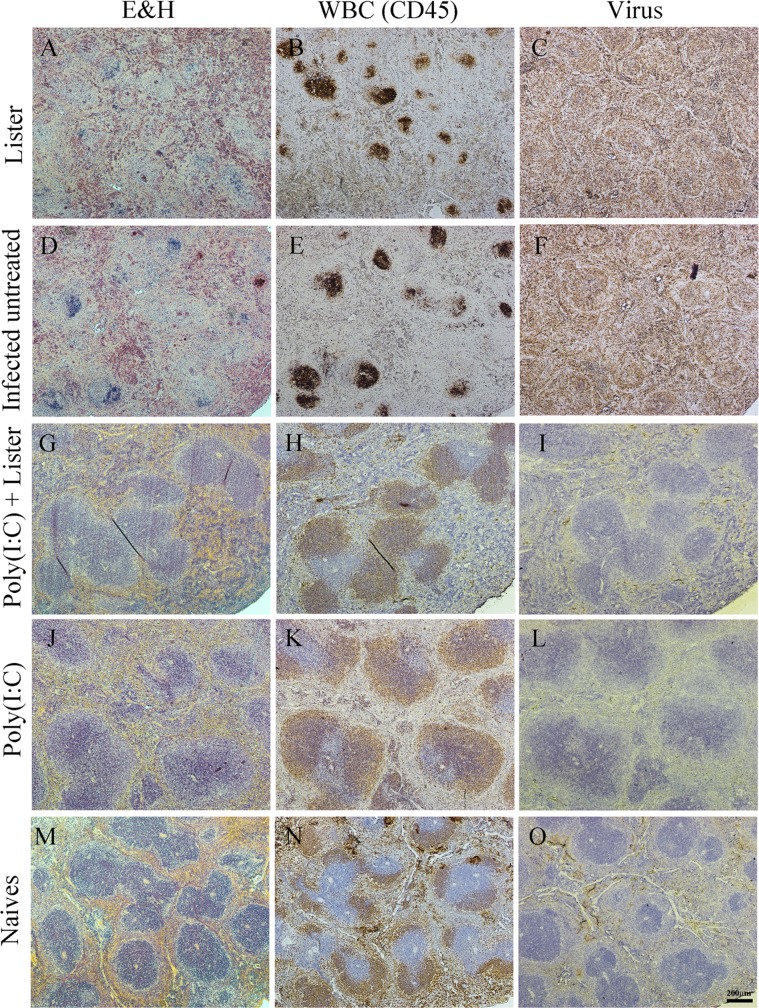
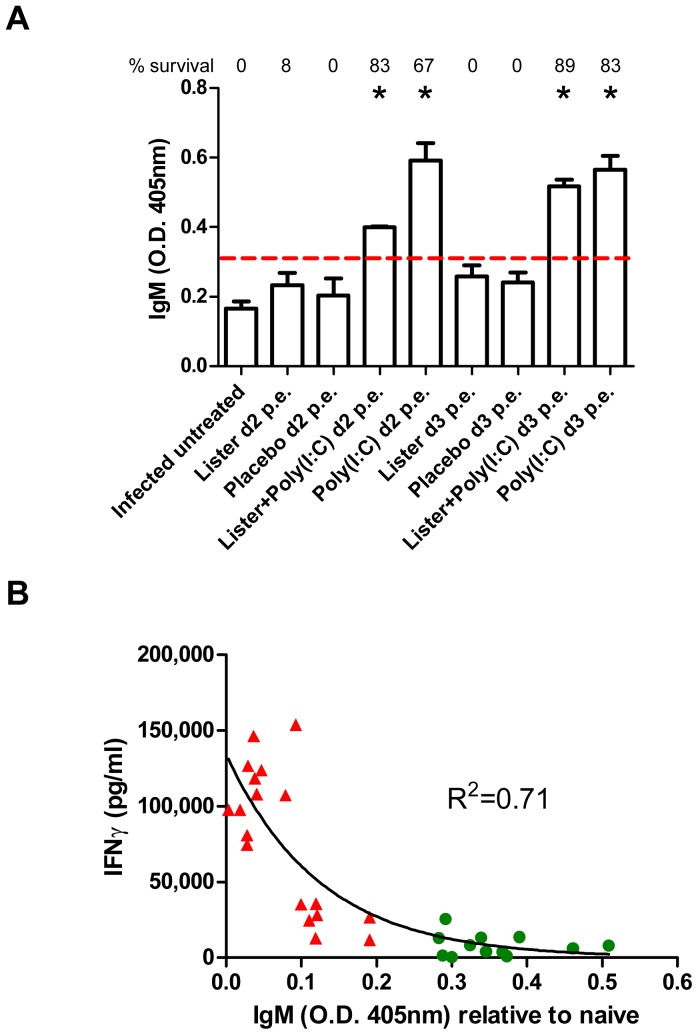
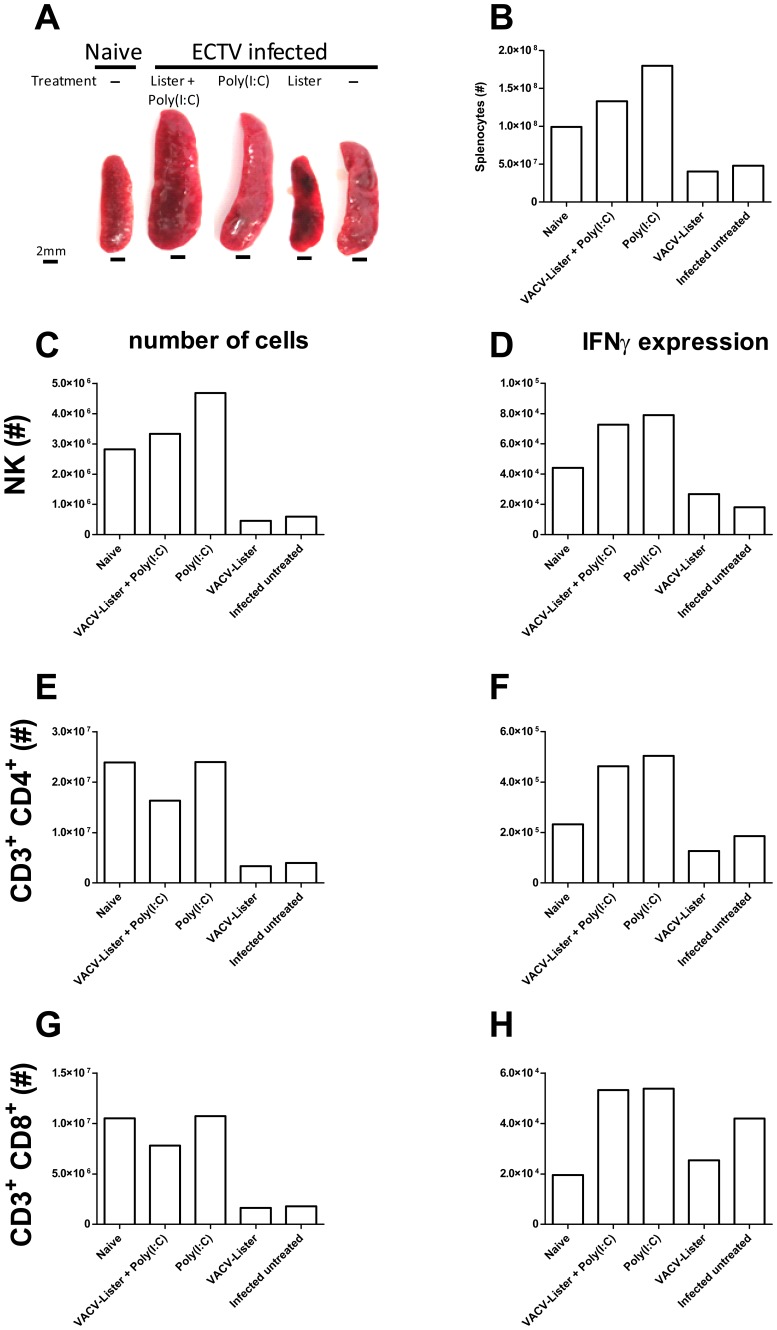
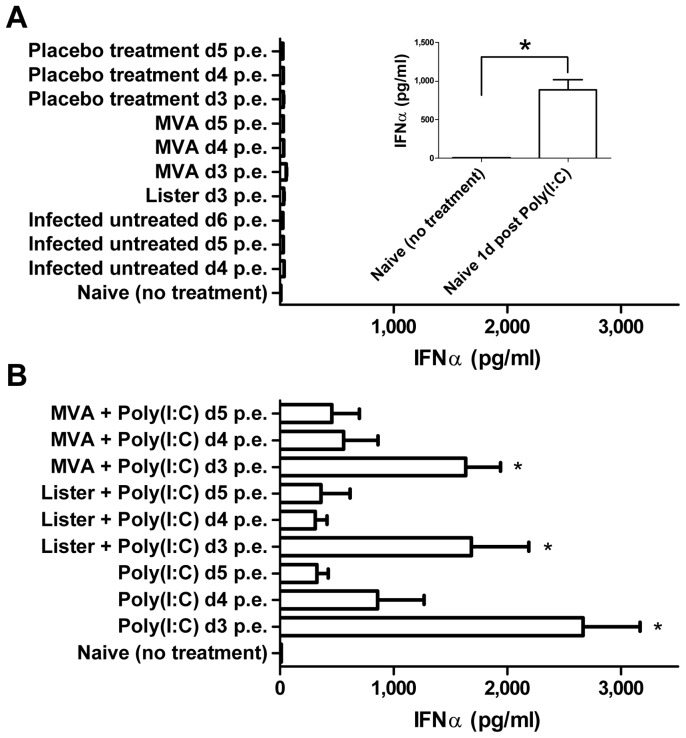
Eradication of smallpox and discontinuation of the vaccination campaign resulted in an increase in the percentage of unvaccinated individuals, highlighting the need for postexposure efficient countermeasures in case of accidental or deliberate viral release. Intranasal infection of mice with ectromelia virus (ECTV), a model for human smallpox, is curable by vaccination with a high vaccine dose given up to 3 days postexposure. To further extend this protective window and to reduce morbidity, mice were vaccinated postexposure with Vaccinia-Lister, the conventional smallpox vaccine or Modified Vaccinia Ankara, a highly attenuated vaccine in conjunction with TLR3 or TLR9 agonists. We show that co-administration of the TLR3 agonist poly(I:C) even 5 days postexposure conferred protection, avoiding the need to increase the vaccination dose. Efficacious treatments prevented death, ameliorated disease symptoms, reduced viral load and maintained tissue integrity of target organs. Protection was associated with significant elevation of serum IFNα and anti-vaccinia IgM antibodies, modulation of IFNγ response, and balanced activation of NK and T cells. TLR9 agonists (CpG ODNs) were less protective than the TLR3 agonist poly(I:C). We show that activation of type 1 IFN by poly(I:C) and protection is achievable even without co-vaccination, requiring sufficient amount of the viral antigens of the infective agent or the vaccine. This study demonstrated the therapeutic potential of postexposure immune modulation by TLR activation, allowing to alleviate the disease symptoms and to further extend the protective window of postexposure vaccination.


Conflict of interest statement

Competing Interests: The authors have declared that no competing interests exist.

Figures

Figure 1
Figure 1. Morbidity based on weight change following post exposure (p.e.) treatments of BALB/c mice.
Mice were infected with 4–20 i.n. ECTV LD50. (A, B) CPGs treatments with or without VACV-Lister on day 2 (A) and 3 (B) p.e. (C) Poly(I:C) treatments with or without VACV-Lister or VACV-Lister alone on day 2 p.e. (D) Poly(I:C) treatments with or without VACV-Lister or MVA and only vaccines treatments on day 3 p.e. (E, F) Poly(I:C) treatments with or without VACV-Lister or MVA and only MVA on day 4 (E) and 5 (F) p.e. Asterisk denote for significant difference in the area-under-the curve of weight changes along the entire experiment of the treated groups vs. the infected untreated group (* P<0.05, ** P<0.01, *** P<0.001, **** P<0.0001, t-test). Data collection for each treatment (weight change (mean, SE)) is indicated. Morbidity of Infected untreated mice from corresponding relevant experiments is shown. The number of mice succumbed to the infection in each time point is outlined color coded in a box above each graph. Survivals out of the total mice in each group are designated color coded next to the legend.
Figure 2
Figure 2. Influence of Poly(I:C) treatment on viral dissemination evaluated by in-vivo bioluminescence imaging.
BALB/c mice were infected with 2 i.n. ECTV-Luc LD50 and left untreated (n = 5) or treated with poly(I:C) on day 3 p.e. (n = 3). (A) Infected untreated mice 8 days p.e. (B) Infected mice treated on day 3 p.e. with poly(I:C) and imaged on day 8 p.e. (C) Poly(I:C) treated group on day 3 p.e. imaged on day 16 p.e. Bioluminescent images were obtained using an f/stop of 1, binning factor of 4, and acquisition time of 1 sec (A, B) or 40 sec (C). Relative photon flux expression is represented by a pseudocolor heat map. (D) Morbidity, based on weight change (lines, left Y axis) and bioluminescence signal on days 7, 8, 14 and 16 p.e. (bars, right Y axis) of the groups shown in panels A–C (red for infected untreated, black for poly(I:C) treated on day 3 p.e.). Bioluminescent signal intensity as total photon flux (photon/s/cm2/sr), was calculated by region of interest (ROI) analysis on the chest and abdomen area marked by a white box on the right mouse in panel (A). Same ROI was used for all mice examined. Asterisk denote for significant reduction in photon flux (n = 3–5 in each group, P<0.05). Dagger represent dead mice.
Figure 3
Figure 3. Viral load following postexposure treatments.
Viral loads were determined by plaque assay from BALB/c mice 8 days postexposure (p.e.) following infection with 18 i.n. ECTV LD50. (A, C, E) viral load in livers, spleens and lungs of mice treated on day 2 p.e. (B, D, E) viral load in livers, spleens and lungs of mice treated on day 3 p.e. Horizontal lines represent the geometric mean of each group. Survival proportions of each group are designated. Asterisk denote for significant reduction in viral load (n = 3 in each treated group) compared to the infected untreated group (n = 6, P<0.05).
Figure 4
Figure 4. Changes in serum IFNγ levels following p.e. treatments.
IFNγ levels were determined 8 days p.e. (A) BALB/c mice were infected with 5–18 i.n. ECTV LD50 and treated on day 3 p.e. with VACV-Lister (n = 6), VACV-Lister and Poly(I:C) (n = 6), Poly(I:C) (n = 6) or placebo (PBS, n = 3). Asterisk indicate for significant difference (P<0.05, n = 9 in the infected untreated group). (B) C57BL/6j mice were infected with 2–3 i.n. ECTV LD50 and treated on days 0–2 p.e. with Poly(I:C) with or without VACV-Lister or MVA and only vaccines treatments (n = 3–6 in each group). Asterisk indicate for significant difference in IFNγ levels compared to the infected untreated group (n = 9, P<0.05). For each experimental group percent protection values are designated above each bar (%) which refer to data collected from all similar treatment groups (Table 1 and 2). Naive BALB/c (n = 5) and C57BL/6j mice (n = 4) had IFNγ values of 11.9±1.0 pg/ml and 8.0±0.8 pg/ml, respectively.
Figure 5
Figure 5. Correlation between IFNγ and viral load.
(A, C, E) Viral loads and IFNγ levels in BALB/c mice infected with 18 i.n. ECTV LD50, untreated (n = 6) or single treated on day 2 or 3 with: poly(I:C) with or without VACV-Lister, CpG-ODNs 1585 and 1826 with or without VACV-Lister and VACV-Lister only (n = 3/group). (B, D, F) Viral loads and IFNγ levels in C57BL/6j mice infected with 2–3 i.n. ECTV LD50, untreated (n = 6) or single treated on day 0 with: poly(I:C) with or without VACV-Lister, VACV-Lister or placebo; day 1: poly(I:C) with or without VACV-Lister or MVA, VACV-Lister or MVA, placebo; day 2: poly(I:C) with or without MVA (n = 3/group), MVA or placebo (n = 3/group). (A, B) spleens; (C, D) livers and (E, F) lungs. Green dots - examined mice from groups in which the survival rate was 50% and above. Red dots - examined mice from groups in which the survival rate was less than 50%, (n = 48 for either BALB/c or C57BL/6j).
Figure 6
Figure 6. Effect of p.e. treatments on the spleen of infected mice.
Spleens were dissected 8 days p.e. from treated mice (3 days post treatment) (A–C, G–L), from untreated (D–F) or from un-infected naïve mice (M–O). Left column - hematoxylin and eosin stain (H&E), middle column - CD45 (brown staining of WBC), right column – viral antigens (brown staining ). Serial sections of (A–C) VACV-Lister treatment; (D–F) infected untreated; (G–I) poly(I:C) and VACV-Lister treatment and (J–L) poly(I:C) treatment. Magnification in all images: X40.
Figure 7
Figure 7. Correlation of IgM levels and treatment efficacy.
(A) IgM level in the sera of BALB/c mice collected 8 days post i.n. infection with 18 LD50 of ECTV was determined by ELISA. Survival proportions of each group are designated above each bar. Asterisk denote for significant difference compared to the infected untreated group (P<0.01, n = 6 in the infected untreated group, n = 3 in the treated groups, t-test). Dotted line represent limit of detection. (B) Correlation between IFNγ and IgM levels of the mice presented in panel A. Green circles - examined mice from groups in which the survival rate was 50% and above. Red triangles - examined mice from groups in which the survival rate was less than 50%. R2 value represents a non-linear fit.
Figure 8
Figure 8. Cellular-immune response following p.e. treatment.
BALB/c mice were infected with 4 i.n. ECTV LD50, left untreated or treated on day 3 p.e. and their spleens were photographed (A) and analyzed by flow-cytometry for the distribution and activation (intracellular IFNγ) of various cell populations. (B) Counting of viable lymphocytes was performed under light microscope. (C–H) Number of total and activated cells of the different cell populations: NK (C, D), of CD3+ CD4+ (E, F) and CD3+ CD8+ (G, H) cells, respectively.
Figure 9
Figure 9. Elevation of IFN-α levels following Poly(I:C) administration.
IFN-α levels were examined in BALB/c mice sera. (A inset) Sera of uninfected naïve mice before (n = 2) and 24 h after poly(I:C) administration (n = 6). IFN-α in sera of 20 i.n. LD50 ECTV (A) infected untreated mice examined on days 4 (n = 6), 5 (n = 3) or 6 (n = 3) p.e. or 24 hours after treatment with VACV-Lister given on day 3, MVA on day 3, 4 or 5 or placebo treated on days 3, 4 or 5 (n = 3 in all groups). (B) IFN-α in sera of mice 24 hours after treatment with poly(I:C) on days 3, 4 or 5 given alone or in combination with VACV-Lister or MVA (n = 3–5/group).

Similar articles

Cited by

References

    1. Fenner F (1982) A successful eradication campaign. Global eradication of smallpox. Rev Infect Dis 4: 916–930. - PubMed
    1. Henderson DA (1999) The looming threat of bioterrorism. Science 283: 1279–1282. - PubMed
    1. Mortimer PP (2003) Can postexposure vaccination against smallpox succeed? Clin Infect Dis 36: 622–629. - PubMed
    1. Cross J (1821) A history of the variolous epidemic which occurred in Norwich, in the year 1819, and destroyed 530 individuals; with an estimate of the protection afforded by vaccination, and a review of past and present opinions upon chicken-pox and modified smallpox.; J EM, editor.
    1. Esteban D, Parker S, Schriewer J, Hartzler H, Buller RM (2012) Mousepox, a small animal model of smallpox. Methods Mol Biol 890: 177–198. - PubMed

Publication types

MeSH terms