. 2014 Oct 28;9(10):e111199.
doi: 10.1371/journal.pone.0111199. eCollection 2014.

Sustained radiosensitization of hypoxic glioma cells after oxygen pretreatment in an animal model of glioblastoma and in vitro models of tumor hypoxia

Affiliations

Sustained radiosensitization of hypoxic glioma cells after oxygen pretreatment in an animal model of glioblastoma and in vitro models of tumor hypoxia

Ryon H Clarke et al. PLoS One. .

Abstract

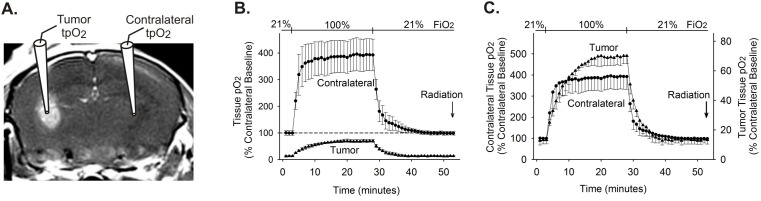
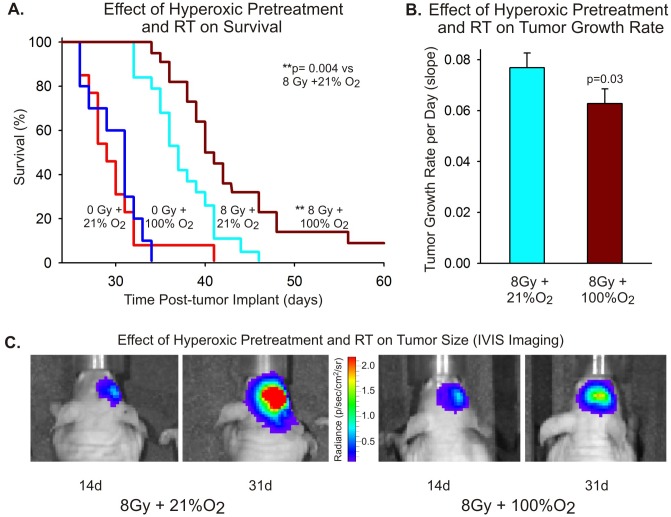
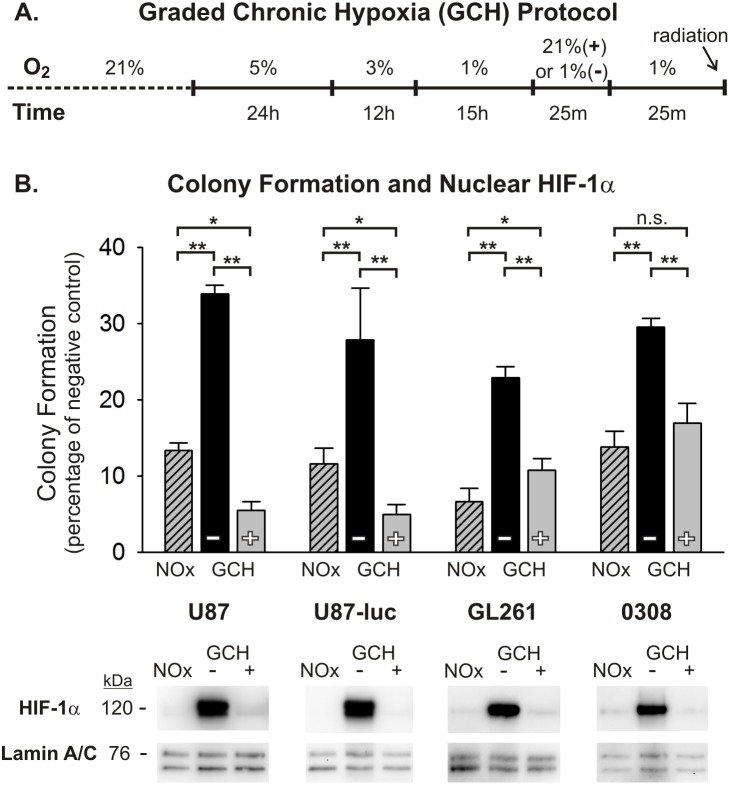
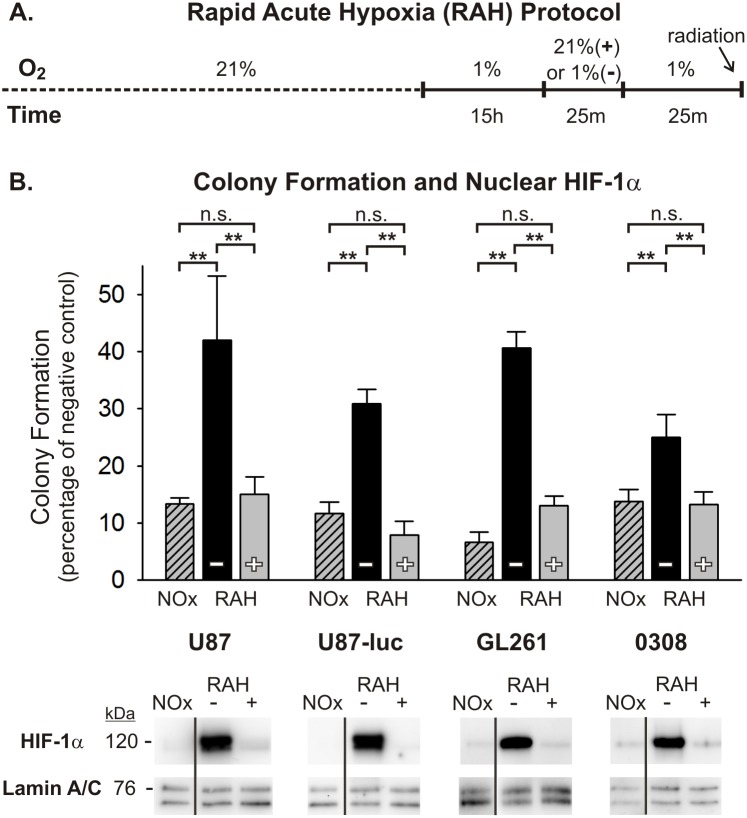
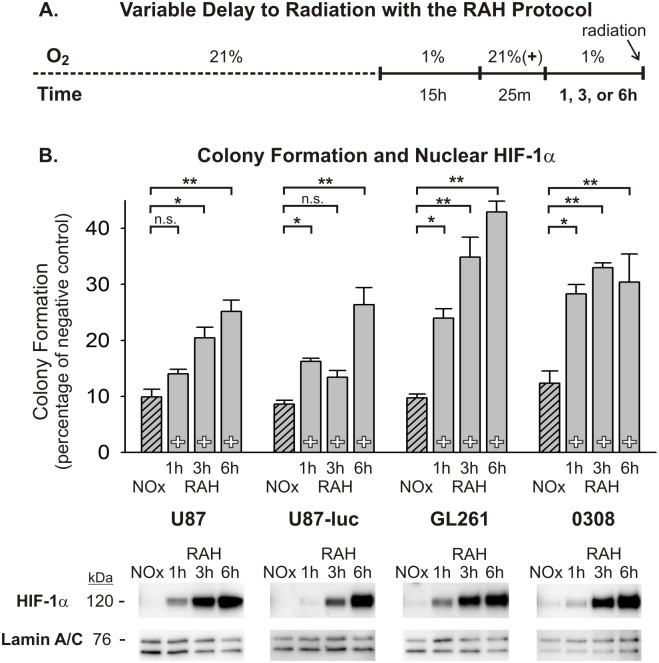
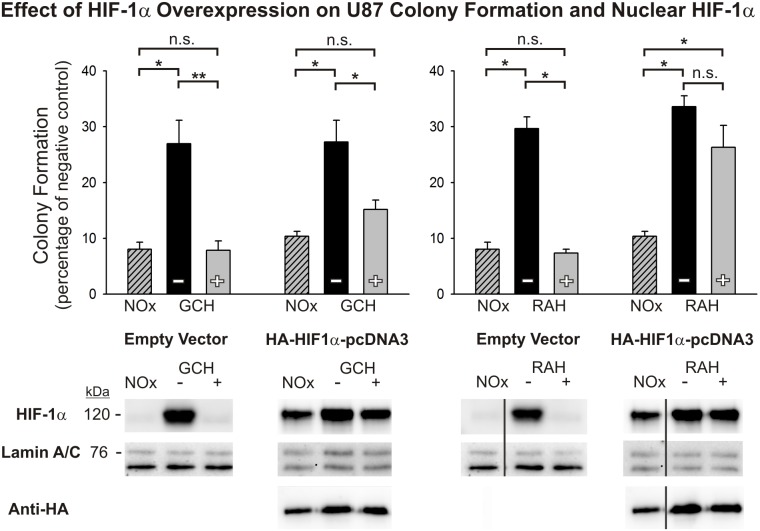
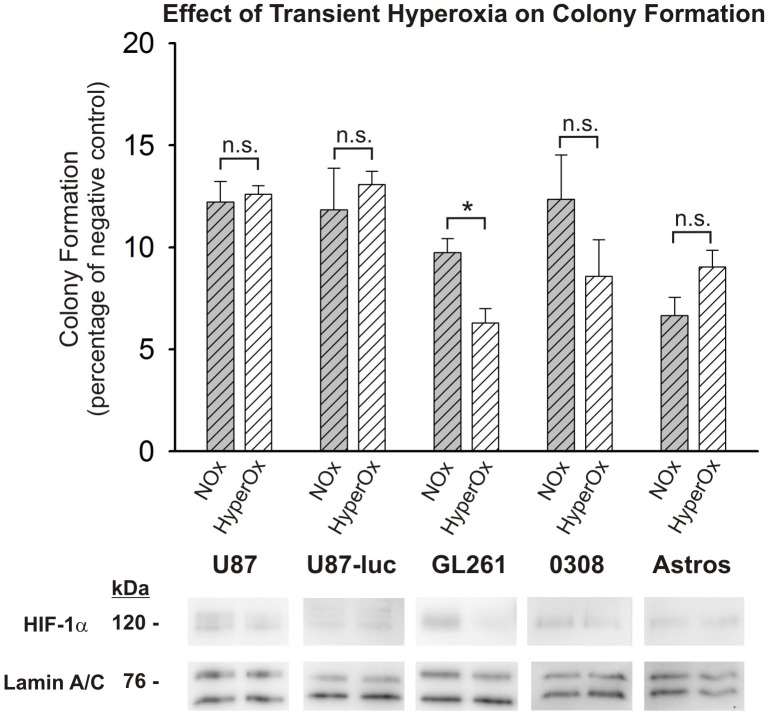
Glioblastoma multiforme (GBM) is the most common and lethal form of brain cancer and these tumors are highly resistant to chemo- and radiotherapy. Radioresistance is thought to result from a paucity of molecular oxygen in hypoxic tumor regions, resulting in reduced DNA damage and enhanced cellular defense mechanisms. Efforts to counteract tumor hypoxia during radiotherapy are limited by an attendant increase in the sensitivity of healthy brain tissue to radiation. However, the presence of heightened levels of molecular oxygen during radiotherapy, while conventionally deemed critical for adjuvant oxygen therapy to sensitize hypoxic tumor tissue, might not actually be necessary. We evaluated the concept that pre-treating tumor tissue by transiently elevating tissue oxygenation prior to radiation exposure could increase the efficacy of radiotherapy, even when radiotherapy is administered after the return of tumor tissue oxygen to hypoxic baseline levels. Using nude mice bearing intracranial U87-luciferase xenografts, and in vitro models of tumor hypoxia, the efficacy of oxygen pretreatment for producing radiosensitization was tested. Oxygen-induced radiosensitization of tumor tissue was observed in GBM xenografts, as seen by suppression of tumor growth and increased survival. Additionally, rodent and human glioma cells, and human glioma stem cells, exhibited prolonged enhanced vulnerability to radiation after oxygen pretreatment in vitro, even when radiation was delivered under hypoxic conditions. Over-expression of HIF-1α reduced this radiosensitization, indicating that this effect is mediated, in part, via a change in HIF-1-dependent mechanisms. Importantly, an identical duration of transient hyperoxic exposure does not sensitize normal human astrocytes to radiation in vitro. Taken together, these results indicate that briefly pre-treating tumors with elevated levels of oxygen prior to radiotherapy may represent a means for selectively targeting radiation-resistant hypoxic cancer cells, and could serve as a safe and effective adjuvant to radiation therapy for patients with GBM.


Conflict of interest statement

Competing Interests: The authors have declared that no competing interests exist.

Figures

Figure 1
Figure 1. 100% FiO2 elevates tpO2 in tumor and healthy brain tissue.
(A) Contrast-enhanced MRI of a mouse brain that was implanted 14 days prior with U87-luc glioma cells is shown. The drawings on the MRI depict the placements of Licox probes used for measuring oxygen levels in the tumor and contralateral brain (striatum). (B and C) The time courses of partial tissue oxygen levels (tpO2) in response to modified FiO2 are shown for tumor (triangles) and contralateral (circles) tissue (n = 3). Oxygen measurements are displayed as a percentage of the baseline tpO2 levels recorded in the contralateral brain. In B, the time courses are plotted using a common ordinate, in order to show the relative levels and changes in tpO2 levels observed in tumor and contralateral brain. In C, the time courses for tumor and contralateral brain are shown on individual ordinates in order to highlight the difference in the rate of change of oxygen levels between the two tissues. Values shown are means and SEMs. Although radiation was not administered in this experiment, the arrow denoting time of radiation delivery provides a reference for subsequent experiments.
Figure 2
Figure 2. Hyperoxic pretreatment improves survival and slows tumor growth.
(A) Surviving fractions of nude mice implanted with U87-luc cells are shown in a Kaplan-Meier plot for animals receiving: no treatment (0 Gy+21%O2, n = 13), hyperoxic pretreatment without radiation (0 Gy+100%O2, n = 10), radiation alone (8 Gy+21%O2, n = 19), and hyperoxic pretreatment with radiation (8 Gy+100%O2, n = 22). Statistical significance was calculated using a Log-Rank (Mantel-Cox) test. (B) A bar graph shows tumor growth rates for animals in the 8 Gy+21%O2 group and the 8 Gy+100%O2 group. Tumor size was assessed by IVIS imaging in vivo performed every 4–5 days. The log of the radiance from up to eight IVIS time points (day 14 to day 46 PTI, depending on individual survival) for each animal was used to perform linear regression analyses of tumor growth. Calculated slopes from these linear regressions were then used to determine average tumor growth rate per day for each animal from each treatment group. Statistical significance was calculated using t-test with Welch’s correction for unequal variance. Error bars are SEMs. (C) IVIS images taken at day 14 and day 31 PTI for two animals, one from the 8 Gy+21%O2 (left) and one from the 8 Gy+100%O2 (right) groups. The scale bar for IVIS radiance is shown between the images for the two animals. Note that the IVIS signal in these images does not directly correspond to tumor size. A low luminescence signal threshold was used to permit comparison between time points.
Figure 3
Figure 3. Normoxic pre-treatment sensitizes glioma cells to radiation after graded chronic hypoxic (GCH) exposure.
(A) The graded chronic hypoxia (GCH) protocol is shown, depicting the timing and severity of hypoxic exposure to four cell lines. Cells either remain in a continuous hypoxic environment (–) or are transiently (25 min) exposed to normoxia 25 min prior to radiation (+). Continuously normoxic cells (NOx) were irradiated as a positive control. (B) The results of anchorage-independent colony forming assays are shown for U87, U87-luc, GL261 glioma cells and 0308 GSCs after 5 Gy radiation exposure under varying oxygen conditions. To allow for ease of comparisons among cell types, raw values are expressed as a percentage of the corresponding cell type’s negative (non-irradiated) control and the means and SEMs are plotted. Each result represents at least three independent samples, plated in triplicate. Holm-Sidak comparisons for multiple groups were used for statistical comparisons of raw values (*p<0.05, **p<0.01). Also shown are Western blots of nuclear HIF-1α at the time of irradiation for each cell type. Corresponding Western blots of lamin A/C are shown as a loading control.
Figure 4
Figure 4. Normoxic pretreatment sensitizes glioma cells to radiation after rapid acute hypoxic (RAH) exposure.
(A) The rapid acute hypoxia (RAH) protocol is shown depicting the timing and severity of hypoxic exposure. Cells either remain in a continuous hypoxic environment (–) or are transiently (25 min) exposed to normoxia 25 min prior to radiation (+). Continuously normoxic cells (NOx) were irradiated as a positive control. (B) The results of anchorage-independent colony forming assays are shown for U87, U87-luc, GL261 glioma cells and 0308 GSCs after 5 Gy radiation exposure under varying oxygen conditions. To allow for ease of comparisons among cell types, raw values are expressed as a percentage of the corresponding cell type’s negative (non-irradiated) control and the means and SEMs are plotted. Each result represents at least three independent samples, plated in triplicate. Holm-Sidak comparisons for multiple groups were used for statistical comparisons of raw values (**p<0.01). Also shown are Western blots of nuclear HIF-1α at the time of irradiation for each cell type. Corresponding Western blots of lamin A/C are shown as a loading control. All lanes shown that are non-adjacent to the negative control (NOx) are denoted with a separating black line.
Figure 5
Figure 5. The duration of enhanced radiosensitivity after normoxic pretreatment differs among cell lines undergoing Graded Chronic Hypoxia.
(A) The GCH protocol is shown with variable delays to radiation after normoxic pretreatment. After GCH, all cells are transiently (25 min) exposed to normoxia for 25 min (+) and are then returned to severe hypoxia (1% O2) for 1, 3, or 6 hours prior to radiation. Continuously normoxic cells (NOx) were irradiated as a positive control. (B) Results from anchorage-independent colony forming assays indicate that the decay of enhanced radiosensitivity differs among cell lines. To allow for ease of comparisons among cell types, raw values are expressed as a percentage of the corresponding cell type’s negative (non-irradiated) control and the means and SEMs are plotted. Each result represents at least three independent samples, plated in triplicate. Holm-Sidak comparisons for multiple groups were used for statistical comparisons of raw values (*p<0.05, **p<0.01). Also shown are Western blots of nuclear HIF-1α at the time of irradiation for each cell line. Corresponding Western blots of lamin A/C are shown as a loading control.
Figure 6
Figure 6. The duration of enhanced radiosensitivity after normoxic pretreatment of cells undergoing Rapid Acute Hypoxia.
(A) The RAH protocol is shown with variable delays to radiation after normoxic pretreatment. In this protocol all cells are transiently (25 min) exposed to normoxia for 25 min (+) and then returned to severe hypoxia (1% O2) for 1, 3, or 6 hours prior to radiation. Continuously normoxic cells (NOx) were irradiated as a positive control. (B) Results from anchorage-independent colony forming assays indicate that the decay of enhanced radiosensitivity for cells in the RAH protocol is generally more rapid than that observed for cells in the GCH protocol. To allow for ease of comparisons among cell types, raw values are expressed as a percentage of the corresponding cell type’s negative (non-irradiated) control and the means and SEMs are plotted. Each result represents at least three independent samples, plated in triplicate. Holm-Sidak comparisons for multiple groups were used for statistical comparisons of raw values (*p<0.05, **p<0.01). Also shown are Western blots of nuclear HIF-1α at the time of irradiation for each cell line. Corresponding Western blots of lamin A/C are shown as a loading control.
Figure 7
Figure 7. HIF-1α overexpression rescues oxygen-induced radioresistance in RAH-treated cells, but not GCH-treated cells.
Results are shown for the anchorage-independent colony forming assays for U87 cells transfected with either an empty vector or HIF-1α expression vector and then exposed to GCH or RAH protocols without (–) or with (+) reoxygenation. Continuously normoxic cells (NOx) were irradiated as a positive control. To allow for ease of comparisons among conditions, raw values are presented as a percentage of that cell type’s negative (non-irradiated) control and the means and SEMs are plotted. Each result represents at least three independent samples, plated in triplicate. Holm-Sidak comparisons for multiple groups were used for statistical comparisons of raw values (*p<0.05, **p<0.01). Western blotting analysis of nuclear HIF-1α at the time of irradiation is shown for each cell type below clonogenic results. Corresponding Western blots of lamin A/C are shown as a loading control and blots for hemagglutinin (HA) are shown below HIF-1α overexpression vector results to demonstrate transfection efficacy. All lanes shown that are non-adjacent to the negative control (NOx) are denoted with a separating black line.
Figure 8
Figure 8. Transient hyperoxia does not sensitize normal human astrocytes to radiation.
Results are shown for the colony forming assays for all previously assayed cell lines and a normal human astrocyte cell line (Astro). Cells were continuously maintained under normoxic conditions (NOx) or exposed to 25 min of hyperoxia (50% O2) and then returned to normoxic conditions for 25 min (HyperOx) before being treated with a 5 Gy dose of radiation. To allow for ease of comparisons among cell types, raw values are expressed as a percentage of the corresponding cells type’s negative (non-irradiated) control and the means and SEMs are plotted. Each result represents three independent samples, plated in triplicate (*p<0.05, Student’s t-test). Also shown are Western blots of nuclear HIF-1α at the time of irradiation for each cell line. Corresponding Western blots of lamin A/C are shown as a loading control.

References

    1. Ostrom QT, Gittleman H, Farah P, Ondracek A, Chen Y, et al. (2013) CBTRUS statistical report: Primary brain and central nervous system tumors diagnosed in the United States in 2006–2010. Neuro Oncol 15 Suppl 2ii1–56. - PMC - PubMed
    1. Kanu OO, Mehta A, Di C, Lin N, Bortoff K, et al. (2009) Glioblastoma multiforme: a review of therapeutic targets. Expert Opin Ther Targets 13: 701–718. - PubMed
    1. Louis DN, Ohgaki H, Wiestler OD, Cavenee WK, Burger PC, et al. (2007) The 2007 WHO classification of tumours of the central nervous system. Acta Neuropathol 114: 97–109. - PMC - PubMed
    1. Kaur B, Khwaja FW, Severson EA, Matheny SL, Brat DJ, et al. (2005) Hypoxia and the hypoxia-inducible-factor pathway in glioma growth and angiogenesis. Neuro Oncol 7: 134–153. - PMC - PubMed
    1. Lakka SS, Gondi CS, Yanamandra N, Olivero WC, Dinh DH, et al. (2004) Inhibition of cathepsin B and MMP-9 gene expression in glioblastoma cell line via RNA interference reduces tumor cell invasion, tumor growth and angiogenesis. Oncogene 23: 4681–4689. - PubMed

Publication types

MeSH terms