. 2014 Oct 28;9(10):e111070.
doi: 10.1371/journal.pone.0111070. eCollection 2014.

Exploring combinations of auditory and visual stimuli for gaze-independent brain-computer interfaces

Affiliations

Exploring combinations of auditory and visual stimuli for gaze-independent brain-computer interfaces

Xingwei An et al. PLoS One. .

Erratum in

Abstract

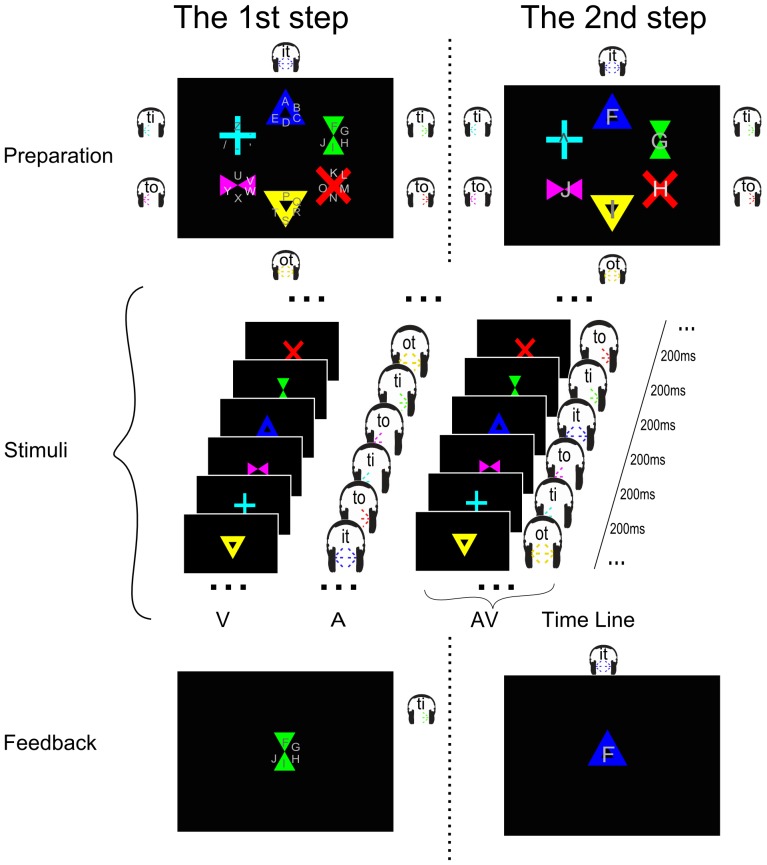
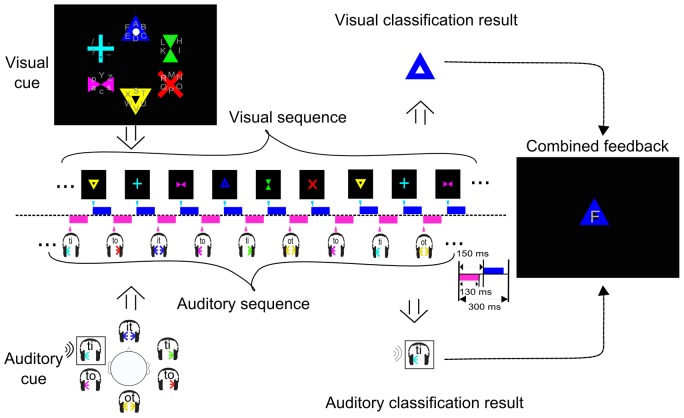
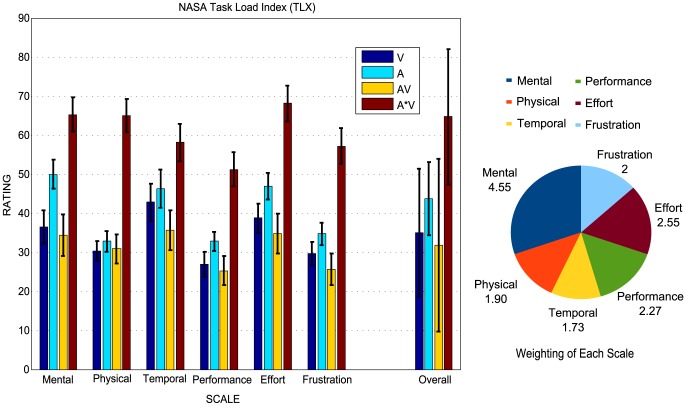
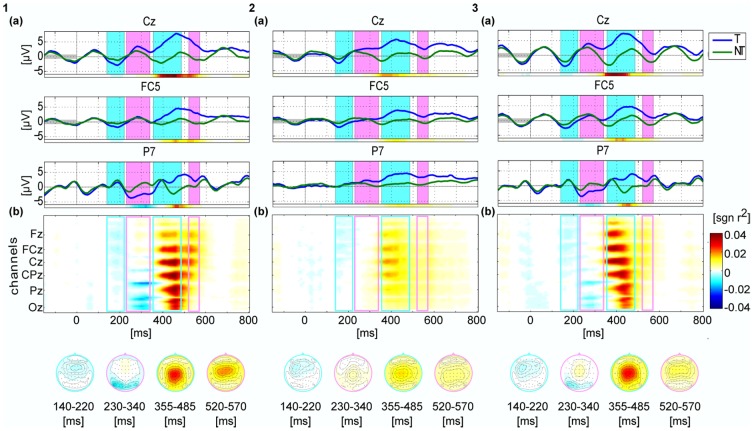
For Brain-Computer Interface (BCI) systems that are designed for users with severe impairments of the oculomotor system, an appropriate mode of presenting stimuli to the user is crucial. To investigate whether multi-sensory integration can be exploited in the gaze-independent event-related potentials (ERP) speller and to enhance BCI performance, we designed a visual-auditory speller. We investigate the possibility to enhance stimulus presentation by combining visual and auditory stimuli within gaze-independent spellers. In this study with N = 15 healthy users, two different ways of combining the two sensory modalities are proposed: simultaneous redundant streams (Combined-Speller) and interleaved independent streams (Parallel-Speller). Unimodal stimuli were applied as control conditions. The workload, ERP components, classification accuracy and resulting spelling speed were analyzed for each condition. The Combined-speller showed a lower workload than uni-modal paradigms, without the sacrifice of spelling performance. Besides, shorter latencies, lower amplitudes, as well as a shift of the temporal and spatial distribution of discriminative information were observed for Combined-speller. These results are important and are inspirations for future studies to search the reason for these differences. For the more innovative and demanding Parallel-Speller, where the auditory and visual domains are independent from each other, a proof of concept was obtained: fifteen users could spell online with a mean accuracy of 87.7% (chance level <3%) showing a competitive average speed of 1.65 symbols per minute. The fact that it requires only one selection period per symbol makes it a good candidate for a fast communication channel. It brings a new insight into the true multisensory stimuli paradigms. Novel approaches for combining two sensory modalities were designed here, which are valuable for the development of ERP-based BCI paradigms.


Conflict of interest statement

Competing Interests: The authors have declared that no competing interests exist.

Figures

Figure 1
Figure 1. Visualization of the experimental design of the experiment for unimodal speller (Visual: V and Auditory: A) and Combined-Speller (AV).
The left column shows the first selection period for group selection. The right column shows the second selection period for symbol selection. The upper channel shows the ‘target cue’ part before stimuli start, including the cue for showing the position (or voice) of the target and the countdown part for hint of the start. The middle panel shows the time sequence of each stimuli paradigm. The lower panel shows the feedback after each selection period. For the first selection period, the group of the target symbol was chosen, and the symbols in that group will re-distributed into these six visual shapes (the last shape, light blue cross, was left blank as the ‘backdoor’ symbol) according to their position in the chosen group.
Figure 2
Figure 2. Visualization of the experimental design of the experiment for Parallel-Speller (V*A).
Six symbols locate in each group, making a total of thirty-six symbols. The presentation of the visual stimuli was used to choose the group the symbol was in. The position of the symbol in the group was selected through the auditory domain. The upper panel shows the sequence of visual target selection, and the lower panel shows that of the auditory target selection.
Figure 3
Figure 3. The NASA TLX workload and the overall weighted score of different conditions.
The left column shows the mean rating with the standard deviation (SD) for each subscale and the overall weighted workload for each condition. The pie chart shows the grand-averaged weighting for each subscale. The total weighting is 15, due to 15 pair-wise comparisons of the sub-scales (see section 2.4).
Figure 4
Figure 4. Grand averaged ERP and spatio-temporal diversity of the class-discriminative information for the first 3 conditions.
Conditions are arranged in columns (left: V, middle: A, right: AV). All plots share the same color scale. The top row shows the ERPs for targets and non-targets of three selected electrodes Cz, FC5 and P7. The pink and green shade areas in each plot marked the time intervals, for which the scalp maps are shown at the bottom also colored accordingly. The colored bar underneath of each plot gives the signed correlation coefficient (sign r2). It indicated the difference between target and non-target classes for the chosen channel. In the middle, the spatio-temporal distribution of class-discriminative information was shown as a matrix plot, under which also the scalp maps of the chosen intervals were shown depicting the averaged r2 values within the time intervals. The matrix plot shows the signed r2 values for each EEG channel and for each time point. The light-blue and light-magenta rectangles depicted the chosen time interval as the shaded area in the top rows.
Figure 5
Figure 5. The ANOVA results of ERP response with factor condition (conditions V, A, and AV; left: Targets, right: Non-Targets).
The time intervals with significant difference of ERP response for conditions V, A, and AV was marked light blue (p <.05). The pink-marked time-zones show the time intervals that have significant difference of conditions V and AV (p <.05).
Figure 6
Figure 6. The ANOVA results of ERP response and class-discriminance (signed r2) maps of Targets versus Non-Targets in condition V*A.
The two columns show the ERP responses for visual (left) and auditory (right) stimuli independently in condition V*A. The first row shows the ERP responses for the three selected electrodes FC5, Cz and PO7. The time intervals with significant difference of ERP response for Targets and Non-Targets was marked light blue (p <.05). The pink-marked time-zones show the time intervals that have more significant difference with p <.01. Spatio-temporal diversities of the class-discriminative information are shown in the second row. All plots share the same color scale (different scale in the colorbar compared to Figure 4). The spatial distribution of class-discriminant information is depicted with scalpmaps for two time intervals.
Figure 7
Figure 7. Single trial classification accuracies in different conditions for the binary target vs non-target discrimination.
Accuracies are estimated by cross-validation on the calibration data using class-wise normalized loss function (chance level  =  0.5). Each colored '*' represents the accuracy for each participant in giving conditions. The edges of the blue box in each column reveal the 25% and 75% data range. The central red mark is the median accuracy overall the participants in the giving condition.
Figure 8
Figure 8. The grand averaged temporal distribution of discriminative information for each condition.
a) The single trial classification for the unimodal spellers and Combined Speller (red: condition V; blue: condition A; black: condition AV). b) The temporal distribution of the single trial classification accuracy for condition V*A (red: visual classification; blue: auditory classification). The time window used in this study is 20 ms with a time step of 5 ms.
Figure 9
Figure 9. Spatial distribution of classification performance.
Classification was made for each electrode individually. The time intervals were chosen by a heuristic between [0 800] after the stimulus onset. The grand average for each of the condition is shown and the binary classification accuracies are indicated by color gradients. The plots in the first row use the same color scale as shown on the right of that row. The figures in the second row use a different color bar as shown on the right of the second row.
Figure 10
Figure 10. The distribution results of online copy spelling.
The histogram shows the number of participants, whose classification accuracies were located in each accuracy scale. The accuracies were separated into 7 scales. ‘Symble|AV’ stands for the symbol selection accuracies in condition AV, and ‘Symbol|V*A’ stands for the symbol selection accuracies in condition V*A. The red bar, which is noted as ‘Visual|V*A’, represents the visual selection accuracies in condition V*A. The green bar, denoted as ‘Auditory|V*A’, shows the auditory selection accuracies distribution. The blue-dominant pie chart shows the proportion of each accuracy scale for the symbol selection accuracies in condition AV. The purple-dominant pie chart shows the proportion in condition V*A.
Figure 11
Figure 11. Spelling speed for each of the 4 conditions plotted against the number of repetitions.
Thin gray lines depict results for single participants and the solid black line depicts the mean. Red dashed lines represent the spelling speed for fixed levels of symbol selection accuracy. Spelling accuracy for the empirical data (solid black line) can be deduced by comparing the black solid line to the red dashed lines. The accuracy is based on the calibration data for each condition.

References

    1. Wolpaw JR, Wolpaw EW (2012) Brain-Computer Interfaces: Principles and Practice. Oxford University Press.
    1. Dornhege G (2007) Toward Brain-Computer Interfacing. MIT Press.
    1. Wolpaw JR, McFarland DJ (2004) Control of a two-dimensional movement signal by a noninvasive brain-computer interface in humans. Proc Natl Acad Sci USA 101: 17849–54.. - PMC - PubMed
    1. Blankertz B, Dornhege G, Krauledat M, Müller KR, Curio G (2007) The non-invasive Berlin brain-computer interface: fast acquisition of effective performance in untrained subjects. Neuroimage 37: 539–50.. - PubMed
    1. Mak JN, Wolpaw JR (2009) Clinical applications of brain-computer interface: current state and future prospects. IEEE Rev Biomed Eng 2: 187–99.. - PMC - PubMed

Publication types

LinkOut - more resources