. 2014 Oct 28;9(10):e111072.
doi: 10.1371/journal.pone.0111072. eCollection 2014.

Examination of the combined effects of chondroitinase ABC, growth factors and locomotor training following compressive spinal cord injury on neuroanatomical plasticity and kinematics

Affiliations

Examination of the combined effects of chondroitinase ABC, growth factors and locomotor training following compressive spinal cord injury on neuroanatomical plasticity and kinematics

Olivier Alluin et al. PLoS One. .

Abstract

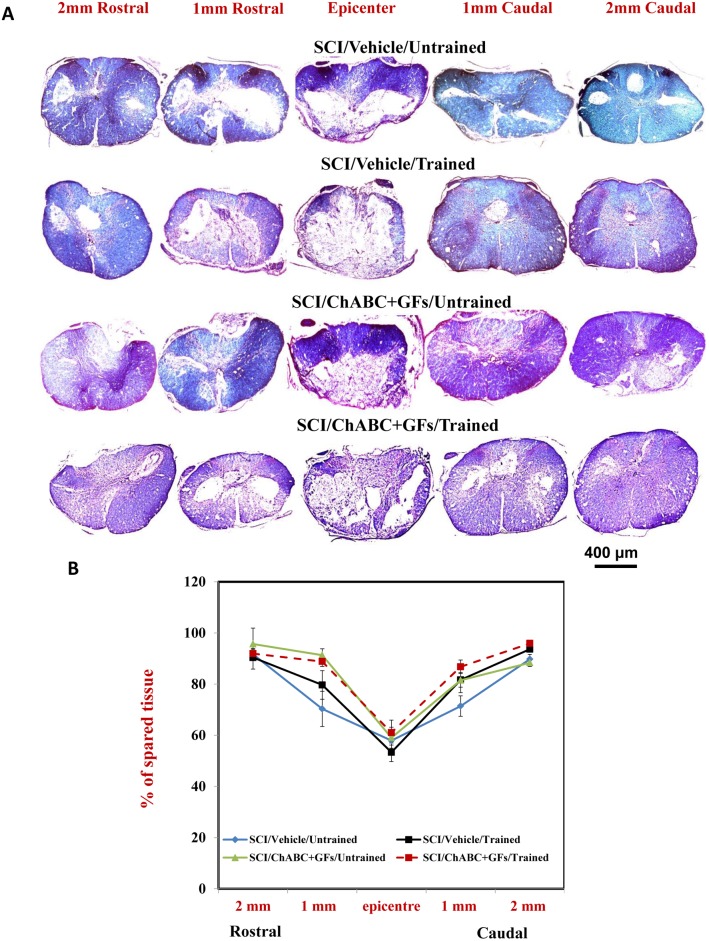
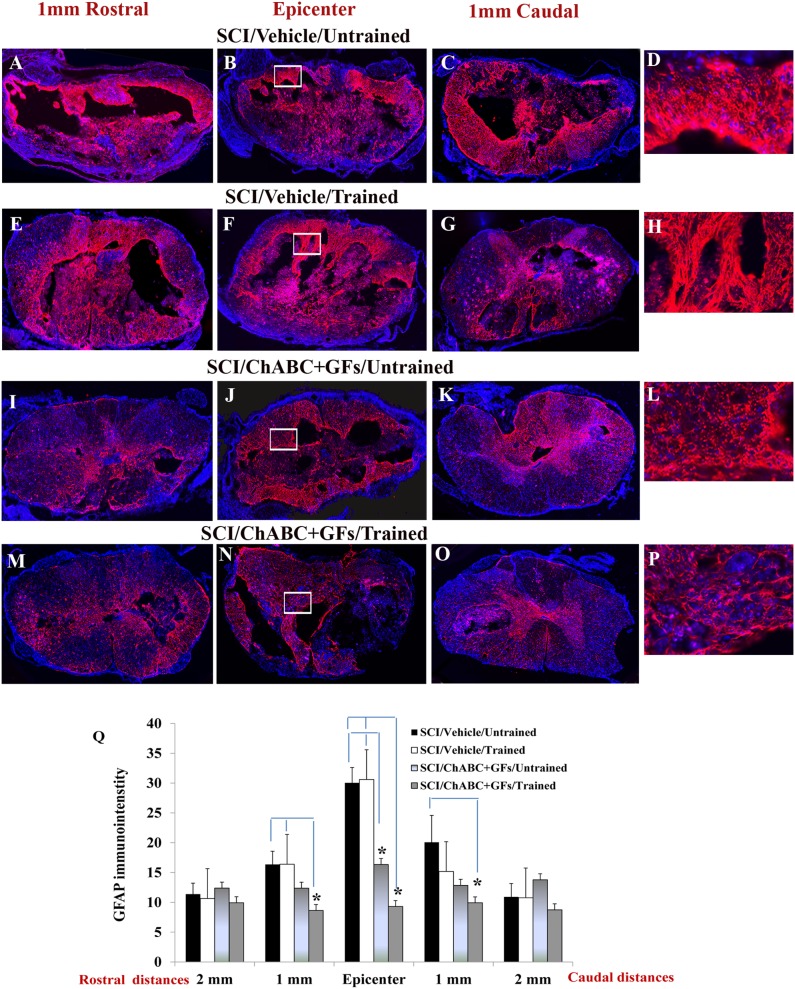
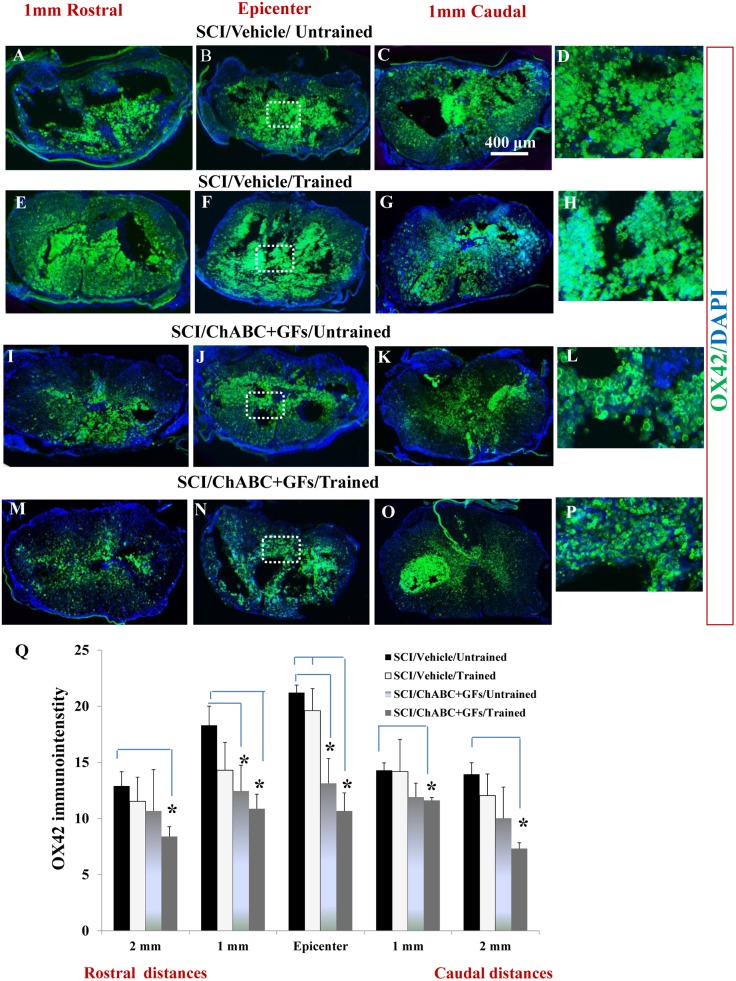
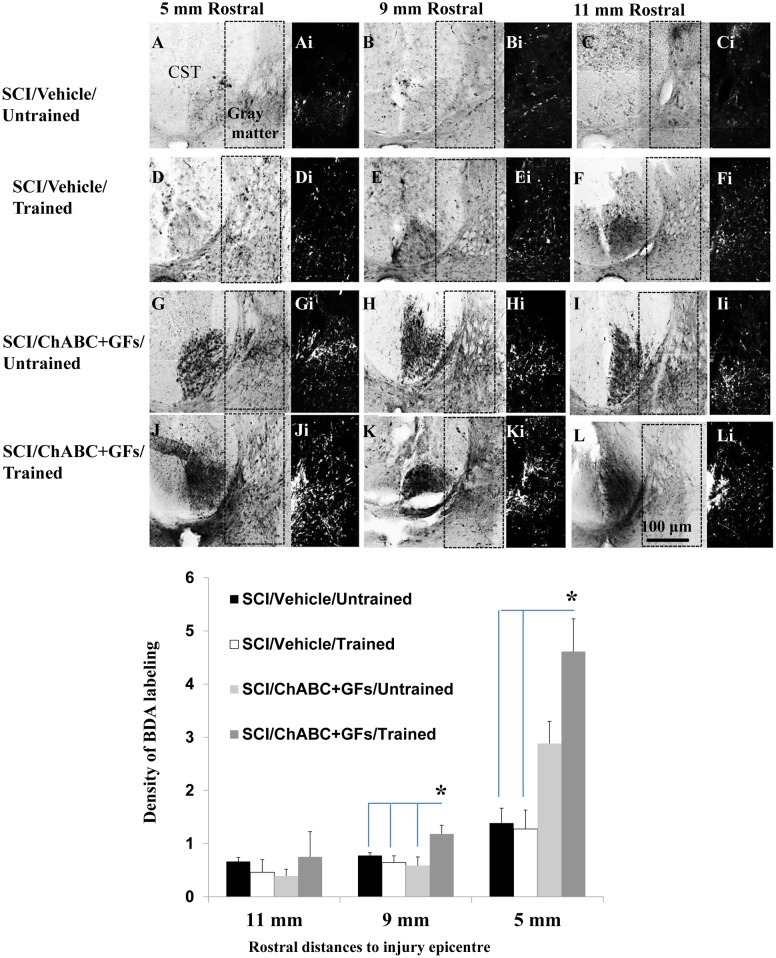
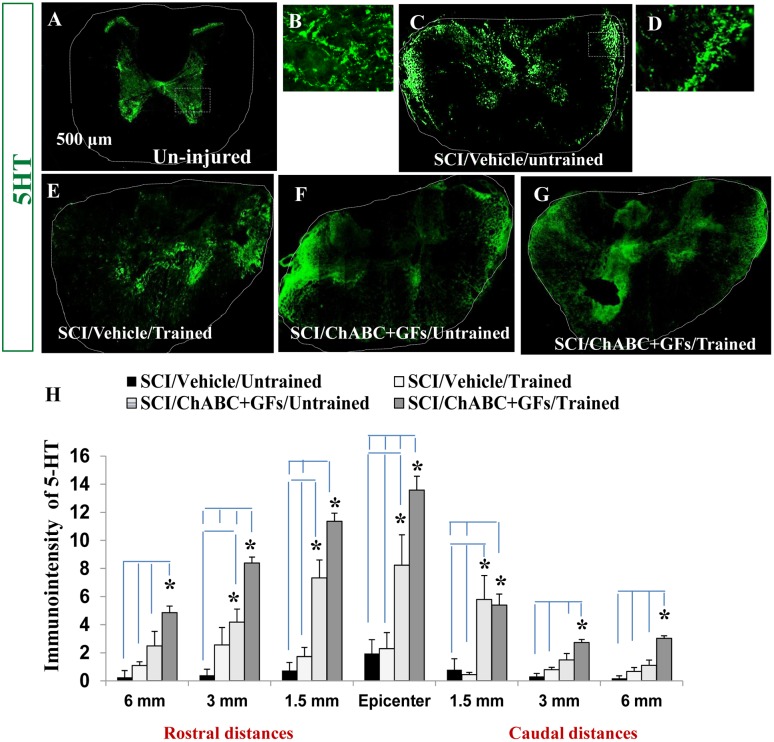
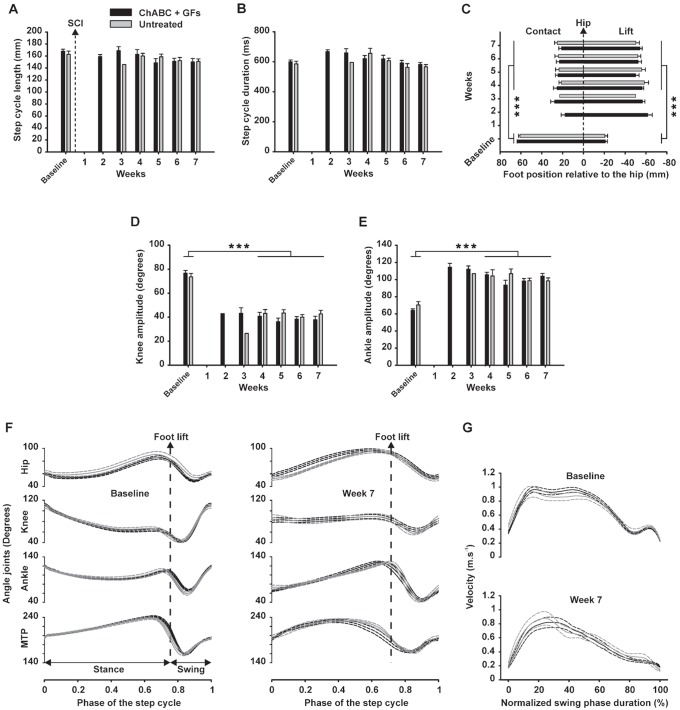
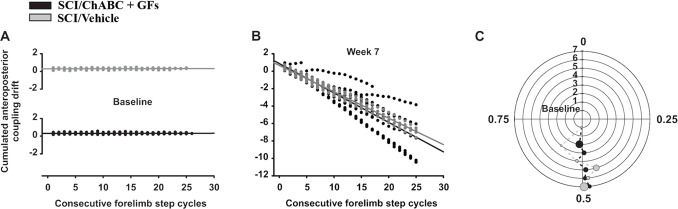
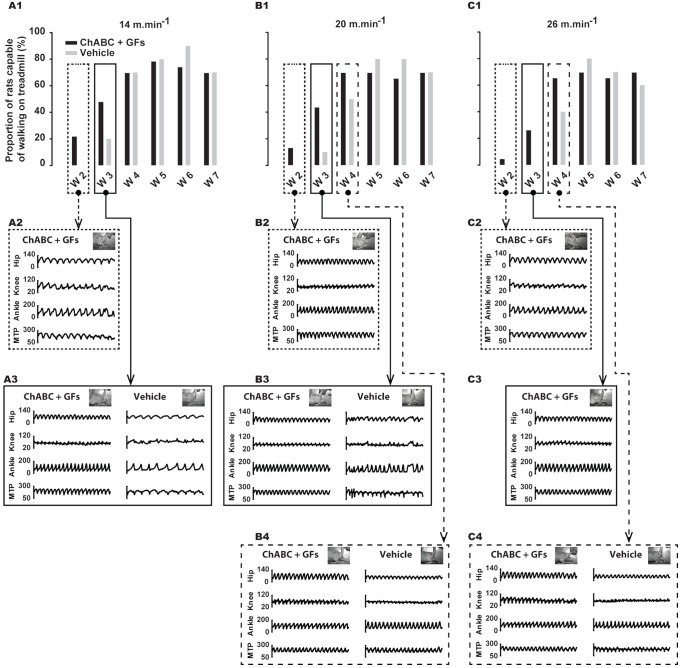
While several cellular and pharmacological treatments have been evaluated following spinal cord injury (SCI) in animal models, it is increasingly recognized that approaches to address the glial scar, including the use of chondroitinase ABC (ChABC), can facilitate neuroanatomical plasticity. Moreover, increasing evidence suggests that combinatorial strategies are key to unlocking the plasticity that is enabled by ChABC. Given this, we evaluated the anatomical and functional consequences of ChABC in a combinatorial approach that also included growth factor (EGF, FGF2 and PDGF-AA) treatments and daily treadmill training on the recovery of hindlimb locomotion in rats with mid thoracic clip compression SCI. Using quantitative neuroanatomical and kinematic assessments, we demonstrate that the combined therapy significantly enhanced the neuroanatomical plasticity of major descending spinal tracts such as corticospinal and serotonergic-spinal pathways. Additionally, the pharmacological treatment attenuated chronic astrogliosis and inflammation at and adjacent to the lesion with the modest synergistic effects of treadmill training. We also observed a trend for earlier recovery of locomotion accompanied by an improvement of the overall angular excursions in rats treated with ChABC and growth factors in the first 4 weeks after SCI. At the end of the 7-week recovery period, rats from all groups exhibited an impressive spontaneous recovery of the kinematic parameters during locomotion on treadmill. However, although the combinatorial treatment led to clear chronic neuroanatomical plasticity, these structural changes did not translate to an additional long-term improvement of locomotor parameters studied including hindlimb-forelimb coupling. These findings demonstrate the beneficial effects of combined ChABC, growth factors and locomotor training on the plasticity of the injured spinal cord and the potential to induce earlier neurobehavioral recovery. However, additional approaches such as stem cell therapies or a more adapted treadmill training protocol may be required to optimize this repair strategy in order to induce sustained functional locomotor improvement.


Conflict of interest statement

Competing Interests: The authors have declared that no competing interests exist.

Figures

Figure 1
Figure 1. Morphometric analysis of the spinal cord lesion.
(A) LFB/HE staining of cross sections of the injured spinal cord at various distances to the injury epicentre (both rostrally and caudally) is depicted for all experimental groups at seven weeks post-injury. The area of spared spinal cord tissue was traced and measured. (B) The percentage of spared tissue was calculated by normalizing the area of spared tissue to the total cross sectional area of the spinal cord. Although our quantitative analysis showed a positive trend in increasing tissue preservation in groups that received ChABC+GFs/Trained and ChABC+GFs/Untrained compared to Vehicle/Untrained counterpart in 1 mm rostral area, the difference was not statistically significant (Fig. 1B, Two-Way ANOVA, N = 3–6/group).
Figure 2
Figure 2. Effects of ChABC, GF and daily exercise on chronic astrogliosis after SCI.
(A–P) Images show cross sections of the injured spinal cord immunostained for GFAP to mark astrocytes. Representative images from vehicle/untrained, vehicle/trained, ChABC+GFs/untrained and ChABC+GFs/trained injured rats are depicted at various rostral and caudal distances to the lesion epicenter. Confocal images show an overall reduction in the expression of GFAP particularly in the surrounding parenchymal region in ChABC+GFs/untrained and ChABC+GFs/trained groups relative to both Vehicle/Untrained and Vehicle/Trained groups. Images in D, H, L, and P depict magnified areas inside the boxed regions identified in B, F, J and N, respectively. (Q) Our quantitative analysis of GFAP immunointensity confirmed a significant reduction in astrogliosis in the ChABC+GFs/trained group at the SCI epicenter as well as 1 mm rostral and caudal in comparison to the Vehicle treated groups. ChABC+GFs/untrained group also demonstrated a significant decrease in GFAP immunoreactivity at the epicenter compared to both vehicle treated groups (Two-way ANOVA, *p<0.05, n = 3–6/group). Although ChABC+GFs/trained group consistently showed less astrogliosis compared to the ChABC+GFs/untrained counterpart, our statistical analysis showed no significant differences between the two groups.
Figure 3
Figure 3. Effects of ChABC, GF and daily exercise on chronic presence of macrophages/microglia at the site of SCI lesion.
(A–P) Confocal images showing the cross sections of the injured spinal cord immunostained for CD11b (OX42). Representative images from vehicle/untrained, vehicle/trained, ChABC+GFs/untrained and ChABC+GFs/trained injured rats are depicted at various rostral and caudal distances to the lesion epicenter. CD11b marks macrophages and microglia populations. Images in D, H, L, and P depict magnified areas inside the boxed regions identified in B, F, J and N, respectively. (Q) Our quantitative analysis of CD11b immunointensity showed reduced recruitment of macrophages/microglia in ChABC+GFs/trained group compared to the Vehicle/Untrained group at all distances and compared to the Vehicle/Trained group at the epicenter. Interestingly, ChABC+GFs/Untrained group also showed a significant reduction in CD11b immunoreactivity compared to the Vehicle/Untrained group at the injury epicenter (*p<0.05, Two way ANOVA, Holm-Sidak post hoc, N = 3–6/group).
Figure 4
Figure 4. Synergistic effects of ChABC, GF and daily exercise enhance the collateral sprouting of the CST axons in the injured spinal cord.
(A–L) Images of the BDA-labeled CST at 5, 9 and 11 mm rostral to the lesion are depicted in different experimental groups after unilateral injections of BDA into the sensorimotor cortex (Ai-Li). Inverted images were generated from the boxed region depicted in A–L for better visualization. BDA labeling was unilateral, so only contralateral CST is labeled. To correct for inter-animal variations in the BDA labeling efficiency, the intensity value of the BDA labeled collaterals in the gray matter were normalized to the intensity of BDA labeled fibers of the main CST. (M) Quantification of the areas depicted in Ai-Li at various distances revealed an increase in BDA density in the combined ChABC+GFs/trained treatment group compared to all other groups at 5 and 9 mm distances. Comparison of BDA-labeled collaterals among different injured groups also showed an increase in the density of BDA-labeled CST fibers in the ChABC+GFs/untrained group that was significantly higher than both vehicle treated groups at 5 mm rostral point to the SCI epicenter (*p<0.05, Two-way ANOVA, Holm-Sidak post hoc, N = 3–5).
Figure 5
Figure 5. Combination of ChABC, GFs and training promotes plasticity of serotonergic fibers after SCI.
(A) Transverse section of an uninjured spinal cord at mid-thoracic region demonstrates normal innervation pattern of serotonergic pathway (5-HT positive fibers) within the spinal cord. (B) Higher magnification of the boxed area in A shows the presence of serotonergic fibers in the gray matter areas representing of the signal that was quantified in our assessments. (C–G) At 7 weeks post-injury, 5-HT positive fibers in all experimental groups show significant changes in their localization (images shown for 1.5 mm rostral). In contrast to uninjured spinal cord, 5-HT immunoreactive fibers were sprouting in different regions of white matter in all injured groups. (D) Higher magnification of the boxed area in C shows the presence of serotonergic fibers in the white matter areas representing of the signal that was quantified in our assessments (H) Quantification of 5-HT immunointensity in the entire cross section of the spinal cord (traced areas in images) at various rostral and caudal distances revealed significantly increased level of 5-HT immunoreactivity in ChABC+GFs/trained group compared to both vehicle treated group at all examined rostral and caudal distances (*p<0.05, Two-way ANOVA, Holm-Sidak post hoc, n = 3–6). Interestingly, at the epicenter and 1.5 mm rostral and caudal distances, the ChABC+GFs/untrained group also showed a significantly higher expression of 5-HT-immunoreactivity compared to the vehicle treated groups (*p<0.05, Two-way ANOVA, Holm-Sidak post hoc).
Figure 6
Figure 6. Kinematic analysis of locomotor patterns during the recovery period.
Kinematic data were gathered in two groups (i.e. ChABC+GFs and vehicle groups) and averaged before (baseline) and each week for 7 weeks after SCI. Because too few animals were capable to walk on treadmill during the three first weeks after SCI, statistical analysis were performed on baseline and week 4–7 only. (A) Mean length of the full step cycle (i.e. stance + swing phases) in millimeters is presented. (B) Mean duration of the full step cycle in milliseconds are shown. (C) Position of the foot contact (i.e. left part of the chart) and lift (i.e. right part) in millimeters relative to the vertical projection of the great trochanter are depicted (i.e. named hip in the chart and represented by the zero value). (D) Averaged amplitude of the knee joint in degrees and (E) averaged amplitude of ankle joint are presented. (F) Averaged angle excursions of the hip, knee, ankle and MTP, before (left panel) and 7 weeks after SCI (right panel) are shown. (G) Comparison of the averaged instant foot velocity (i.e. full lines) during swing phase before (top panel) and 7 weeks after SCI (bottom panel) for both groups, their respective SEM envelopes (i.e. dash line) are given. Symbol *** represent a significance threshold ≤0.001.
Figure 7
Figure 7. Limb coordination during locomotion.
In A and B, coordination values plotted for each consecutive forelimb step cycle before and 7 weeks after SCI respectively. Usually the coordination measurement is expressed using polar coordinates. To simplify the representation of the coordination drift we converted these data to fit the Cartesian model by subtracting 1 to the polar values when two contacts of the forelimb with the treadmill belt occurred during one hindlimb step cycle (i.e. different stepping frequencies). This method renders an account of the intensity of the drift represented by the slope of the consecutive plots. (C) Hindlimbs coordination is expressed between 0 and 1 (i.e. theta) in a polar plot. The polar axis represents the delays from baseline (i.e. the innermost circle) to week 7 (i.e. the outermost) post-SCI. Circumference of the circles represent the normalized duration of right step cycle while the dots position on each circle represent the relative time position of the left foot contact averaged by group (see Alluin et al., 2011 for details). In addition, the size of each dot is proportional to the polar dispersion.
Figure 8
Figure 8. Frequency of rats that have recovered locomotion on treadmill at the three studied velocities and at the different time points throughout the recovery period.
(A1, B1 and C1), percent of rats capable of walking on treadmill at 14, 20 and 26 m.min−1 respectively, before and each week of the recovery period for ChABC+GFs and Vehicle groups. (A2 and A3), raw angular excursions of hip, knee, ankle and MTP joints extracted from representative rats walking at 14 m.min−1 at week 2 and 3 respectively. (B2, B3 and B4), raw angular excursions of hip, knee, ankle and MTP joints extracted from representative rats walking at 20 m.min−1 at week 2, 3 and 4 respectively. (C2, C3 and C4), similar to B2, B3 and B4 for 26 m.min−1. Data in A1, B1 and C1 are expressed in percentage of the group while the other panels below show angular data expressed in degrees.
Figure 9
Figure 9. Relationships between behavior and neuroanatomical parameters.
Given the absence of significant difference between groups for the behavioral features, available data from all rats were plotted together regardless of the groups. Given that the tissue preparation was different from one labelling protocol to the other, some animals were blindly selected in each group for each different procedure. In addition, among these selected animals not all have recovered the locomotion 7 weeks after SCI (as shown in Fig. 9 A1, B1 and C1). Taken together, this double restriction explains the limited number of plotted data in the present figure. (A) Global expression of BDA labeling from the spinal cord section studied was plotted against the coefficient of variation (CV) of the foot position at the onset of the swing phase. (B) Graph depicts overall BDA expression against the CV of stance phase length. (C) Overall BDA expression against the CV of swing phase length is shown. (D) Overall BDA expression against the CV of the step cycle length is depicted. (E) Graph shows overall 5-HT expression plotted against the CV of E1 subphase (i.e. 2nd part of the swing phase: extension of the hindlimb before foot contact) velocity. (F) Overall Ox42 expression is shown against averaged velocity of the F subphase (i.e. 1st part of the swing phase: initial flexion of the hindlimb following the foot lift). BDA and 5-HT quantifications are expressed in arbitrary unit (AU), CV is expressed in percentage of the mean and Ox42 labeling is expressed in percentage of the total spinal cord (SC) area. The coefficient of determination (R2) and statistical significance (p) are given on each panel.

References

    1. Sekhon LH, Fehlings MG (2001) Epidemiology, demographics, and pathophysiology of acute spinal cord injury. Spine 26: S2–12. - PubMed
    1. Tator CH (1998) Biology of Neurological Recovery and Functional Restoration after Spinal Cord Injury. Neurosurgery 42: 696–708. - PubMed
    1. van Hedel HJ, Dietz V (2010) Rehabilitation of locomotion after spinal cord injury. Restor Neurol Neurosci 28: 123–134. - PubMed
    1. Wilson JR, Grossman RG, Frankowski RF, Kiss A, Davis AM, et al. (2012) A clinical prediction model for long-term functional outcome after traumatic spinal cord injury based on acute clinical and imaging factors. J Neurotrauma 29: 2263–2271. - PMC - PubMed
    1. Fawcett JW, Curt A, Steeves JD, Coleman WP, Tuszynski MH, et al. (2007) Guidelines for the conduct of clinical trials for spinal cord injury as developed by the ICCP panel: spontaneous recovery after spinal cord injury and statistical power needed for therapeutic clinical trials. Spinal Cord 45: 190–205. - PubMed

Publication types

MeSH terms

Substances