. 2014 Oct 29:5:5202.
doi: 10.1038/ncomms6202.

Hypoxia-mediated downregulation of miRNA biogenesis promotes tumour progression

Affiliations

Hypoxia-mediated downregulation of miRNA biogenesis promotes tumour progression

Rajesha Rupaimoole et al. Nat Commun. .

Erratum in

  • Author Correction: Hypoxia-mediated downregulation of miRNA biogenesis promotes tumour progression.
    Rupaimoole R, Wu SY, Pradeep S, Ivan C, Pecot CV, Gharpure KM, Nagaraja AS, Armaiz-Pena GN, McGuire M, Zand B, Dalton HJ, Filant J, Miller JB, Lu C, Sadaoui NC, Mangala LS, Taylor M, van den Beucken T, Koch E, Rodriguez-Aguayo C, Huang L, Bar-Eli M, Wouters BG, Radovich M, Ivan M, Calin GA, Zhang W, Lopez-Berestein G, Sood AK. Rupaimoole R, et al. Nat Commun. 2020 Jun 3;11(1):2867. doi: 10.1038/s41467-020-16661-3. Nat Commun. 2020. PMID: 32493919 Free PMC article.

Abstract

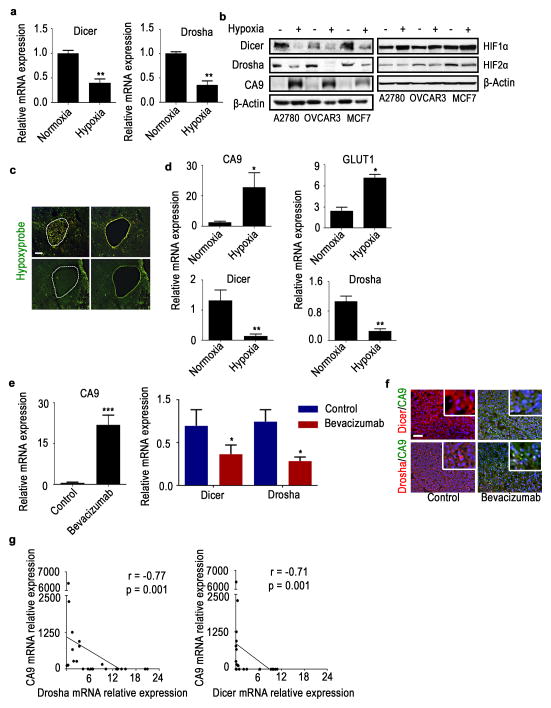
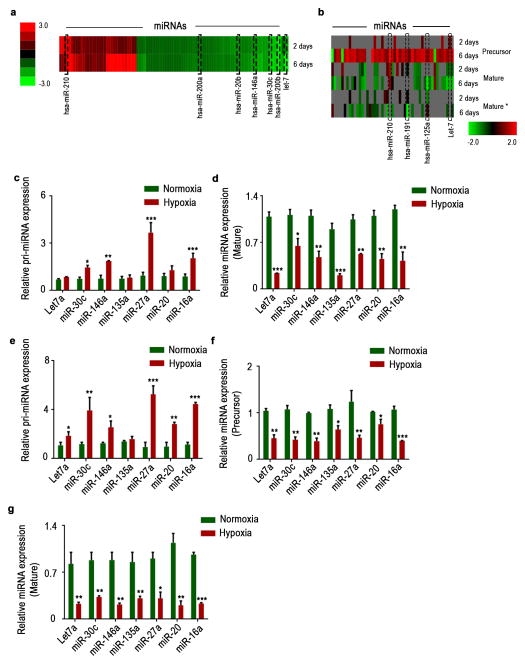
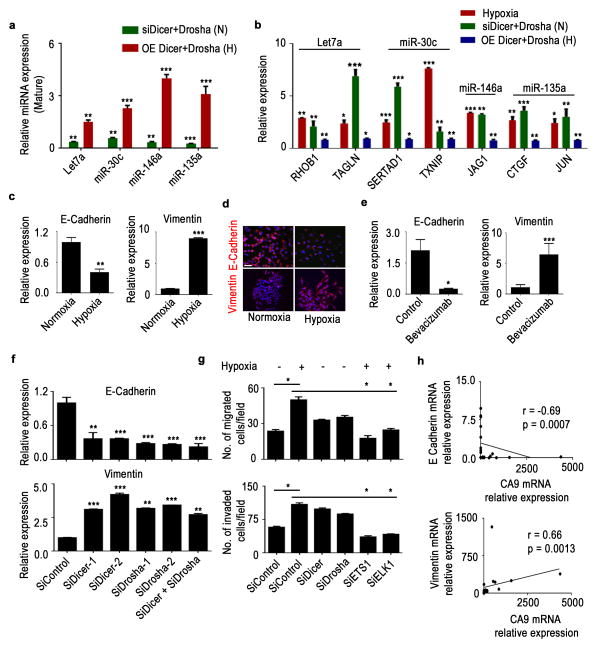
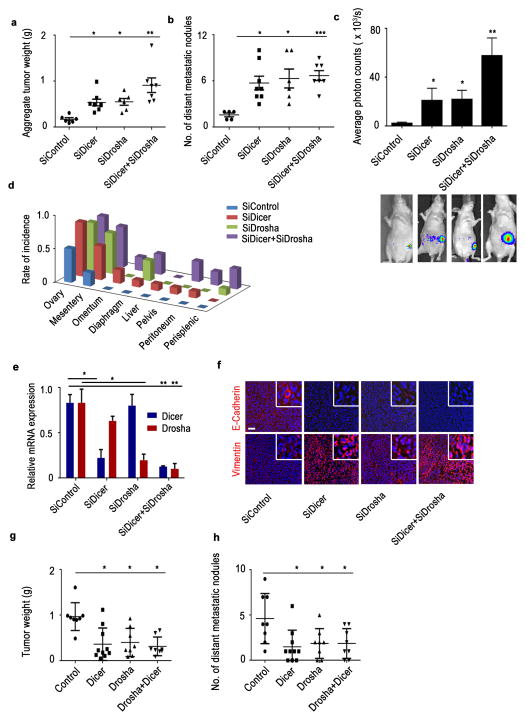
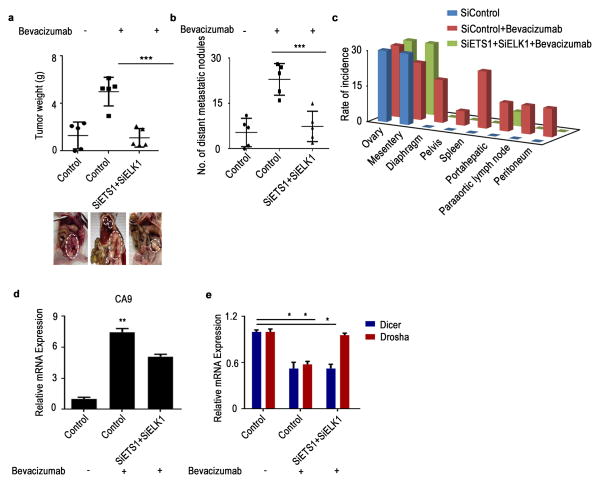
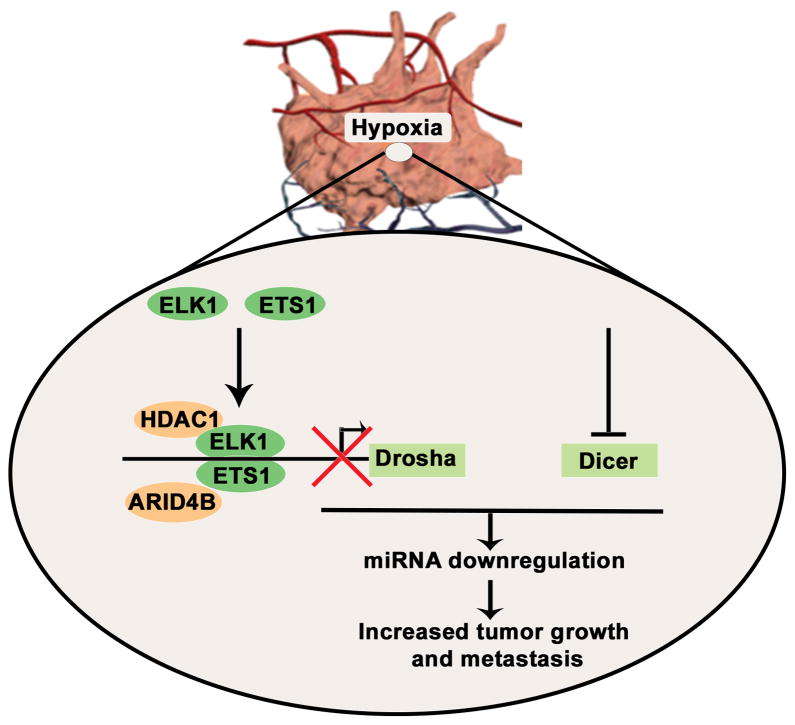
Cancer-related deregulation of miRNA biogenesis has been suggested, but the underlying mechanisms remain elusive. Here we report a previously unrecognized effect of hypoxia in the downregulation of Drosha and Dicer in cancer cells that leads to dysregulation of miRNA biogenesis and increased tumour progression. We show that hypoxia-mediated downregulation of Drosha is dependent on ETS1/ELK1 transcription factors. Moreover, mature miRNA array and deep sequencing studies reveal altered miRNA maturation in cells under hypoxic conditions. At a functional level, this phenomenon results in increased cancer progression in vitro and in vivo, and data from patient samples are suggestive of miRNA biogenesis downregulation in hypoxic tumours. Rescue of Drosha by siRNAs targeting ETS1/ELK1 in vivo results in significant tumour regression. These findings provide a new link in the mechanistic understanding of global miRNA downregulation in the tumour microenvironment.


Conflict of interest statement

Competing financial interests: The authors declare no competing financial interests.

Figures

Figure 1
Figure 1. Hypoxia downregulates Drosha and Dicer in vitro and in vivo
(a) Drosha and Dicer mRNA expression levels under hypoxic conditions (1% oxygen, 48 hr) in A2780 cells. (b) Protein expression of Dicer, Drosha, hypoxia marker carbonic an hydrase 9 (CA9), HIF1α, HIF2α under hypoxic conditions in A2780, OVCAR3, and MCF7 cells. (c) Laser microdissection of hypoxic areas of tumors, guided by Hypoxyprobe staining (green). Scale bar: 500 μm. (d) mRNA expression levels of hypoxia markers CA9 and GLUT1, as well as Dicer and Drosha expression levels, in normoxic and hypoxic regions of tumors isolated using microdissection. (e)mRNA expression levels of CA9, Drosha, and Dicer in A2780 mouse tumors treated with bevacizumab. (f) Protein expression levels of Dicer (red), Drosha (red), and CA9 (green) in A2780 mouse tumor samples treated with bevacizumab compared with untreated controls. Nucleus indicated as Blue. Scale bar: 200 μm. (g) Pearson correlation between Dicer and Drosha mRNA expression levels and hypoxia marker CA9 levels (n=30). All images shown are representative and data are presented as mean ± standard error of the mean of n ≥ 3 experimental groups. *p < 0.05, **p < 0.01, ***p < 0.001 (Student t test).
Figure 2
Figure 2. Hypoxia mediated downregulation in Drosha and Dicer results in decreased miRNA levels
(a), Heat map showing mature microRNA (miRNA) levels under hypoxic conditions, assessed using miRNA array data. (b) Heat map showing precursor miRNA levels under hypoxic conditions, along with the corresponding mature sense (mature) and antisense (mature*) levels. (cd)Pri-miRNA and mature miRNA expression levels of significantly altered miRNAs under hypoxia exposure in A2780 cells. (e)Pri-miRNA levels in RNA extracted from nuclear fractionated A2780 cells treated with normoxia and hypoxia. (fg) Precursor and mature miRNA levels in RNA extracted from cytoplasmic fraction of A2780 cells treated with normoxia and hypoxia. Data are presented as mean ± standard error of the mean of n ≥ 3 experimental groups. *p < 0.05, **p < 0.01, ***p < 0.001 (Student t test).
Figure 3
Figure 3. Drosha is downregulated by the ETS1/ELK1 complex under hypoxic conditions
(a) Relative luciferase reporter activity for the Drosha promoter region under hypoxic conditions. β-actin was used as a control. (b) Protein expression of ETS1 and ELK1 under hypoxic conditions in various cell lines. (c) Luciferase reporter activity for the wild-type (WT) Drosha promoter region and the ETS1 or ELK1 binding site–mutant Drosha promoter region under hypoxic conditions. (d) Drosha mRNA expression levels after ETS1, ElK1, and ETS/ELK1 siRNA gene knockdown under hypoxic conditions. (e) Anti-ETS1, anti-ELK1, anti-POL II chromatin immunoprecipitation assay results showing fold enrichment of ETS1, ELK1, POL II binding to the Drosha promoter region in A2780 cells. Rabbit IgG was used as a control and real-time polymerase chain reaction (PCR) was used to quantitate the fold enrichment. (f) Effect of hypoxia on Drosha promoter methylation assessed by bisulfite conversion and methylation-specific PCR. The threshold cycle numbers obtained from samples with specific primers for unmethylated (UM) and methylated (M) sequences of the same promoter region of Drosha are shown. (g)mRNA and protein expression of Drosha in mouse tumor samples treated with B-20 (anti-VEGF antibody) and azacitidine. Scale bar: 200 μm. (h)Immunoprecipitation of hypoxia samples against ETS1 and ELK1 antibodies, probed for corresponding binding proteins ARID4B (ETS1) and HDAC1 (ELK1). (i) Anti-ARID4B and anti-HDAC1 chromatin immunoprecipitation assay results showing fold enrichment of ARID4B and HDAC1 binding to the Drosha promoter region in A2780 cells.(j) Aggregate tumor mass from tumors in the mouse orthotopic ovarian cancer model treated with control, ETS1, ELK1, and combination siRNAs. (k) Average mRNA expression of Drosha, ETS1, and ELK1 in the same tumor samples. All images shown are representative and data are presented as mean ± standard error of the mean of n ≥ 3 experimental groups. **p < 0.01, ***p < 0.001 (Student t test).
Figure 4
Figure 4. Drosha and Dicer downregulation under hypoxia leads to increased epithelial-to-mesenchymal transition
Expression of significantly altered pro-miRNAs (a) and metastatic genes (b) in Dicer and Drosha knocked down A2780 cells under normoxia (data shown normalized to siControl) or ectopic expression of Dicer and Drosha under hypoxia (data shown normalized to control), N - normoxia and H - hypoxia. E-cadherin and vimentin mRNA (c) and protein (d) expression levels under hypoxic exposure in A2780 cells. Blue - Nucleus, Scale bar: 200 μm. (e) mRNA levels of E-cadherin and vimentin in A2780 mouse tumor samples treated with bevacizumab. (f) E-cadherin (top) and vimentin (bottom) expression after knockdown of Dicer, Drosha, or both using siRNAs in A2780 cells. (g) Effect of Drosha and Dicer on cell migration and invasion in A2780 cells. Drosha and Dicer levels were downregulated using siRNAs under normoxic conditions. Rescue of Drosha was achieved using siRNAs against ETS1 and ELK1 under hypoxic conditions. (h) Pearson correlation between E-cadherin or vimentin and hypoxia marker carbonic an hydrase 9 (CA9) expression in clinical ovarian tumor samples (n=30). All images shown are representative and data are presented as mean ± standard error of the mean of n ≥ 3 experimental groups. *p < 0.05, **p < 0.01, ***p < 0.001 (Student t test).
Figure 5
Figure 5. Drosha and Dicer downregulation results in increased cancer progression in vivo
Aggregate tumor weight (a) and number of distant metastatic nodules (b) in mice treated with siRNA against Dicer, Drosha, or both compared with the control siRNA group (n = 10 per group). (c) Average photon counts from each group of mice treated with siRNA against Dicer, Drosha, or both compared to controls. Representative bioluminescence images are shown below the respective groups. (d) Distant metastatic nodule incidence rate in an orthotopic mouse model of ovarian cancer (left). (e)Drosha and Dicer mRNA expression in mouse tumor samples treated with siRNA against Dicer or Drosha. (f) Expression of epithelial-to-mesenchymal transition markers (E-cadherin-Red, vimentin-Red, Nucleus-Blue) in tumor samples from the in vivo experiment groups. Scale bar: 200 μm. Aggregate tumor weight (g) and number of distant metastatic nodules (h) in mice implanted with HeyA8 cells ectopically expressing Dicer, Drosha and Dicer+Drosha. *p < 0.05, **p < 0.01, ***p < 0.001 (Student t test).
Figure 6
Figure 6. Rescue of Drosha under anti-VEGF therapy results in decreased tumor progression in vivo
(ab)Effect of rescue of Drosha after anti–vascular endothelial growth factor (VEGF) therapy in A2780 model. Aggregate tumor weight is shown (a) and number of distant metastatic nodules (b) in mice treated with bevacizumab and mice treated with siRNAs against ETS+ELK1. Also shown are representative pictures of tumor burden (a, bottom) in all treatment groups (n = 5 per group). (c) Distribution of metastatic nodules in individual mice groups treated with siDicer, siDrosha and siDicer+siDrosha. Hypoxia marker CA9 (d) and Dicer and Drosha (e) mRNA expression levels in the tumor samples from the mouse model. All images shown are representative and data are presented as mean ± standard error of the mean of n ≥ 3 experimental groups. *p < 0.05, **p < 0.01, ***p < 0.001 (Student t test).
Figure 7
Figure 7
Schematic representation of mechanisms by which Drosha and Dicer downregulation in hypoxia results in increased cancer growth and metastasis.

Similar articles

Cited by

References

    1. Bartel DP. MicroRNAs: genomics, biogenesis, mechanism, and function. Cell. 2004;116:281–297. - PubMed
    1. Lee YS, Dutta A. MicroRNAs in cancer. Annual review of pathology. 2009;4:199–227. doi: 10.1146/annurev.pathol.4.110807.092222. - DOI - PMC - PubMed
    1. Calin GA, et al. A MicroRNA signature associated with prognosis and progression in chronic lymphocytic leukemia. The New England journal of medicine. 2005;353:1793–1801. doi: 10.1056/NEJMoa050995. - DOI - PubMed
    1. Croce CM, Calin GA. miRNAs, cancer, and stem cell division. Cell. 2005;122:6–7. doi: 10.1016/j.cell.2005.06.036. - DOI - PubMed
    1. Hwang HW, Mendell JT. MicroRNAs in cell proliferation, cell death, and tumorigenesis. British journal of cancer. 2006;94:776–780. doi: 10.1038/sj.bjc.6603023. - DOI - PMC - PubMed

Publication types

MeSH terms