. 2014 Dec;166(4):1803-20.
doi: 10.1104/pp.114.248716. Epub 2014 Oct 28.

Promoter-based integration in plant defense regulation

Affiliations

Promoter-based integration in plant defense regulation

Baohua Li et al. Plant Physiol. 2014 Dec.

Abstract

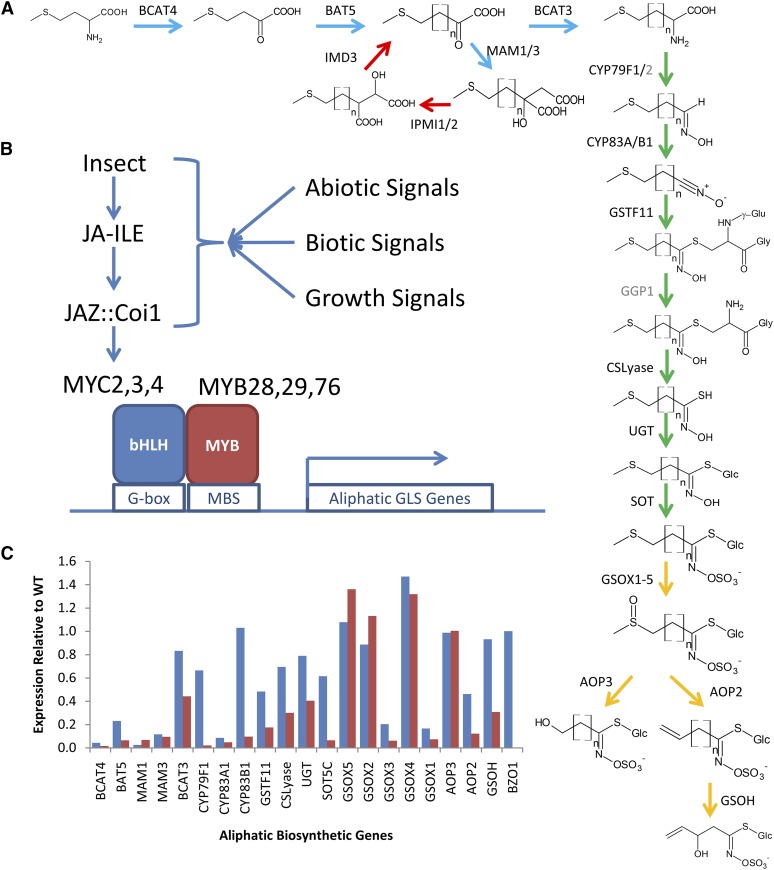
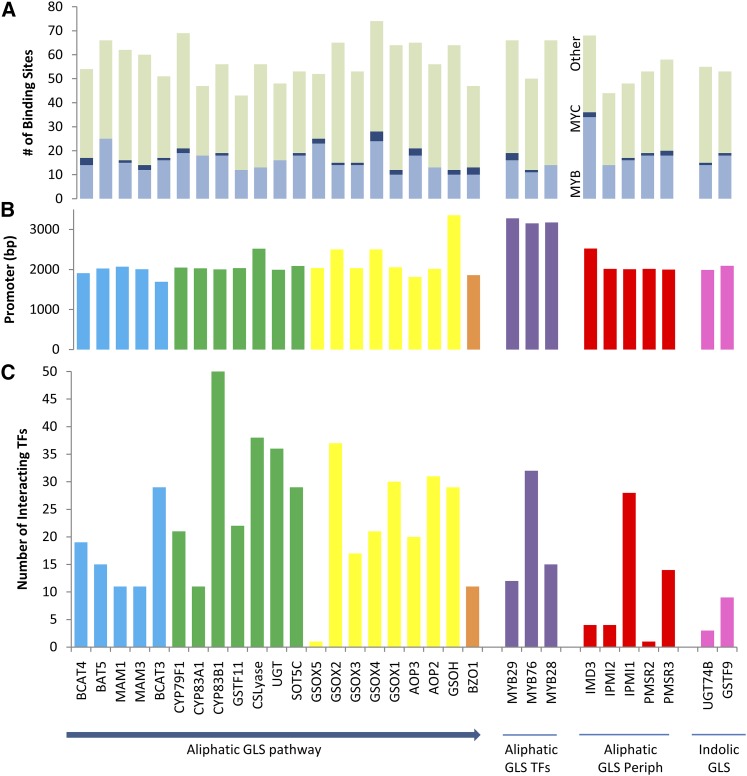
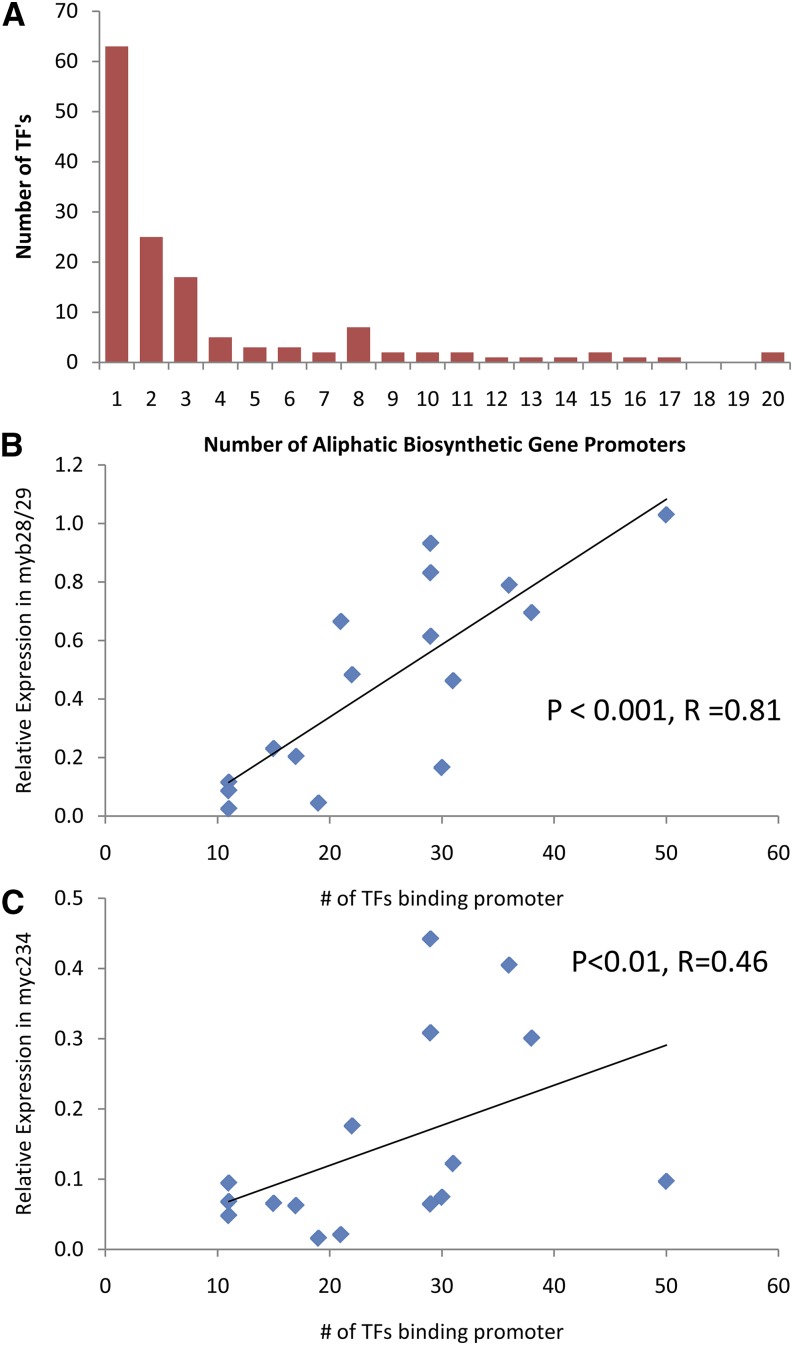
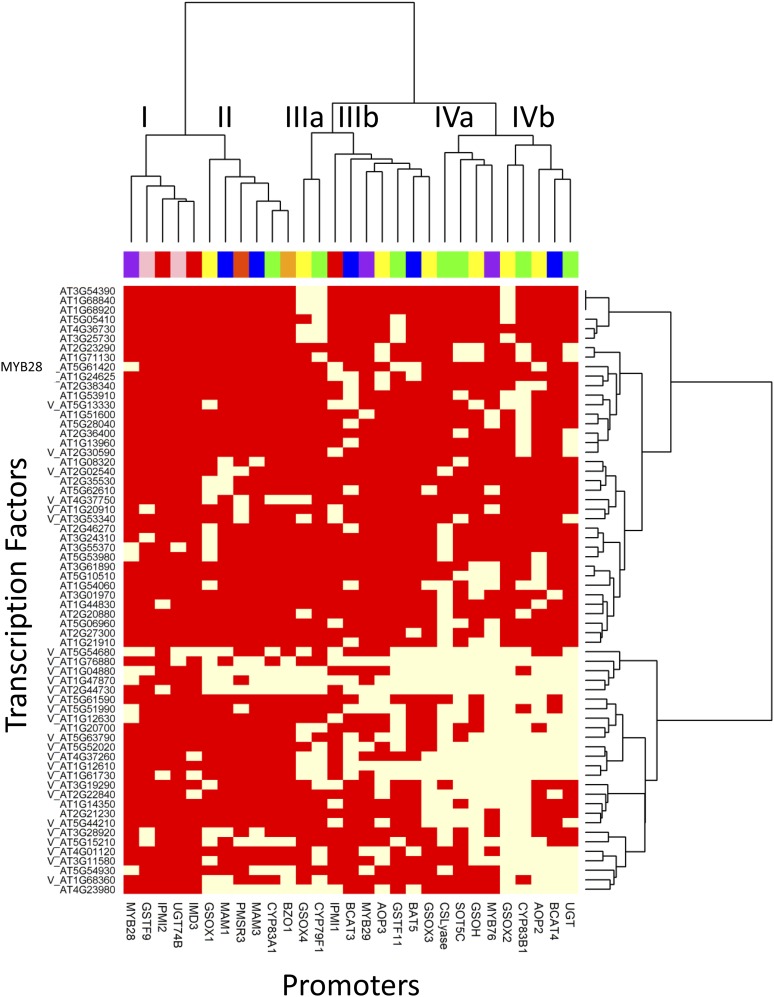
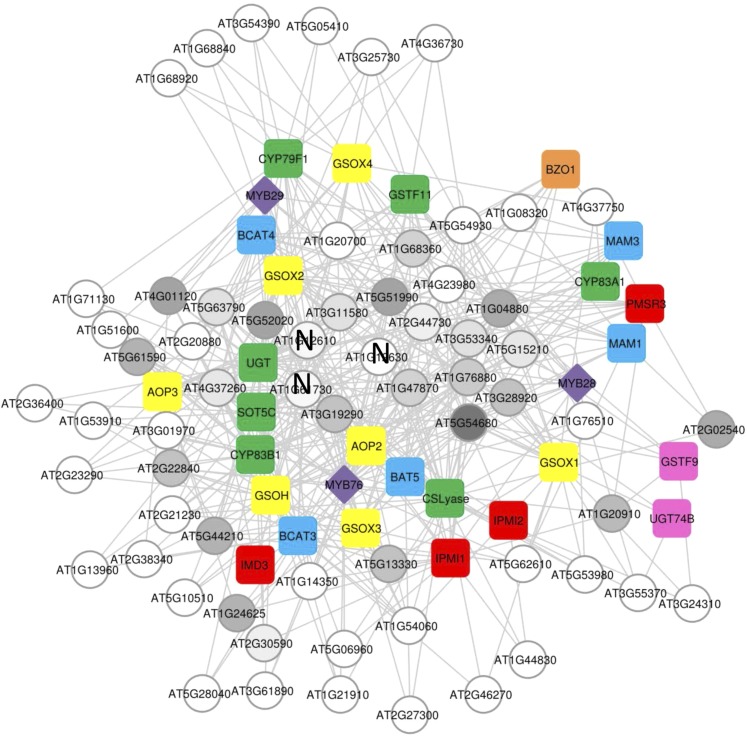
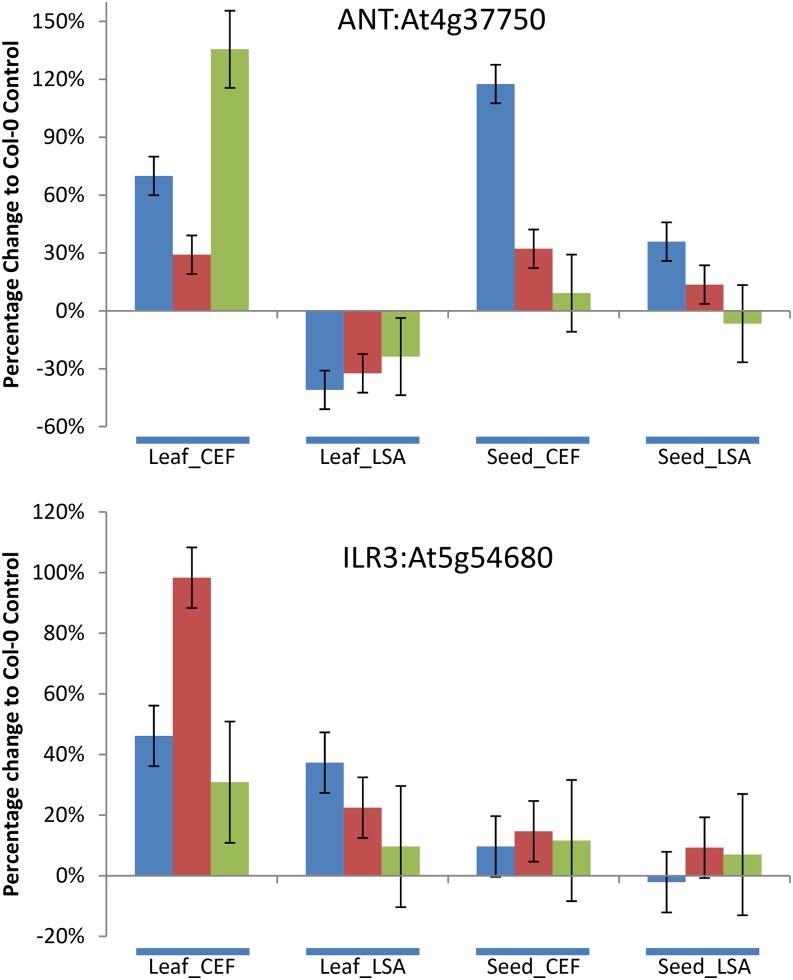
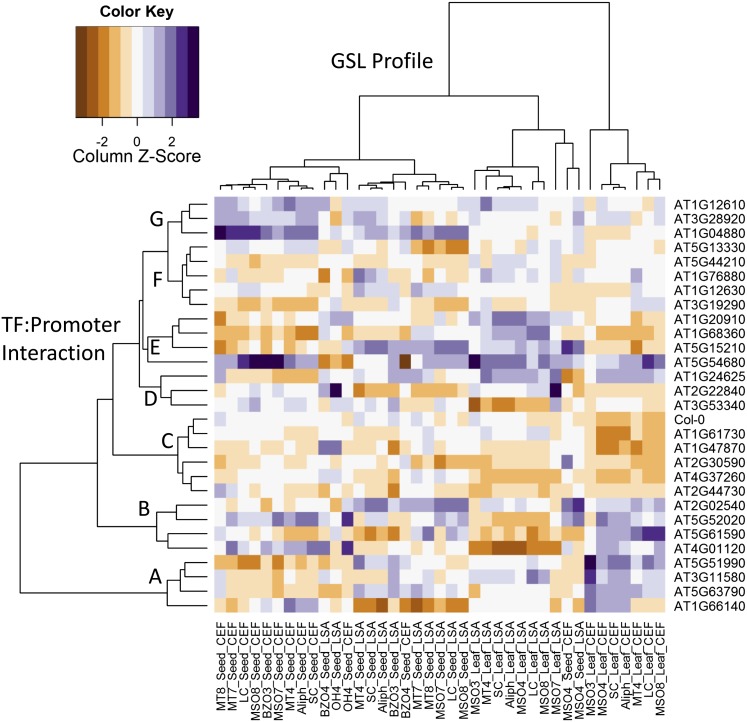
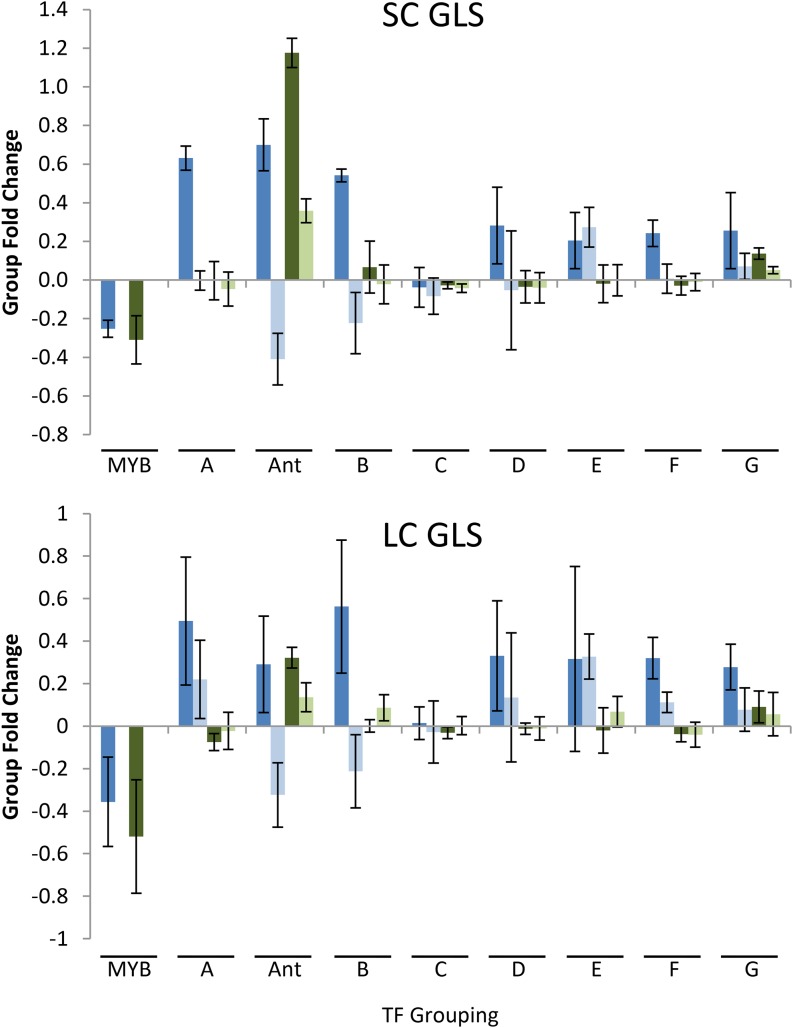
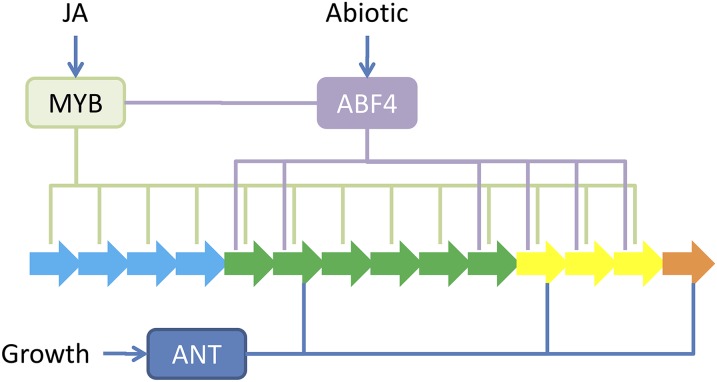
A key unanswered question in plant biology is how a plant regulates metabolism to maximize performance across an array of biotic and abiotic environmental stresses. In this study, we addressed the potential breadth of transcriptional regulation that can alter accumulation of the defensive glucosinolate metabolites in Arabidopsis (Arabidopsis thaliana). A systematic yeast one-hybrid study was used to identify hundreds of unique potential regulatory interactions with a nearly complete complement of 21 promoters for the aliphatic glucosinolate pathway. Conducting high-throughput phenotypic validation, we showed that >75% of tested transcription factor (TF) mutants significantly altered the accumulation of the defensive glucosinolates. These glucosinolate phenotypes were conditional upon the environment and tissue type, suggesting that these TFs may allow the plant to tune its defenses to the local environment. Furthermore, the pattern of TF/promoter interactions could partially explain mutant phenotypes. This work shows that defense chemistry within Arabidopsis has a highly intricate transcriptional regulatory system that may allow for the optimization of defense metabolite accumulation across a broad array of environments.


Figures

Figure 1.
Figure 1.
Proposed aliphatic GLS pathway regulatory model. A, Aliphatic GLS biosynthetic pathway with structures and enzymes. Enzymes in black are ones with promoters included in this study. Those in gray were not cloned. The use of n indicates the number of carbons introduced to the side chain from the elongation cycle and can vary from 1 to 7. The promoters are color coded based on their pathway membership as follows: indolic GLSs are pink, aliphatic regulatory genes are purple, and aliphatic peripheral genes are red. The aliphatic biosynthetic genes are parsed into the core pathway (green), elongation (blue), modifying (yellow), and seed specific (orange) to visualize regulation along the linear model of the pathway. B, A proposed model of aliphatic GLS pathway regulation. In this model, the pathway is regulated by the JA pathway via the bHLH’s MYC2/MYC3/MYC4 interacting with the MYB28/MYB29/MYB76 proteins and binding the respective promoters. C, Transcriptional analysis of the aliphatic GLS pathway in mutants missing the MYB28 and MYB29 TFs (blue) or MYC2/MYC3/MYC4 TFs (red). The value is shown as the relative value of the transcript in the mutant with the wild type set to 1 for each gene. The genes are ordered by their position in the biosynthetic pathway. The transcriptional data presented are from previous publications with full statistical analysis (Sonderby et al., 2010b; Schweizer et al., 2013). WT, Wild type JA-ILE, isoleucyl jasmonic acid; JAZ, jasmonate ZIM domain proteins; Coi1, Coronatine Insensitive1; BCAT4, BRANCHCHAIN AMINOTRANSFERASE4; BAT5, BILE ACID TRANSPORTER5; IMD3, ISOPROPYL MALATE DEHYDROGENASE3; MAM1, METHYLIOALKYLMALATE SYNTHASE1; IPMI1, ISOPROPYL MALATE ISOMERASE1; CYP, CYTOCHROME P450; GGP1, GAMMA GLUTAMYL PEPTIDASE1; GSOH, GLUCOSINOLATE HYDROXYLATION; GSOX1-5, GLUCOSINOLATE OXIDASE1-5; GSTF11, GLUTHATHIONE-S-TRANSFERASE11; CSLyase, CYSTEINE-S-CONJUGATE β-LYASE; UGT, UDP-GLYCOSYLTRANSFERASE; SOT, SULFUR TRANSFERASE; AOP3, ALKENYLHYDROXYPROPYL3; BZO1, BENZOYLOXY1.
Figure 2.
Figure 2.
Y1H identified TF interactions for the biosynthetic pathway promoters. The aliphatic GLS genes are ordered according to the biosynthetic pathway. The promoters are color coded based on their pathway membership as follows: indolic GLSs are pink, aliphatic regulatory genes are purple, and aliphatic peripheral genes are red. The aliphatic biosynthetic genes are parsed into the core pathway (green), elongation (blue), modifying (yellow), and seed specific (orange) to visualize regulation along the linear model of the pathway. A, The number of MYB, MYC, and other TF binding sites per promoter as called by Athena are presented. B, The size of the promoter for each gene that was cloned for Y1H is shown. C, Based on the Y1H analysis, the numbers of TFs found to interact with each promoter are plotted for the different classes of promoters. PMSR3, PROTEIN METHIONINE SULFOXIDE REDUCTASE3.
Figure 3.
Figure 3.
Relationship between the number of TFs binding a promoter and gene expression. A, Histogram of the number of TFs found to interact with different number of aliphatic biosynthetic gene promoters based on the Y1H analysis. B, Comparison of the relative expression of the aliphatic GLS genes within the myb28/myb29 knockout with the number of TFs found to interact with their promoters based on the Y1H analysis. The predicted linear trendline is shown. C, Comparison of the relative expression of the aliphatic GLS genes within the myc2/myc3/myc4 knockout with the number of TFs found to interact with their promoters based on the Y1H analysis. The predicted linear trendline is shown.
Figure 4.
Figure 4.
Coclustering of TFs and promoters via their interactions. Hierarchical clustering of promoter to TF interactions. Only promoters or TFs showing three or more interactions were included in the analysis, and the Ward algorithm was used for clustering. A V in front of the TF shows the TFs chosen to validate in mutant analysis. Within the plot, yellow shows a significant Y1H interaction between the promoter and TF, whereas red indicates no interaction. The promoters are color coded as shown in Figure 2 based on their pathway membership as follows: indolic GLSs are pink, aliphatic regulatory genes are purple, and aliphatic peripheral genes are red. The aliphatic biosynthetic genes are parsed into the core pathway (green), elongation (blue), modifying (yellow) and seed specific (orange) to visualize regulation along the linear model of the pathway. The roman numerals show potential promoter groupings.
Figure 5.
Figure 5.
Spring-embedded network linking TFs and promoters via their interactions. A network of promoter to TF interactions as generated using a spring-embedded approach is shown. This approach leads to TFs or promoters with more interactions being present in the center of the diagram and less connected ones being more distal. Only promoters or TFs showing three or more interactions were included in the analysis, and the Ward algorithm was used for clustering. TFs chosen to validate in mutant analysis are shown in dark gray, whereas the other TFs are in light gray. Purple shows TFs that are known and validated to control aliphatic GLS accumulation. Circles show genes present only as the TF, squares are genes present only as promoters, and diamonds are present as both a TF and promoter. The promoters are color coded as shown in Figure 2 based on their pathway membership as follows: indolic GLSs are pink, aliphatic regulatory genes are purple, and aliphatic peripheral genes are red. The aliphatic biosynthetic genes are parsed into the core pathway (green), elongation (blue), modifying (yellow), and seed specific (orange) to visualize regulation along the linear model of the pathway. TFs that validated by mutant analysis are shown in gray with the intensity showing the fraction of aliphatic GLS phenotypes that validated from light gray to dark gray. TFs with a black N are those that were tested but had no significant phenotypic effect on GLS accumulation.
Figure 6.
Figure 6.
Effects and networks for ANT and ILR3. The average effect of insertions in ANT and ILR3 on short-chain (blue), long-chain (red), and indolic (green) GLS accumulation in the different chambers and tissues. The 95% confidence limits are presented. If the bars do not cross 0, then there is a statistically significant difference from ecotype Columbia-0 of Arabidopsis (Col-0) for that mutant in that tissue and condition. For ANT, Col-0 and ANT are represented by six independent samples per chamber per tissue. For ILR3, Col-0 and ILR3 are represented by 12 independent samples per chamber per tissue.
Figure 7.
Figure 7.
Clustering TFs based upon their aliphatic GLS phenotype. Hierarchical clustering of the aliphatic GLS phenotype across the TF mutants. For each TF, the fold change compared with Col-0 was utilized to standardize across experiments. The fold changes were then Z-scaled within a phenotype to balance the clustering and the Ward algorithm used for clustering. The color key in the top left shows the effect scale of the mutants upon the aliphatic GLS phenotypes in a Z-scale. Col-0 was included in the analysis with a value of 0-fold change for each phenotype for comparison purposes. For this analysis, only phenotypes describing the accumulation of aliphatic GLS were utilized. The letters on the left show the described clustering of TFs. ANT was not included in the analysis because of its strong single gene effects that biased the clustering. The dendrograms are labeled based on what is being clustered.
Figure 8.
Figure 8.
Average GLS change in TF groups. The average change in short-chain and long-chain aliphatic GLSs of the TF groups A to G as defined by the phenotypic clustering are shown with 95% confidence intervals for the group change. The corresponding changes in ANT are also shown. For comparison, the average changes in the leaf and seed phenotypes in single insertion mutants in MYB28, MYB29, and MYB76 are shown. For the MYBs, the se of the phenotype across published results in these same chambers is shown. Blue bars are values from leaves, with dark blue showing the CEF chamber and light blue showing the LSA chamber. Green bars are from seeds, with dark green showing the CEF chamber, and light green is from seeds in the LSA chamber. To estimate the average group changes for the TF clusters shown in Figure 7, we took the average change of each TF mutant in relation to wild-type Col-0. We then grouped the TFs into the appropriate groups based on Figure 7. We then estimated the average percent change and 95% confidence interval for each group of TFs. This was done for the total level of short-chain and long-chain aliphatic GLS. LC, Long chain; SC, short chain.
Figure 9.
Figure 9.
Multiple sites of integration and noncoordinate pathway regulation. Shown is a simplified model containing the interactions of the known MYBs to the aliphatic GLS pathway genes (blue arrows) using green lines. Putative inputs of abiotic and growth signals via predicted ANT and ABF4 interactions are shown in blue and purple lines, respectively. Potential connections to the MYB promoters are also shown. JA, Jasmonic acid.

References

    1. Alon U. (2006) An Introduction to Systems Biology: Design Principles of Biological Circuits, CRC Press, Taylor & Francis Group, Boca Raton, FL
    1. Alonso JM, Stepanova AN, Leisse TJ, Kim CJ, Chen HM, Shinn P, Stevenson DK, Zimmerman J, Barajas P, Cheuk R, et al (2003) Genome-wide Insertional mutagenesis of Arabidopsis thaliana. Science 301: 653–657 - PubMed
    1. Andersen TG, Nour-Eldin HH, Fuller VL, Olsen CE, Burow M, Halkier BA (2013) Integration of biosynthesis and long-distance transport establish organ-specific glucosinolate profiles in vegetative Arabidopsis. Plant Cell 25: 3133–3145 - PMC - PubMed
    1. Arda HE, Walhout AJM (2010) Gene-centered regulatory networks. Brief Funct Genomics 9: 4–12 - PMC - PubMed
    1. Asahina M, Azuma K, Pitaksaringkarn W, Yamazaki T, Mitsuda N, Ohme-Takagi M, Yamaguchi S, Kamiya Y, Okada K, Nishimura T, et al. (2011) Spatially selective hormonal control of RAP2.6L and ANAC071 transcription factors involved in tissue reunion in Arabidopsis. Proc Natl Acad Sci USA 108: 16128–16132 - PMC - PubMed

Publication types

MeSH terms