Review
. 2014 Nov;37 Suppl 1(Suppl 1):S33-45.
doi: 10.1007/s40264-014-0184-5.

Methodology to assess clinical liver safety data

Affiliations
Review

Methodology to assess clinical liver safety data

Michael Merz et al. Drug Saf. 2014 Nov.

Abstract

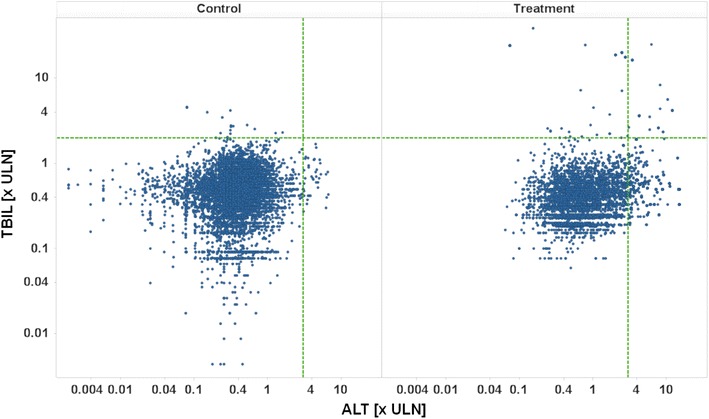
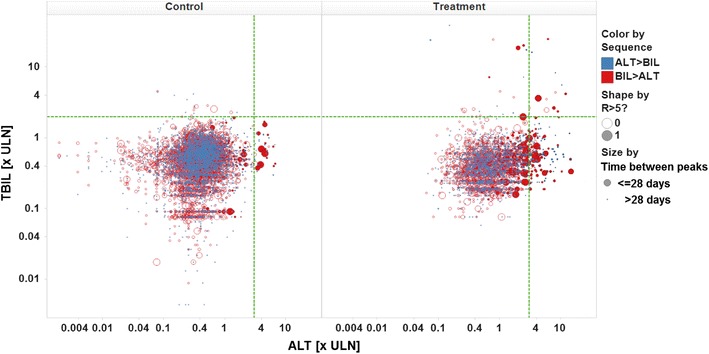
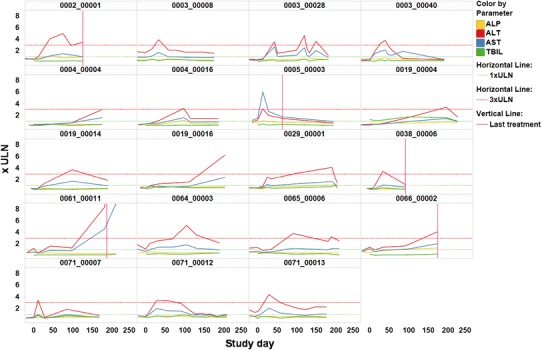
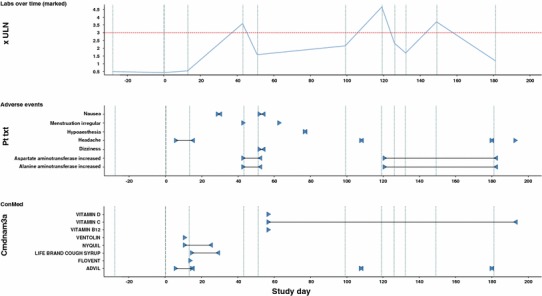
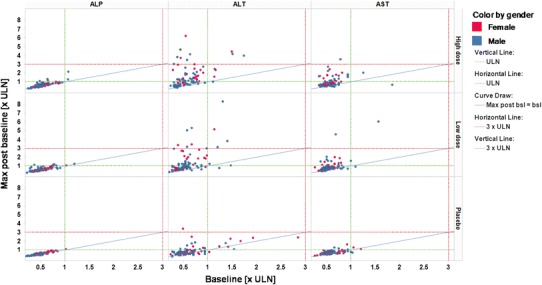
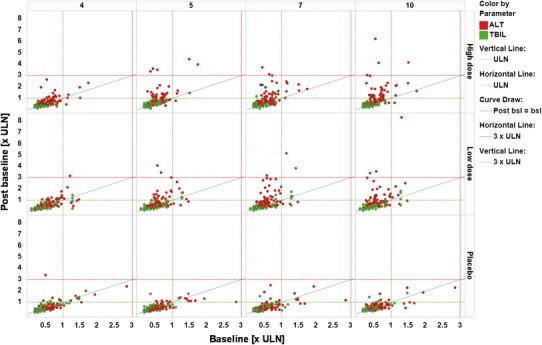
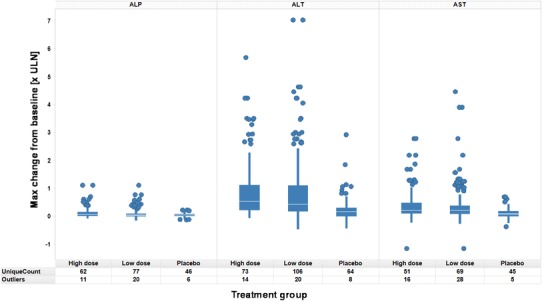
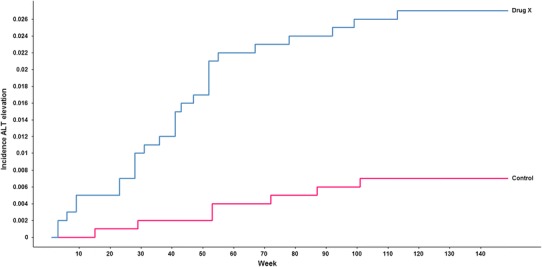
Analysis of liver safety data has to be multivariate by nature and needs to take into account time dependency of observations. Current standard tools for liver safety assessment such as summary tables, individual data listings, and narratives address these requirements to a limited extent only. Using graphics in the context of a systematic workflow including predefined graph templates is a valuable addition to standard instruments, helping to ensure completeness of evaluation, and supporting both hypothesis generation and testing. Employing graphical workflows interactively allows analysis in a team-based setting and facilitates identification of the most suitable graphics for publishing and regulatory reporting. Another important tool is statistical outlier detection, accounting for the fact that for assessment of Drug-Induced Liver Injury, identification and thorough evaluation of extreme values has much more relevance than measures of central tendency in the data. Taken together, systematical graphical data exploration and statistical outlier detection may have the potential to significantly improve assessment and interpretation of clinical liver safety data. A workshop was convened to discuss best practices for the assessment of drug-induced liver injury (DILI) in clinical trials.


Figures

Fig. 1
Fig. 1
eDISH plot, TBIL [× ULN] vs. ALT [× ULN] on a log/log scale, treatment by panel, pooled active versus control. ULN upper limit of normal, ALT alanine aminotransferase, TBIL total bilirubin
Fig. 2
Fig. 2
Modified eDISH plot, color by sequence of peak values, size by 1/time interval between peaks, shape by R flag. ULN upper limit of normal, ALT alanine aminotransferase, TBIL total bilirubin, BIL bilirubin
Fig. 3
Fig. 3
Time profiles of ALT, AST, ALP, and TBIL, panel by patients, treatment end indicated by vertical red line, ULN and 3 × ULN indicated by horizontal green and red line, respectively. Color coding by liver test. ALT alanine aminotransferase, AST aspartate aminotransferase, ALP alkaline phosphatase, TBIL total bilirubin, ULN upper limit of normal
Fig. 4
Fig. 4
Patient profile of ALT, adverse events, and concomitant medication; start and end date of adverse events and concomitant medications indicated by blue triangles. ALT alanine aminotransferase, ULN upper limit of normal, ConMed concomitant medication
Fig. 5
Fig. 5
Shifts from baseline, parameters by column, treatment groups by row, color coding by gender. ULN upper limit of normal, max maximum, max post bsl maximum post baseline
Fig. 6
Fig. 6
Shifts from baseline, visits by column, treatment by rows, color coding by parameter. ALT alanine aminotransferase, TBIL total bilirubin, ULN upper limit of normal, post bsl post baseline
Fig. 7
Fig. 7
Maximum absolute changes from baseline across treatment groups, parameters by panel, treatment groups by column per panel
Fig. 8
Fig. 8
Kaplan–Meier plot of incidence of ALT elevations over time across treatment groups. ALT alanine aminotransferase
Fig. 9
Fig. 9
a TRMOD boundary for two correlated measurements. b TRMOD boundary for ALT and bilirubin with four regions: (Region I) severe toxicity or potential Hy’s Law, (Region II) elevated bilirubin, (Region III) elevated ALT, and (Region IV) potentially toxicity. ALT alanine aminotransferase
Fig. 10
Fig. 10
a Hy’s Law and eDISH Plot on ULN corrected data: ALT >3 × ULN and total bilirubin >2 × ULN; b TRMOD boundaries and mDISH plot on ULN corrected data: ALT >3.4 × ULN and bilirubin >2.1 × ULN. ALT alanine aminotransferase, ULN upper limits of normal
Fig. 11
Fig. 11
TRMOD boundaries and mDISH plot on baseline corrected data: ALT >3.8 × baseline and bilirubin >4.8 × baseline. ALT alanine aminotransferase

References

    1. US Department of Health and Human Services FDA, Center for Drug Evaluation and Research (CDER), Center for Biologics Evaluation and Research (CBER). Guidance for industry. Drug-induced liver injury: premarketing clinical evaluation. 2009;18.
    1. Ozer J, Ratner M, Shaw M, Bailey W, Schomaker S. The current state of serum biomarkers of hepatotoxicity. Toxicology. 2008;245(3):194–205. doi: 10.1016/j.tox.2007.11.021. - DOI - PubMed
    1. Shi Q, Hong H, Senior J, Tong W. Biomarkers for drug-induced liver injury. Expert Rev Gastroenterol Hepatol. 2010;4(2):225–234. doi: 10.1586/egh.10.8. - DOI - PubMed
    1. Whitfield J. Gamma glutamyl transferase. Crit Rev Clin Lab Sci. 2001;38(4):263–355. doi: 10.1080/20014091084227. - DOI - PubMed
    1. Krause A, O’Connell M. A picture is worth a thousand tables: graphics in life sciences. New York: Springer; 2012.

MeSH terms