. 2014 Dec 26;289(52):35859-67.
doi: 10.1074/jbc.M114.613265. Epub 2014 Oct 28.

Real-time detection of hepatic gluconeogenic and glycogenolytic states using hyperpolarized [2-13C]dihydroxyacetone

Affiliations

Real-time detection of hepatic gluconeogenic and glycogenolytic states using hyperpolarized [2-13C]dihydroxyacetone

Karlos X Moreno et al. J Biol Chem. .

Abstract

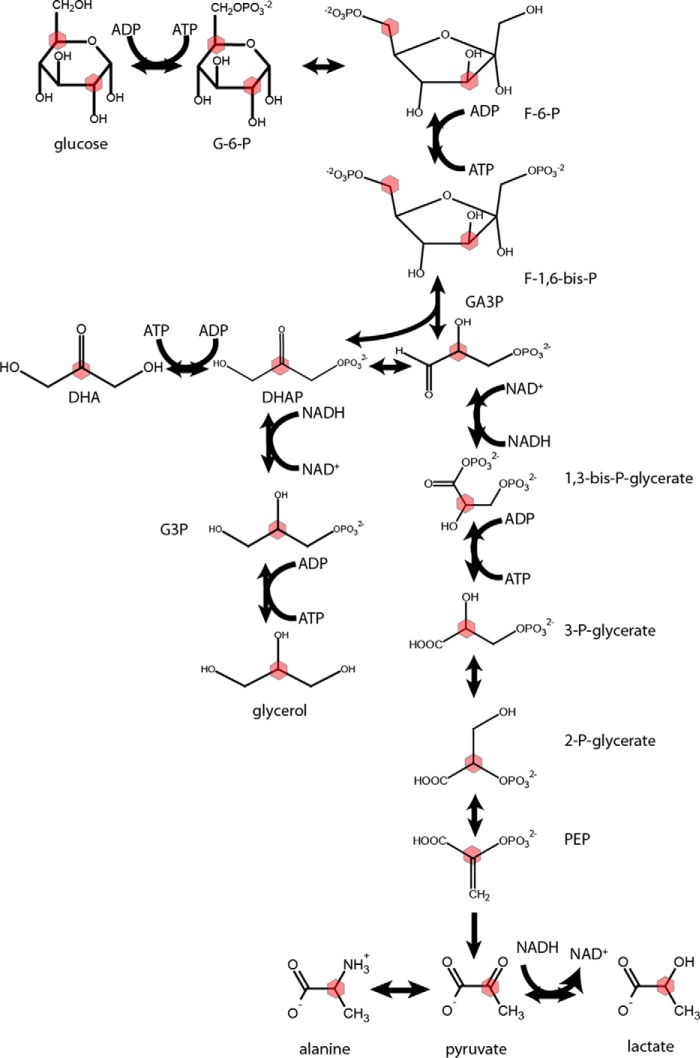
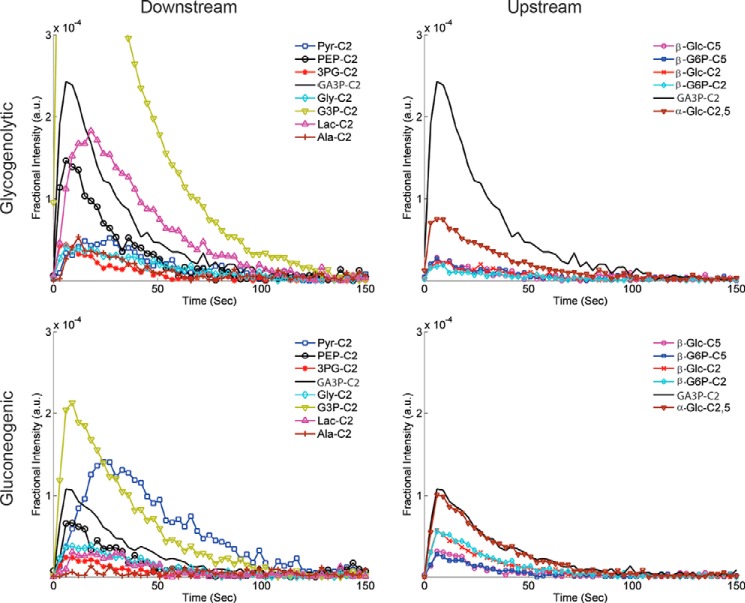
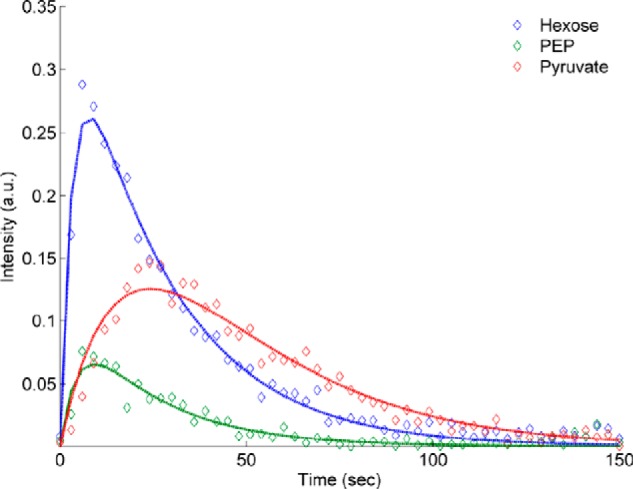
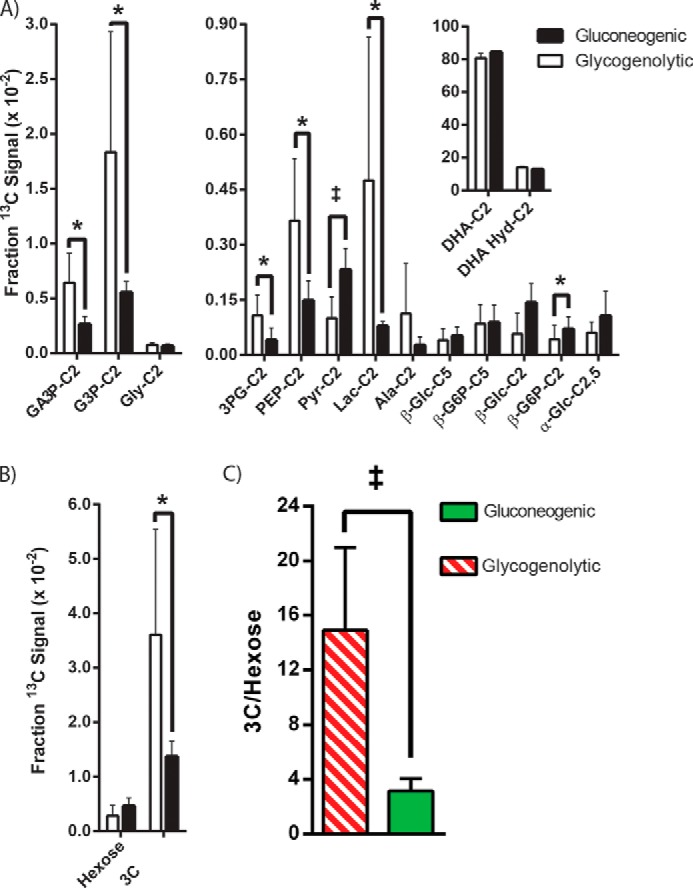
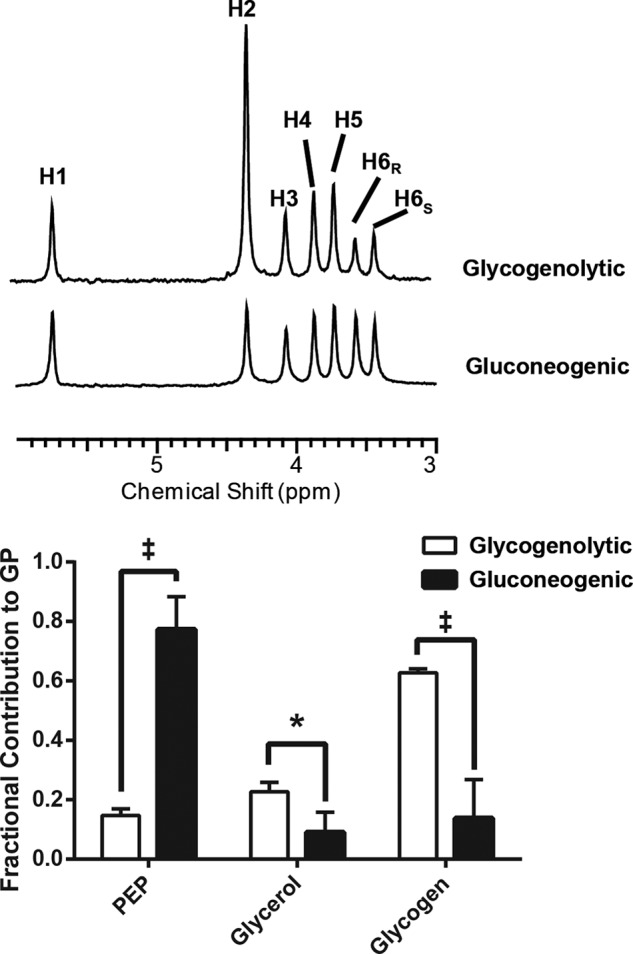
Glycogenolysis and gluconeogenesis are sensitive to nutritional state, and the net direction of flux is controlled by multiple enzymatic steps. This delicate balance in the liver is disrupted by a variety of pathological states including cancer and diabetes mellitus. Hyperpolarized carbon-13 magnetic resonance is a new metabolic imaging technique that can probe intermediary metabolism nondestructively. There are currently no methods to rapidly distinguish livers in a gluconeogenic from glycogenolytic state. Here we use the gluconeogenic precursor dihydroxyacetone (DHA) to deliver hyperpolarized carbon-13 to the perfused mouse liver. DHA enters gluconeogenesis at the level of the trioses. Perfusion conditions were designed to establish either a gluconeogenic or a glycogenolytic state. Unexpectedly, we found that [2-(13)C]DHA was metabolized within a few seconds to the common intermediates and end products of both glycolysis and gluconeogenesis under both conditions, including [2,5-(13)C]glucose, [2-(13)C]glycerol 3-phosphate, [2-(13)C]phosphoenolpyruvate (PEP), [2-(13)C]pyruvate, [2-(13)C]alanine, and [2-(13)C]lactate. [2-(13)C]Phosphoenolpyruvate, a key branch point in gluconeogenesis and glycolysis, was monitored in functioning tissue for the first time. Observation of [2-(13)C]PEP was not anticipated as the free energy difference between PEP and pyruvate is large. Pyruvate kinase is the only regulatory step of the common glycolytic-gluconeogenic pathway that appears to exert significant control over the kinetics of any metabolites of DHA. A ratio of glycolytic to gluconeogenic products distinguished the gluconeogenic from glycogenolytic state in these functioning livers.

Keywords: Diabetes; Dihydroxyacetone; Gluconeogenesis; Glucose Metabolism; Glycogenolytic; Glycolysis; Hyperpolarization; Nuclear Magnetic Resonance (NMR).


Figures

FIGURE 1.
FIGURE 1.
Metabolic scheme for metabolism of DHA in the liver. Colored hexagons denote the site of 13C enrichment. GA3P is a central metabolite in the metabolism of DHA, with fates composed of its reduction to 1,3 bisphosphoglycerate or its condensation with DHAP to produce a single fructose 1,6-bisphosphate. When 3-carbon molecules are discussed in this study, it refers not only to the trioses but also to pyruvate, lactate, and alanine.
FIGURE 2.
FIGURE 2.
1H-decoupled, 13C-detected spectra of purified glucose collected from the effluent of a perfused liver. The large peaks associated with the C2 and C5 positions arise from gluconeogenesis from [2-13C]DHA.
FIGURE 3.
FIGURE 3.
NMR spectra of metabolites of [2-13C]DHA. The spectra were obtained from a liver in a gluconeogenic state (A) versus a glycogenolytic state (B). Assignments were made by comparing the HP spectrum with the thermally polarized carbon spectrum of the extracts (Fig. 2) and known chemical shift values for the intermediates. In the case of GA3P, the resonance was assigned by comparison with a standard made of the pure compound. The spectra are the sum of 35 successive scans from a single hyperpolarization experiment.
FIGURE 4.
FIGURE 4.
Time/intensity curves for metabolites of [2-13C]DHA. Top and bottom, the intensity of the resonances of metabolites derived from DHA in the glycogenolytic state (top) versus the gluconeogenic state (bottom). Metabolites associated with GLYC are shown on the left, whereas those associated with GNG are on the right. GA3P is plotted in both the left panels and the right panels to provide a scale between the two groups. Pyr, pyruvate; 3PG, 3-phosphoglycerate; Lac, lactate.
FIGURE 5.
FIGURE 5.
Time course for hyperpolarized metabolites of DHA in the gluconeogenic state. Hexose denotes the sum of all the hexose resonances, while PEP and Pyruvate refer only to the individual metabolites. The data (open symbols) are the average of all the runs for each metabolite. The uncertainties in the data were taken from fitting each run individually. Error bars are omitted for clarity. Pyruvate kinase is the only enzyme of the glycolytic-gluconeogenic pathway that produces a delay in the kinetic curves. a.u., arbitrary units.
FIGURE 6.
FIGURE 6.
Areas under the curve for DHA and its metabolites. A, note that the two liver conditions produce equivalent total amounts of downstream signals versus the parent DHA molecule (inset). Differences at the 0.05% confidence level are denoted by asterisks, and differences at the 0.01% confidence level are denoted by the double dagger. Pyr, pyruvate; Lac, lactate. B, the two columns marked 3C (3-carbon) and Hexose plot the total intensity of the 6-carbon molecules versus that of the 3-carbon molecules. In the gluconeogenic condition, signal from the 6-carbon molecules increase significantly, whereas the 3-carbon resonances decrease. In the glycogenolytic condition, the opposite trend is observed. C, the 3-carbon/hexose (3C/hexose) ratio between the two states is significantly different at the 0.01 confidence level.
FIGURE 7.
FIGURE 7.
2H NMR spectra of the MAG derivative of glucose. Samples were collected from the effluent of a perfused liver in the gluconeogenic state versus the glycogenolytic state. The H2 labeling position is derived from exchange at the level of glucose-glucose-6-P and corresponds to the enrichment of the water used in the perfusate. The values 1 − (H5/H2), H5/H2, and (H5-H6s)/H2 report on glucose production from glycogenolysis, from glycerol, and from the tricarboxylic (TCA) cycle via phosphoenolpyruvate carboxykinase (PEPCK), respectively. Spectra from the gluconeogenic condition indicate that a large majority of the effluent glucose arose from GNG via phosphoenolpyruvate carboxykinase, whereas the fed condition is dominated by glycogenolysis. Lower panel, the sources of glucose production (GP) by the liver are markedly different between the two perfusion conditions.

References

    1. Jones J. G., Naidoo R., Sherry A. D., Jeffrey F. M., Cottam G. L., Malloy C. R. (1997) Measurement of gluconeogenesis and pyruvate recycling in the rat liver: a simple analysis of glucose and glutamate isotopomers during metabolism of [1,2,3-13C3]propionate. FEBS Lett. 412, 131–137 - PubMed
    1. Jones J. G., Solomon M. A., Cole S. M., Sherry A. D., Malloy C. R. (2001) An integrated 2H and 13C NMR study of gluconeogenesis and TCA cycle flux in humans. Am. J. Physiol. Endocrinol. Metab. 281, E848–E856 - PubMed
    1. Landau B. R., Wahren J., Chandramouli V., Schumann W. C., Ekberg K., Kalhan S. C. (1995) Use of 2H2O for estimating rates of gluconeogenesis: application to the fasted state. J. Clin. Invest. 95, 172–178 - PMC - PubMed
    1. Neese R. A., Schwarz J. M., Faix D., Turner S., Letscher A., Vu D., Hellerstein M. K. (1995) Gluconeogenesis and intrahepatic triose phosphate flux in response to fasting or substrate loads: application of the mass isotopomer distribution analysis technique with testing of assumptions and potential problems. J. Biol. Chem. 270, 14452–14466 - PubMed
    1. Petersen K. F., Price T., Cline G. W., Rothman D. L., Shulman G. I. (1996) Contribution of net hepatic glycogenolysis to glucose production during the early postprandial period. Am. J. Physiol. 270, E186–E191 - PubMed

Publication types

LinkOut - more resources