. 2015 Apr;64(4):1180-92.
doi: 10.2337/db14-0359. Epub 2014 Oct 28.

Increased dihydroceramide/ceramide ratio mediated by defective expression of degs1 impairs adipocyte differentiation and function

Affiliations

Increased dihydroceramide/ceramide ratio mediated by defective expression of degs1 impairs adipocyte differentiation and function

Nuria Barbarroja et al. Diabetes. 2015 Apr.

Abstract

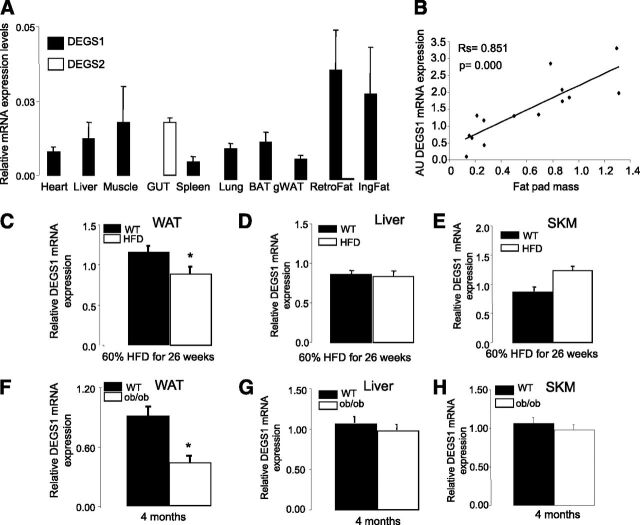
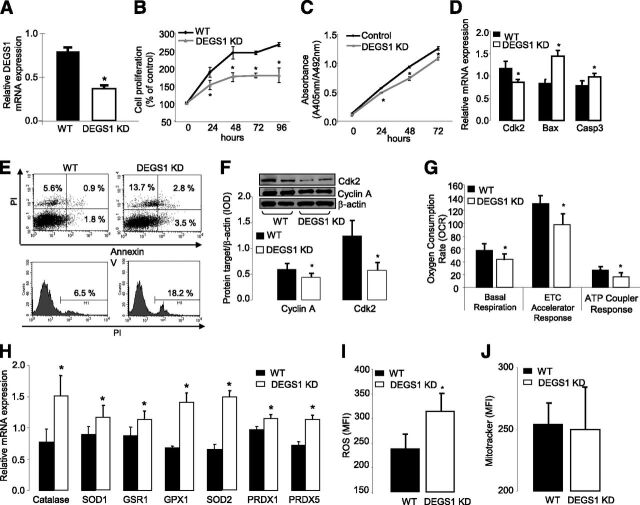
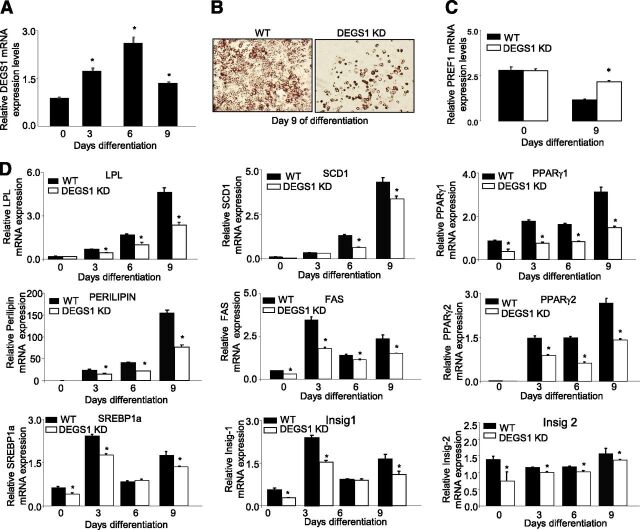
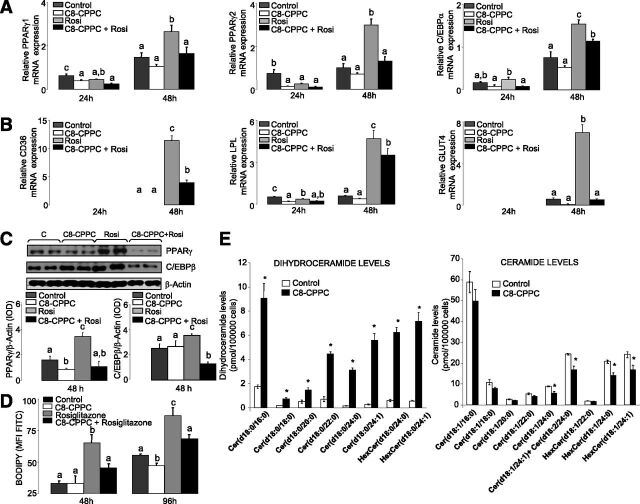
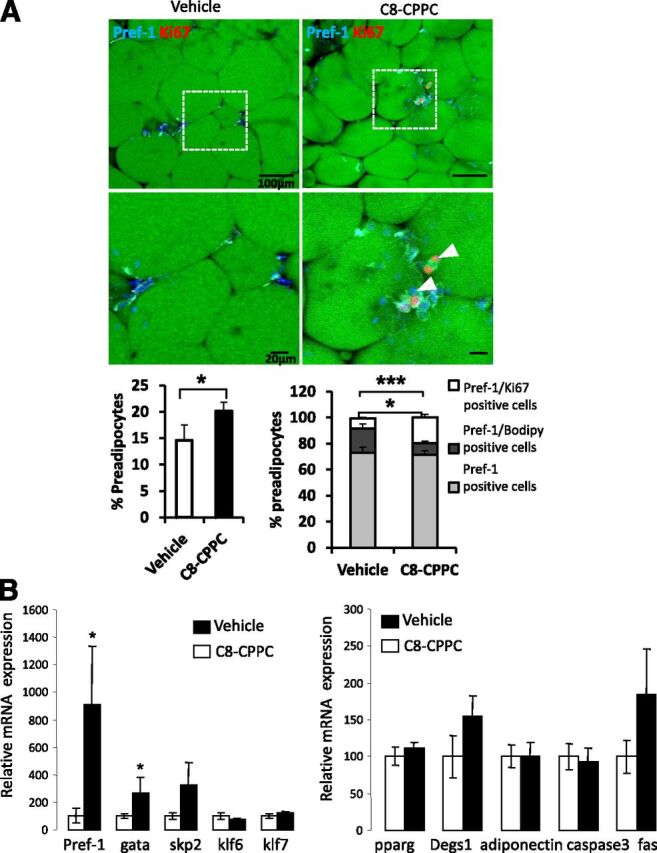
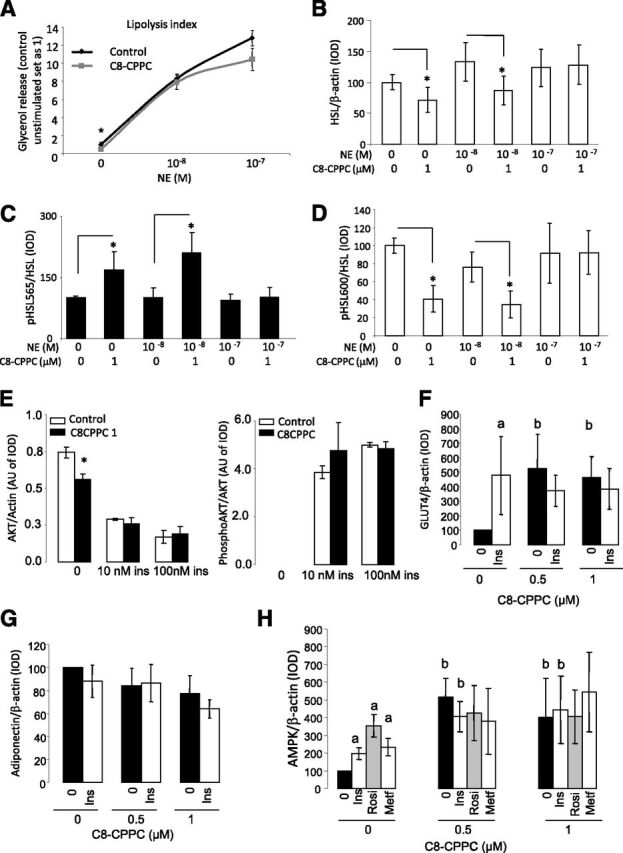
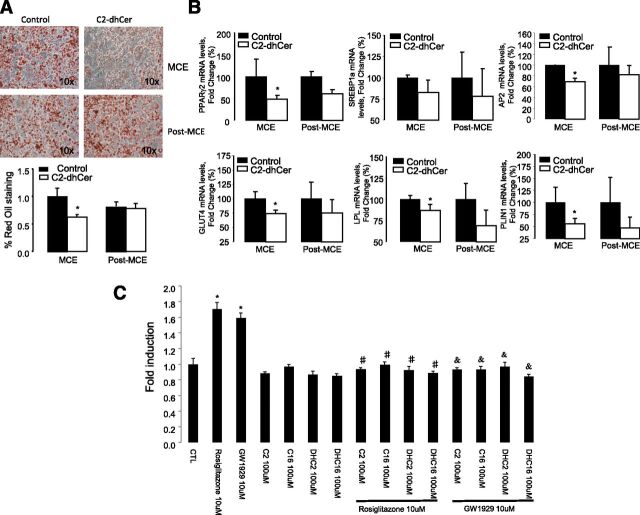
Adipose tissue dysfunction is an important determinant of obesity-associated, lipid-induced metabolic complications. Ceramides are well-known mediators of lipid-induced insulin resistance in peripheral organs such as muscle. DEGS1 is the desaturase catalyzing the last step in the main ceramide biosynthetic pathway. Functional suppression of DEGS1 activity results in substantial changes in ceramide species likely to affect fundamental biological functions such as oxidative stress, cell survival, and proliferation. Here, we show that degs1 expression is specifically decreased in the adipose tissue of obese patients and murine models of genetic and nutritional obesity. Moreover, loss-of-function experiments using pharmacological or genetic ablation of DEGS1 in preadipocytes prevented adipogenesis and decreased lipid accumulation. This was associated with elevated oxidative stress, cellular death, and blockage of the cell cycle. These effects were coupled with increased dihydroceramide content. Finally, we validated in vivo that pharmacological inhibition of DEGS1 impairs adipocyte differentiation. These data identify DEGS1 as a new potential target to restore adipose tissue function and prevent obesity-associated metabolic disturbances.


Figures

Figure 1. A: Tissue distribution of degs1. B: Correlation of degs1 mRNA expression and fat pad size. The Spearman correlation coefficients were calculated to estimate the linear correlations between variables. The rejection level for a null hypothesis was P < 0.01. Data are from 14 lean mice. C–E: Expression levels of degs1 mRNA in response to HFD. F–H: Expression levels of degs1 mRNA in ob/ob mice. Values are the mean ± SEM for six to eight animals per group. *P < 0.05 vs. WT. AU, arbitrary units; BAT, brown AT; gWAT, gonadal WAT; IngFat, inguinal fat; RetroFat, retroperitoneal fat; SKM, skeletal muscle.
Figure 1
A: Tissue distribution of degs1. B: Correlation of degs1 mRNA expression and fat pad size. The Spearman correlation coefficients were calculated to estimate the linear correlations between variables. The rejection level for a null hypothesis was P < 0.01. Data are from 14 lean mice. C–E: Expression levels of degs1 mRNA in response to HFD. F–H: Expression levels of degs1 mRNA in ob/ob mice. Values are the mean ± SEM for six to eight animals per group. *P < 0.05 vs. WT. AU, arbitrary units; BAT, brown AT; gWAT, gonadal WAT; IngFat, inguinal fat; RetroFat, retroperitoneal fat; SKM, skeletal muscle.
Figure 2. A: mRNA expression of degs1 in 3T3-L1 treated with short hairpin RNA (shRNA) against degs1. B and C: Cell proliferation (XTT and BrdU assays every 24 h until 96 and 72 h, respectively). D: mRNA expression of Cdk2, Bcl2, Bax, and Caspase3. E: Apoptosis and cell death rate. F: Protein expression of Cdk2. G: Oxygen consumption rate. H: mRNA expression of antioxidant machinery genes. I: Reactive oxygen species production. J: Mitochondria levels. All these experiments were perfomed in degs1 KD and WT 3T3-L1 cells. Values are the mean ± SEM of three separate experiments performed in triplicate. ETC, electron transport chain; MFI, mean fluorescence intensity; PI, propidium iodide. *P < 0.05.
Figure 2
A: mRNA expression of degs1 in 3T3-L1 treated with short hairpin RNA (shRNA) against degs1. B and C: Cell proliferation (XTT and BrdU assays every 24 h until 96 and 72 h, respectively). D: mRNA expression of Cdk2, Bcl2, Bax, and Caspase3. E: Apoptosis and cell death rate. F: Protein expression of Cdk2. G: Oxygen consumption rate. H: mRNA expression of antioxidant machinery genes. I: Reactive oxygen species production. J: Mitochondria levels. All these experiments were perfomed in degs1 KD and WT 3T3-L1 cells. Values are the mean ± SEM of three separate experiments performed in triplicate. ETC, electron transport chain; MFI, mean fluorescence intensity; PI, propidium iodide. *P < 0.05.
Figure 3. A: mRNA expression of degs1 in 3T3-L1 cells during adipocyte differentiation. B: Lipid accumulation at day 9 of differentiation, Oil Red O staining. C: mRNA expression of PREF1 in WT and degs1 KD cells during differentiation. D: mRNA expression of genes involved in adipocyte differentiation and lipid accumulation. Values are the mean ± SEM of three separate experiments performed in triplicate. FAS, fatty acid synthase; Insig, insulin-induced gene; LPL, lipoprotein lipase. *P < 0.05.
Figure 3
A: mRNA expression of degs1 in 3T3-L1 cells during adipocyte differentiation. B: Lipid accumulation at day 9 of differentiation, Oil Red O staining. C: mRNA expression of PREF1 in WT and degs1 KD cells during differentiation. D: mRNA expression of genes involved in adipocyte differentiation and lipid accumulation. Values are the mean ± SEM of three separate experiments performed in triplicate. FAS, fatty acid synthase; Insig, insulin-induced gene; LPL, lipoprotein lipase. *P < 0.05.
Figure 4. 3T3-L1 cells treated with C8-CPPC and/or rosiglitazone. A and B: mRNA expression of genes involved in adipocyte differentiation and lipid accumulation at 24 and 48 h after induction. C: Protein expression levels of PPARγ2 and cEBPα. D: Lipid content after 48 and 96 h of differentiation. Values are the mean ± SEM of two separate experiments performed in triplicate. One-way ANOVA was used to analyze the statistical significance between treatments at 24 and 48 h. Significant differences (Duncan test, P < 0.05) are indicated with different letters. E: DhCer, Cer, and hexosylceramide (HexCer) levels after 48 h of differentiation. Values are the mean ± SEM of two separate experiments performed in triplicate. cEBP, CCAAT/enhancer binding protein; d, day; FITC, fluorescein isothiocyanate; MFI, mean fluorescence intensity; Rosi, rosiglitazone. *P < 0.05.
Figure 4
3T3-L1 cells treated with C8-CPPC and/or rosiglitazone. A and B: mRNA expression of genes involved in adipocyte differentiation and lipid accumulation at 24 and 48 h after induction. C: Protein expression levels of PPARγ2 and cEBPα. D: Lipid content after 48 and 96 h of differentiation. Values are the mean ± SEM of two separate experiments performed in triplicate. One-way ANOVA was used to analyze the statistical significance between treatments at 24 and 48 h. Significant differences (Duncan test, P < 0.05) are indicated with different letters. E: DhCer, Cer, and hexosylceramide (HexCer) levels after 48 h of differentiation. Values are the mean ± SEM of two separate experiments performed in triplicate. cEBP, CCAAT/enhancer binding protein; d, day; FITC, fluorescein isothiocyanate; MFI, mean fluorescence intensity; Rosi, rosiglitazone. *P < 0.05.
Figure 5. C8-CPPC inhibitor increases proliferation and decreases lipid accumulation in preadipocytes in vivo. Ten-week-old mice were given a 45% HFD for 5 weeks before being treated intraperitoneally with vehicle or C8-CPPC inhibitor (2 mg/kg/day) over 9 days. A: Representative images of immunofluorescence analysis of gonadal AT of control (vehicle) and C8-CPPC–treated mice are presented with Pref-1 (cyan) and Ki67 (red, white arrows). Nuclei and lipids are respectively stained with Hoechst stain (blue) and BODIPY (green). Scale bars: 100 or 20 μm. Quantification of preadipocytes (left graph) (percentage of Pref-1+ cells/total cells) and (right graph) Ki67+ (white bars)/BODIPY+ (dark gray bars) cells among preadipocytes (Pref-1+ cells) (light gray bars). B: mRNA expression of preadipocyte markers and pparg, degs1, adiponectin, caspase 3, and fas in gonadal AT of control and C8-CPPC–treated mice. n = 7–8 mice per experimental group. Values are the mean ±SEM. *P < 0.05, ***P < 0.0001 vs. vehicle.
Figure 5
C8-CPPC inhibitor increases proliferation and decreases lipid accumulation in preadipocytes in vivo. Ten-week-old mice were given a 45% HFD for 5 weeks before being treated intraperitoneally with vehicle or C8-CPPC inhibitor (2 mg/kg/day) over 9 days. A: Representative images of immunofluorescence analysis of gonadal AT of control (vehicle) and C8-CPPC–treated mice are presented with Pref-1 (cyan) and Ki67 (red, white arrows). Nuclei and lipids are respectively stained with Hoechst stain (blue) and BODIPY (green). Scale bars: 100 or 20 μm. Quantification of preadipocytes (left graph) (percentage of Pref-1+ cells/total cells) and (right graph) Ki67+ (white bars)/BODIPY+ (dark gray bars) cells among preadipocytes (Pref-1+ cells) (light gray bars). B: mRNA expression of preadipocyte markers and pparg, degs1, adiponectin, caspase 3, and fas in gonadal AT of control and C8-CPPC–treated mice. n = 7–8 mice per experimental group. Values are the mean ±SEM. *P < 0.05, ***P < 0.0001 vs. vehicle.
Figure 6. A: Glycerol release in 3T3-L1 adipocytes exposed for 48 h to C8-CPPC and stimulated with NE for 6 h. B–D: Results from Western blot analysis for phosphorylated (p) HSL/HSL ratio and total HSL in 3T3-L1 adipocytes exposed for 48 h to C8-CPPC and stimulated with NE for 6 h. Graphs show the mean ± SEM of two separated experiments: *P < 0.05. E: Effects of pharmacological inhibition of DEGS1 on insulin (ins) signaling. Results from Western blot analysis for p-AKT and AKT in 3T3-L1 adipocytes exposed 48 or 72 h with C8-CPPC 1 µmol/L and increased concentrations of insulin (10–100 nmol/L) for 15 min. F and G: Results from Western blot analysis for Glut4 and adiponectin in 3T3-L1 adipocytes exposed with C8-CPPC 0.5–1 µmol/L and insulin (100 nmol/L) for 48 h. H: Results from Western blot analysis for AMPK in 3T3-L1 adipocytes exposed to C8-CPPC 0.5–1 µmol/L and insulin (Ins) (100 nmol/L), rosiglitazone (Rosi) (1 nmol/L), and metformin (Metf) (100 nmol/L) for 48 h. aP < 0.05 vs. untreated cells (Ins, Rosi, or Metf effect); bP < 0.05 vs. 0 μmol/L C8-CPPC (C8-CPPC effect). AU, arbitrary units; IOD, integrated optical density.
Figure 6
A: Glycerol release in 3T3-L1 adipocytes exposed for 48 h to C8-CPPC and stimulated with NE for 6 h. B–D: Results from Western blot analysis for phosphorylated (p) HSL/HSL ratio and total HSL in 3T3-L1 adipocytes exposed for 48 h to C8-CPPC and stimulated with NE for 6 h. Graphs show the mean ± SEM of two separated experiments: *P < 0.05. E: Effects of pharmacological inhibition of DEGS1 on insulin (ins) signaling. Results from Western blot analysis for p-AKT and AKT in 3T3-L1 adipocytes exposed 48 or 72 h with C8-CPPC 1 µmol/L and increased concentrations of insulin (10–100 nmol/L) for 15 min. F and G: Results from Western blot analysis for Glut4 and adiponectin in 3T3-L1 adipocytes exposed with C8-CPPC 0.5–1 µmol/L and insulin (100 nmol/L) for 48 h. H: Results from Western blot analysis for AMPK in 3T3-L1 adipocytes exposed to C8-CPPC 0.5–1 µmol/L and insulin (Ins) (100 nmol/L), rosiglitazone (Rosi) (1 nmol/L), and metformin (Metf) (100 nmol/L) for 48 h. aP < 0.05 vs. untreated cells (Ins, Rosi, or Metf effect); bP < 0.05 vs. 0 μmol/L C8-CPPC (C8-CPPC effect). AU, arbitrary units; IOD, integrated optical density.
Figure 7. A and B: DhCers impair adipocyte differentiation during early adipogenesis. 3T3-L1 preadipocytes treated with C2DhCer (50 µmol/L) for a period of 48 h at day 0 or day 3 of differentiation. Oil Red O staining and mRNA expression of adipogenesis and lipid metabolism genes. Values are the mean ± SEM of two separate experiments performed in triplicate. *P < 0.05 vs. control. C: DhCers decrease ligand-mediated PPARγ transactivation. Cells were treated with DMSO as a control group and rosiglitazone 10 μmol/L, GW1929 10 μmol/L, and C2 and C16DhCers and Cers 100 μmol/L as indicated. Graphs represent the average of three independent experiments. *P < 0.05 vs. control cells; #P < 0.05 vs. rosiglitazone; &P < 0.05 vs. GW1929. CTL, control.
Figure 7
A and B: DhCers impair adipocyte differentiation during early adipogenesis. 3T3-L1 preadipocytes treated with C2DhCer (50 µmol/L) for a period of 48 h at day 0 or day 3 of differentiation. Oil Red O staining and mRNA expression of adipogenesis and lipid metabolism genes. Values are the mean ± SEM of two separate experiments performed in triplicate. *P < 0.05 vs. control. C: DhCers decrease ligand-mediated PPARγ transactivation. Cells were treated with DMSO as a control group and rosiglitazone 10 μmol/L, GW1929 10 μmol/L, and C2 and C16DhCers and Cers 100 μmol/L as indicated. Graphs represent the average of three independent experiments. *P < 0.05 vs. control cells; #P < 0.05 vs. rosiglitazone; &P < 0.05 vs. GW1929. CTL, control.

References

    1. Montague CT, O’Rahilly S. The perils of portliness: causes and consequences of visceral adiposity. Diabetes 2000;49:883–888 - PubMed
    1. Carobbio S, Rodriguez-Cuenca S, Vidal-Puig A. Origins of metabolic complications in obesity: ectopic fat accumulation. The importance of the qualitative aspect of lipotoxicity. Curr Opin Clin Nutr Metab Care 2011;14:520–526 - PubMed
    1. Chavez JA, Summers SA. Lipid oversupply, selective insulin resistance, and lipotoxicity: molecular mechanisms. Biochim Biophys Acta 2010;1801:252–265 - PMC - PubMed
    1. Chavez JA, Summers SA. A ceramide-centric view of insulin resistance. Cell Metab 2012;15:585–594 - PubMed
    1. Shah C, Yang G, Lee I, Bielawski J, Hannun YA, Samad F. Protection from high fat diet-induced increase in ceramide in mice lacking plasminogen activator inhibitor 1. J Biol Chem 2008;283:13538–13548 - PMC - PubMed

Publication types

MeSH terms