. 2014 Jul 28;3(7):742-53.
doi: 10.1016/j.molmet.2014.07.005. eCollection 2014 Oct.

Contraction-stimulated glucose transport in muscle is controlled by AMPK and mechanical stress but not sarcoplasmatic reticulum Ca(2+) release

Affiliations

Contraction-stimulated glucose transport in muscle is controlled by AMPK and mechanical stress but not sarcoplasmatic reticulum Ca(2+) release

Thomas E Jensen et al. Mol Metab. .

Abstract

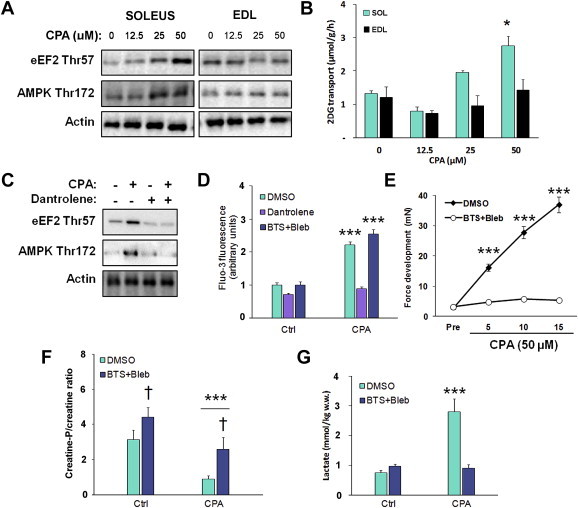
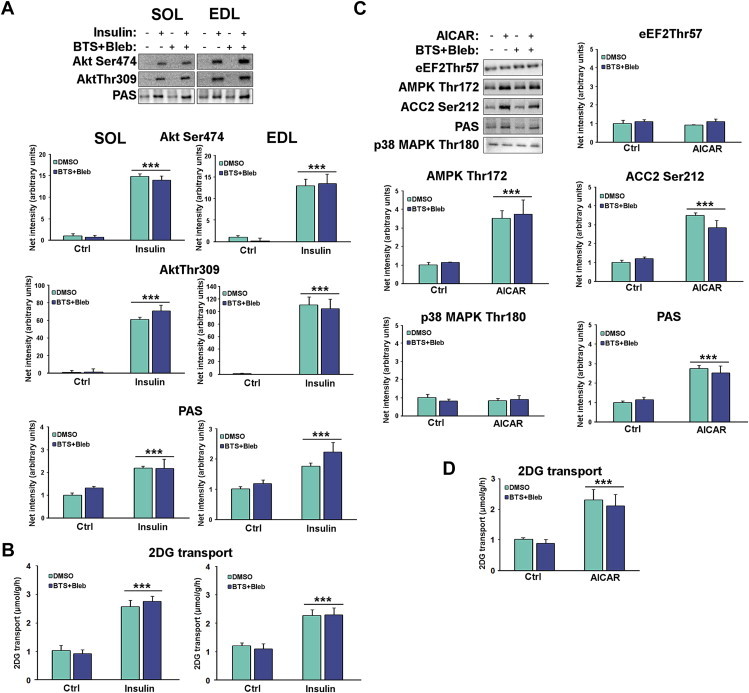
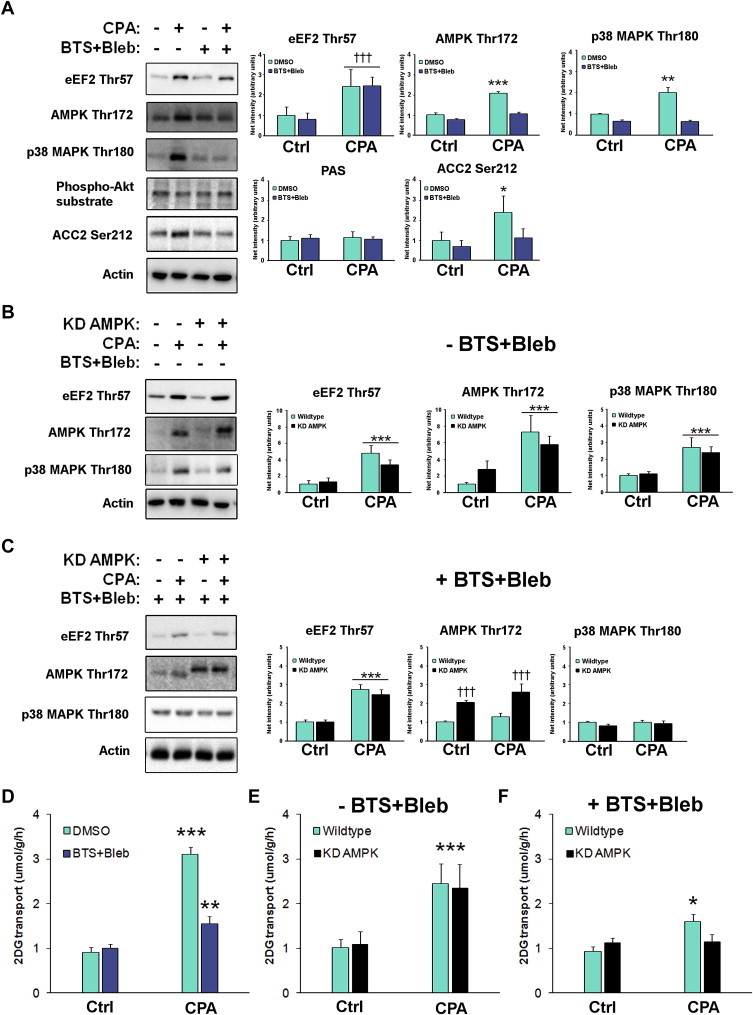
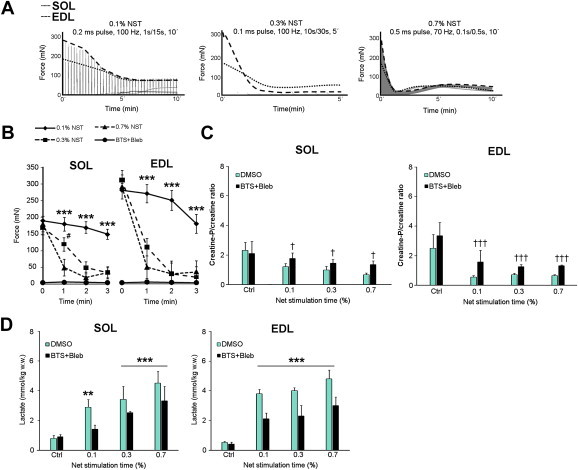
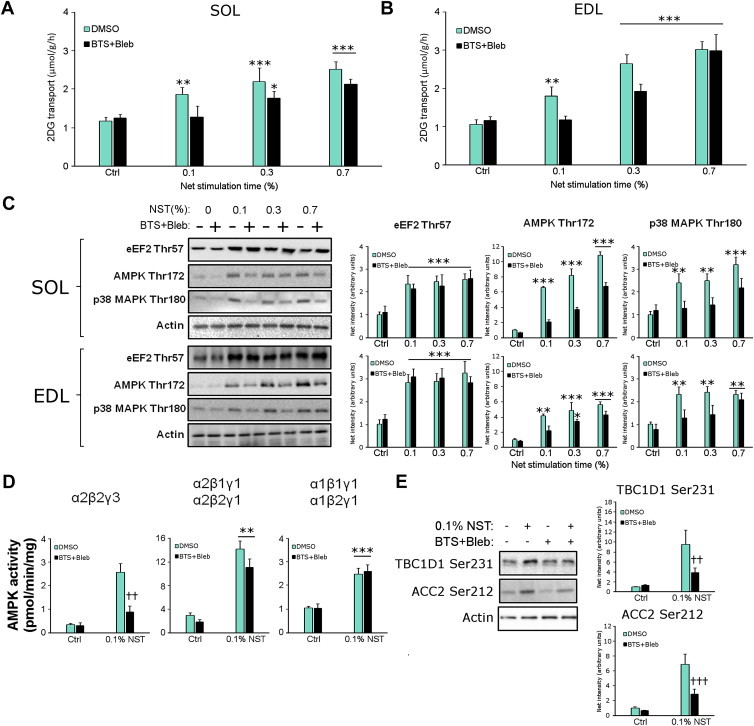
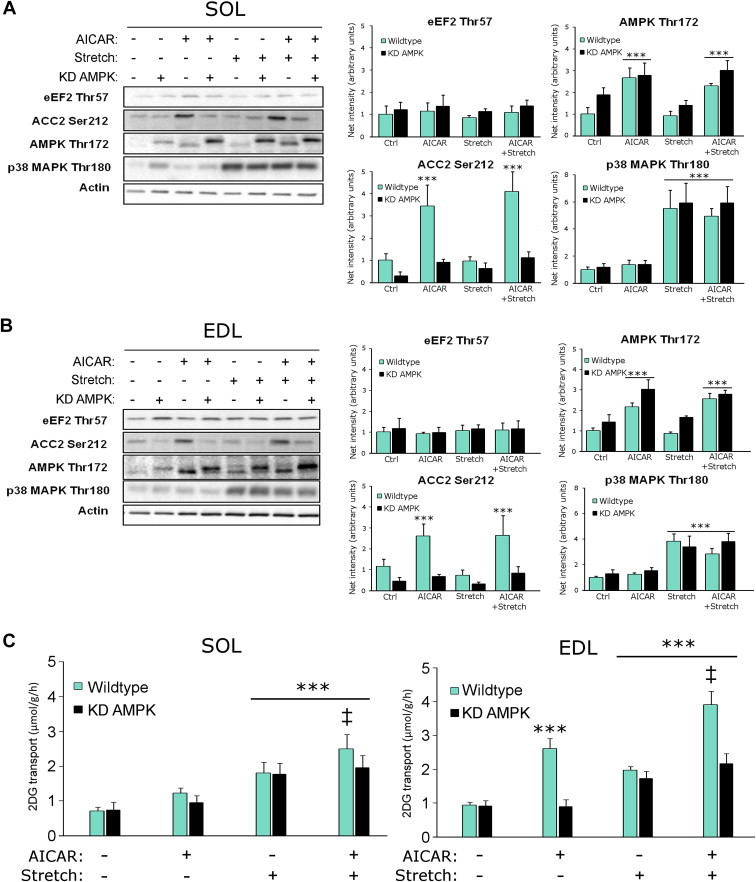
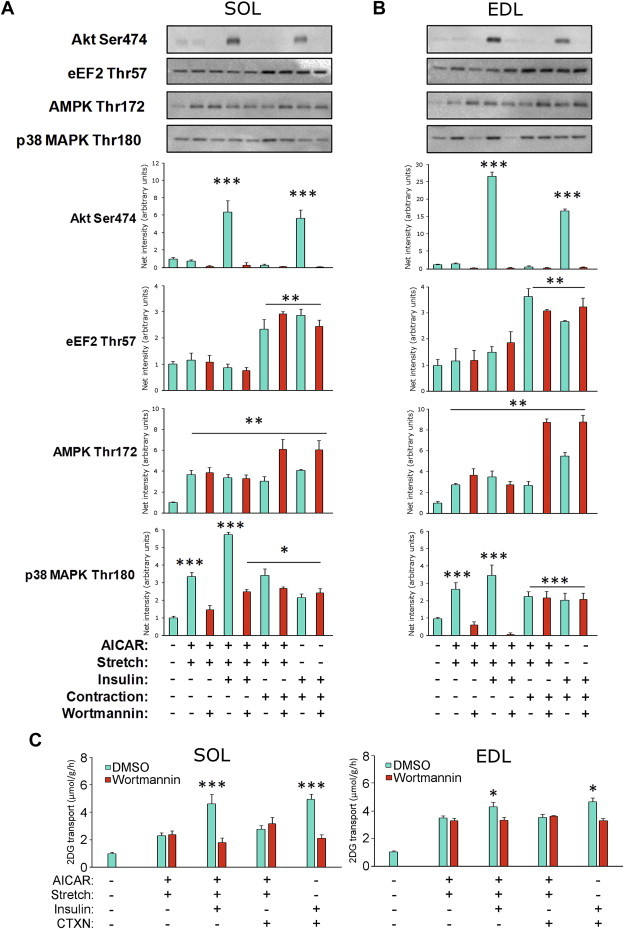
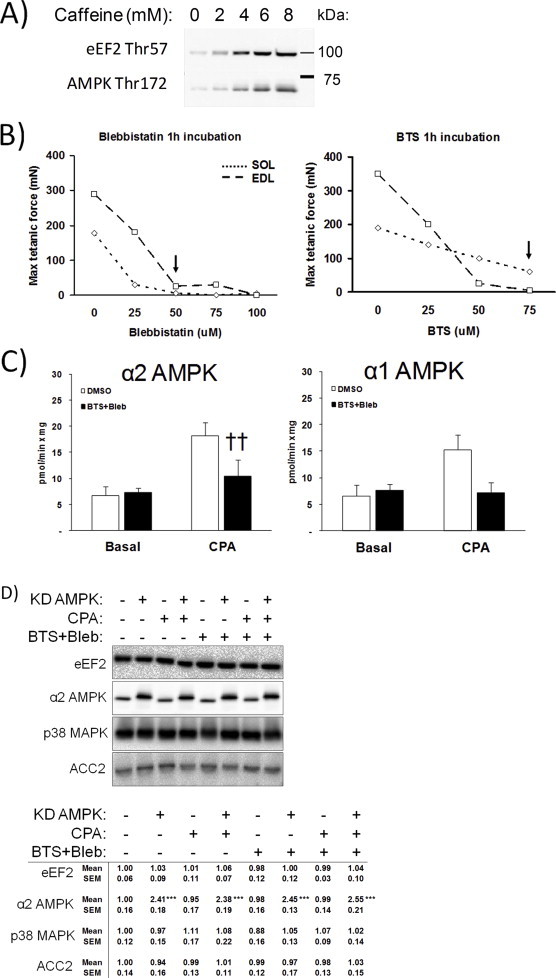
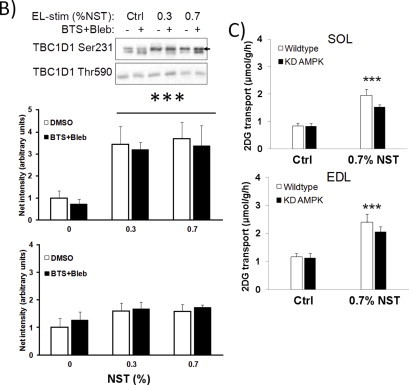
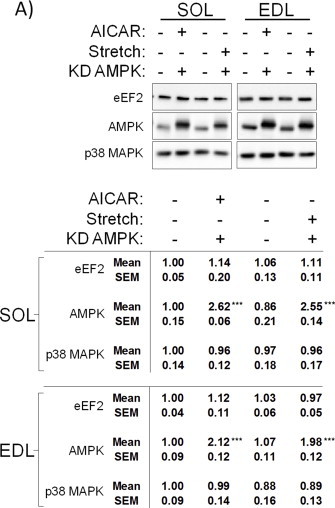
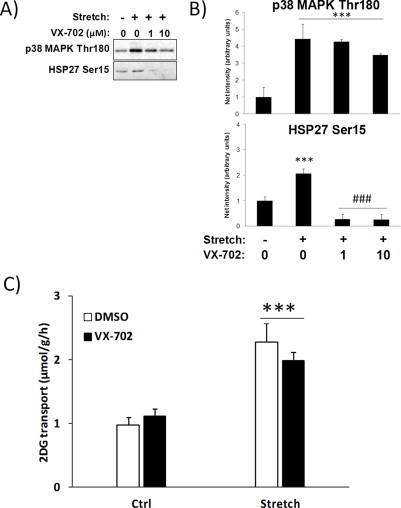
Understanding how muscle contraction orchestrates insulin-independent muscle glucose transport may enable development of hyperglycemia-treating drugs. The prevailing concept implicates Ca(2+) as a key feed forward regulator of glucose transport with secondary fine-tuning by metabolic feedback signals through proteins such as AMPK. Here, we demonstrate in incubated mouse muscle that Ca(2+) release is neither sufficient nor strictly necessary to increase glucose transport. Rather, the glucose transport response is associated with metabolic feedback signals through AMPK, and mechanical stress-activated signals. Furthermore, artificial stimulation of AMPK combined with passive stretch of muscle is additive and sufficient to elicit the full contraction glucose transport response. These results suggest that ATP-turnover and mechanical stress feedback are sufficient to fully increase glucose transport during muscle contraction, and call for a major reconsideration of the established Ca(2+) centric paradigm.

Keywords: AMPK; Ca2+; Exercise; Skeletal muscle; Stretch.


Figures

Figure 1
Figure 1
Optimization of the cyclopiazonic acid (CPA)-induced tonic contraction-model. A) Signalling blots from cyclopiazonic acid (CPA, 15′ stimulation) dose–response experiment in mouse soleus and EDL muscles (n = 2) and B) Dose–response of cyclopiazonic acid (CPA)-stimulated glucose transport (15 min), n = 2/muscle, *p < 0.05 using Tukey's post hoc test. C) Prevention of the response to 50 μM CPA in soleus muscle by pretreatment with the sarcoplasmatic reticulum Ca2+ release blocker dantrolene (60 μM, 1 h), n = 4. D) Fluo-3 Ca2+ fluorescence +/− CPA (50 μM, 1′) in L6 myotubes pretreated with DMSO, dantrolene (60 μM, 20′) or myosin ATPase inhibitors BTS (75 μM, 20′) and blebbistatin (50 μM, 20′), n = 2. E) CPA-stimulated force-development timecourse in soleus muscles treated +/− myosin ATPase blockers, n = 6–8. F) Creatine-phosphate/creatine ratio in SOL muscles stimulated with CPA (50 μM, 15 min) in the presence or absence of BTS (50 μM)+Bleb (75 μM), n = 6–8, *** ANOVA main-effect of CPA, †p < 0.05 ANOVA main-effect of BTS + Bleb. G) CPA-stimulated lactate production +/− myosin ATPase blockers, n = 6–8. Data are mean ± S.E.M.
Figure 2
Figure 2
Neither insulin nor AICAR-stimulated signalling or glucose transport are affected by myosin ATPase blockers. A) Representative western blots and quantifications of control and insulin-stimulated (60 nM, 20 min) phosphorylations in SOL and EDL and B) corresponding 2DG transport in SOL and EDL. n = 9, ***p < 0.001 ANOVA main-effect of insulin. C) Representative western blots and quantifications of control vs. AICAR-stimulated (2 mM, 40 min) phosphorylations and D) corresponding 2DG transport (right) in EDL, n = 9, ***p < 0.001 ANOVA main-effect of AICAR. Data are mean ± S.E.M.
Figure 3
Figure 3
Cyclopiazonic acid (CPA)-induced glucose transport depends on AMPK and likely mechanical stress but not SR Ca2+. A) Quantifications of immunoblots from CPA-stimulated SOL muscles +/− BTS + Bleb. Quantified protein phosphorylation are indicated above the graphs throughout, n = 6, †††p < 0.001 ANOVA main-effect of CPA, */**/***p < 0.05/0.01/0.001 Tukey's post hoc test effect of CPA. B) Quantifications of immunoblots from CPA-stimulated wildtype and kinase-dead (KD) AMPK overexpressing SOL muscles, n = 6, ***p < 0.001 ANOVA main-effect of CPA. C) Quantifications of immunoblots from CPA-stimulated wildtype and KD AMPK overexpressing SOL muscles in the presence of BTS + Bleb. n = 6, p < 0.001 ANOVA main-effect of CPA, ††† ANOVA genotype main-effect. CPA-stimulated 2-deoxyglucose (2DG) transport (bottom graph) in mouse soleus D) +/− myosin ATP blockers E) in wildtype and KD AMPK mice F) combining myosin ATPase blockers with KD AMPK overexpression, n = 6. */**/***p < 0.05/0.01/0.001 CPA-effect using Tukey's post hoc test. Data are mean ± S.E.M.
Figure 4
Figure 4
Metabolic responses to electrically stimulated contraction protocols representing different intensities. A) Representative force curves from low (0.1% net stimulation time (NST)), intermediate (0.3% NST) and high (0.7% NST) intensity electrical stimulation regimens in mouse soleus (SOL) and extensor digitorum longus (EDL) muscles B) quantification of the peak force production for the first 3 min with 0.1, 0.3 and 0.7% NST electrical stimulation regimens and myosin ATPase blocker treated muscles, ***p < 0.001 0.1% NST vs. BTS + Bleb, #p < 0.05 0.1% NST vs. 0.3% NST using Tukey's post hoc test. C) Creatine-phosphate/creatine ratio in SOL and EDL muscles under the conditions described above, †/†††p < 0.05/0.001 ANOVA BTS + Bleb main effect. D) Lactate production in SOL and EDL, **/***p < /0.01/0.001 contraction-effect vs. ctrl using Tukey's post hoc test. n = 6–8. Data are mean ± S.E.M.
Figure 5
Figure 5
Low-intensity electrically-induced contraction-stimulated glucose transport but not Ca2+ release is abolished by myosin ATPase blockade. 2-deoxyglucose (2DG) transport in A) soleus (SOL) and B) extensor digitorum longus (EDL). C) Representative western blots and quantifications in SOL (top) and EDL (bottom). D) AMPK heterotrimer activities in EDL and E) Representative western blots and quantifications of known AMPK substrates TBC1D1 Ser231 and ACC2 Ser212 in EDL. */**/***p < 0.05/0.01/0.001 contraction-effect vs. ctrl or in (B) 0.1% NST vs. 0.3% NST using Tukey's post hoc test, #p < 0.05 contraction-effect 0.3% NST vs. 0.7% NST, ††p < 0.01 ANOVA contraction × inhibitor interaction. n = 6–8. Data are mean ± S.E.M.
Figure 6
Figure 6
Combined AMPK activation and mechanical stress-stimulation mobilize glucose transport by parallel mechanisms without increasing Ca2+ release. A) Representative western blots and quantifications from wildtype and kinase-dead (KD) AMPK expressing soleus and B) extensor digitorum longus (EDL) stimulated with AICAR (2 mM, 40′), passive stretch (50 mN, 15′) or the two combined, ***p < 0.001 vs. control using Tukey's post hoc test. C) 2-deoxyglucose (2DG) transport in wildtype and KD AMPK SOL and EDL, stimulated with AICAR (2 mM for 40′) or stretch (50 mN, 15′) or the two stimuli combined, ***p < 0.001 increase above control using Tukey's post hoc test. ‡p < 0.05 AICAR vs. AICAR + stretch. n = 6. Data are mean ± S.E.M.
Figure 7
Figure 7
AICAR and stretch recruit the full contraction, but not insulin-stimulated glucose transport response. Representative western blots and quantifications from A) soleus (SOL) and B) extensor digitorum longus (EDL) muscles in which AICAR + cyclic stretch stimulation was combined with either insulin (60 nM, 20′) or contraction (CTXN, 0.3% NST protocol) in the presence or absence of the PI3K inhibitor wortmannin (wmn, 500 nM, 1 h). Phosphorylations measured are indicated above the individual graphs. C) 2DG transport measurements in SOL (left) and EDL (right) under the same conditions. */**/***p < 0.05/0.01/0.001 increase above control using Tukey's post hoc test, n = 4–6. Data are mean ± S.E.M.
None
None
None
None

References

    1. James D.E., Kraegen E.W., Chisholm D.J. Muscle glucose metabolism in exercising rats: comparison with insulin stimulation. American Journal of Physiology. 1985;248:E575–E580. - PubMed
    1. Goodyear L.J., Kahn B.B. Exercise, glucose transport, and insulin sensitivity. Annual Review of Medicine. 1998;49:235–261. - PubMed
    1. Richter E.A., Hargreaves M. Exercise, GLUT4, and skeletal muscle glucose uptake. Physiological Reviews. 2013;93:993–1017. - PubMed
    1. Mu J., Brozinick J.T., Jr., Valladares O., Bucan M., Birnbaum M.J. A role for AMP-activated protein kinase in contraction- and hypoxia-regulated glucose transport in skeletal muscle. Molecular Cell. 2001;7:1085–1094. - PubMed
    1. Ihlemann J., Ploug T., Hellsten Y., Galbo H. Effect of tension on contraction-induced glucose transport in rat skeletal muscle. American Journal of Physiology. 1999;277:E208–E214. - PubMed

LinkOut - more resources