Randomized Controlled Trial
. 2015 Apr;87(4):828-38.
doi: 10.1038/ki.2014.350. Epub 2014 Oct 29.

Cellular and molecular immune profiles in renal transplant recipients after conversion from tacrolimus to sirolimus

Affiliations
Randomized Controlled Trial

Cellular and molecular immune profiles in renal transplant recipients after conversion from tacrolimus to sirolimus

Lorenzo Gallon et al. Kidney Int. 2015 Apr.

Abstract

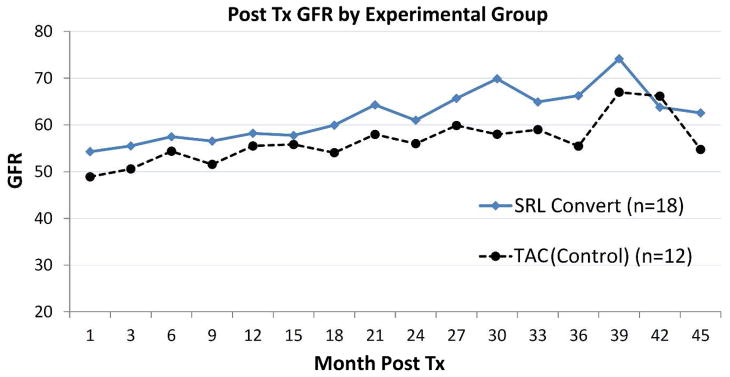
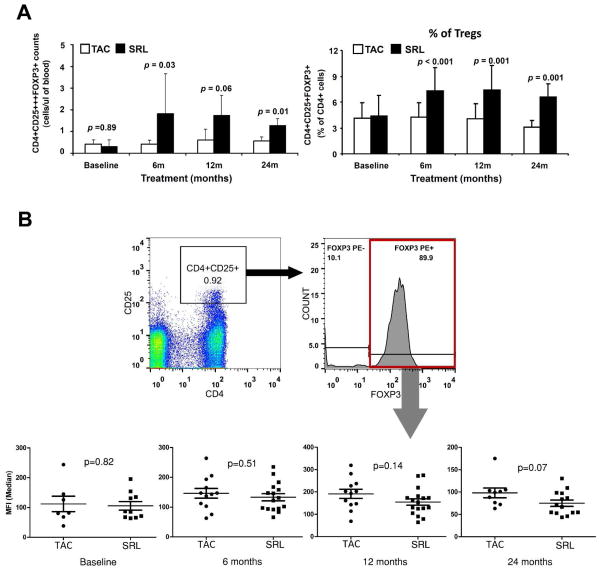
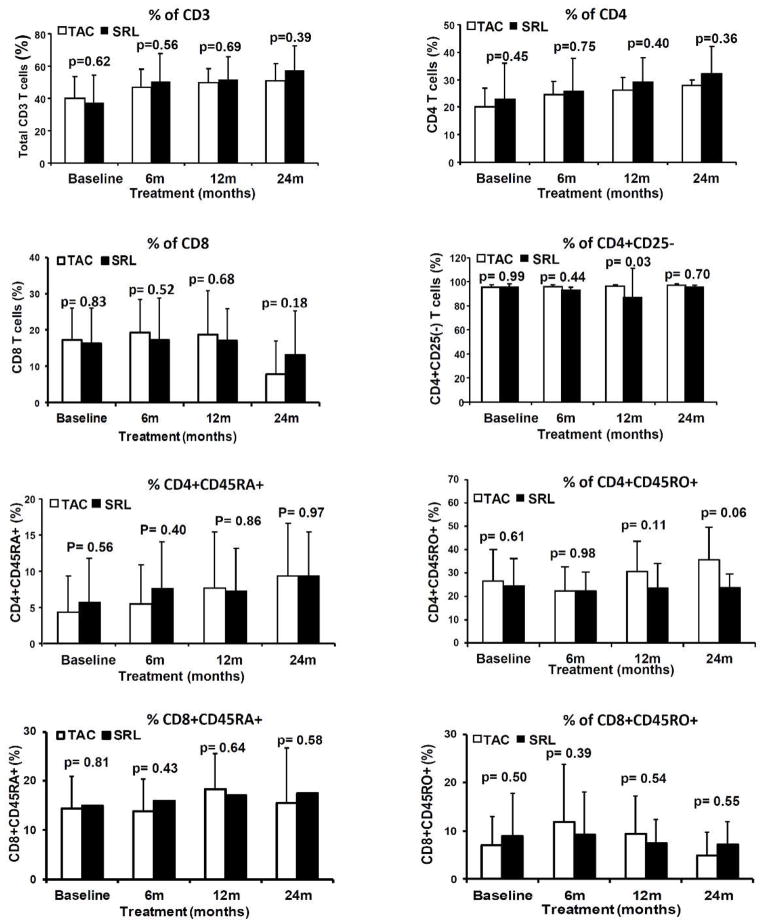
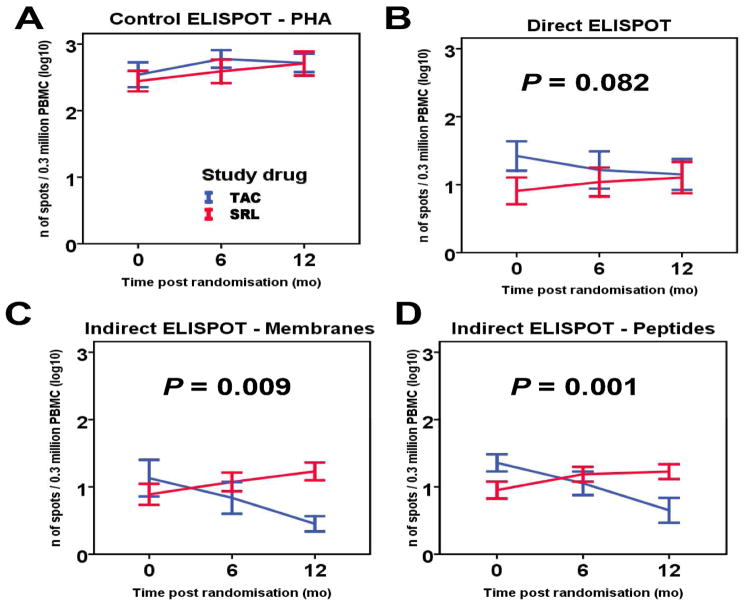
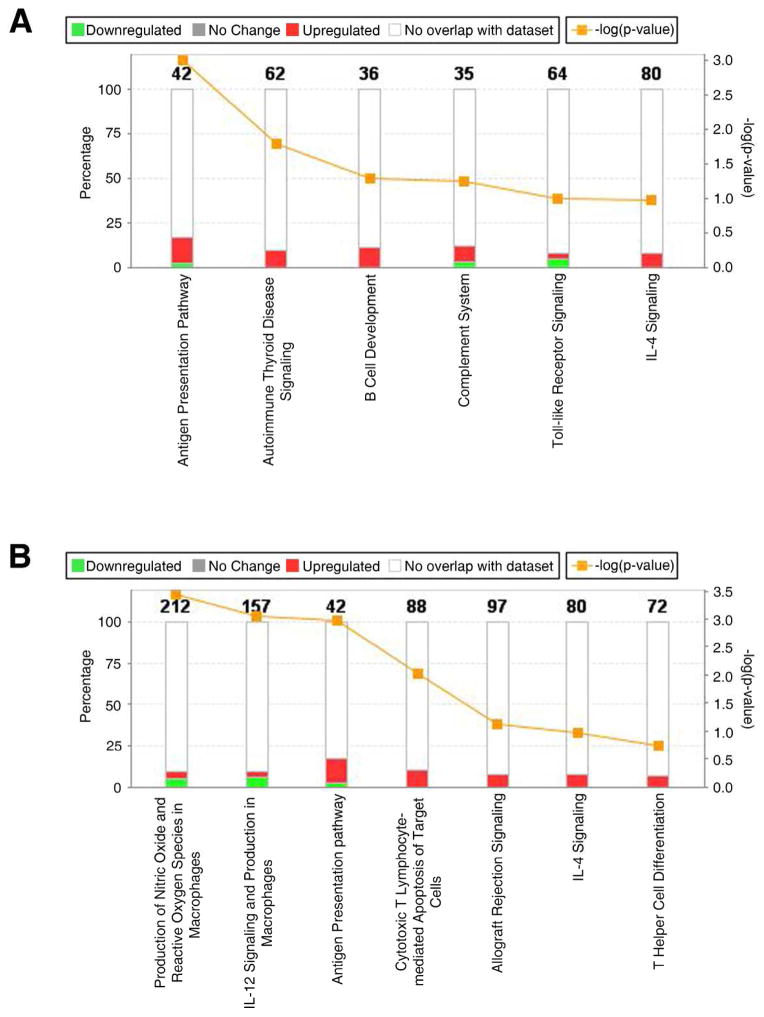
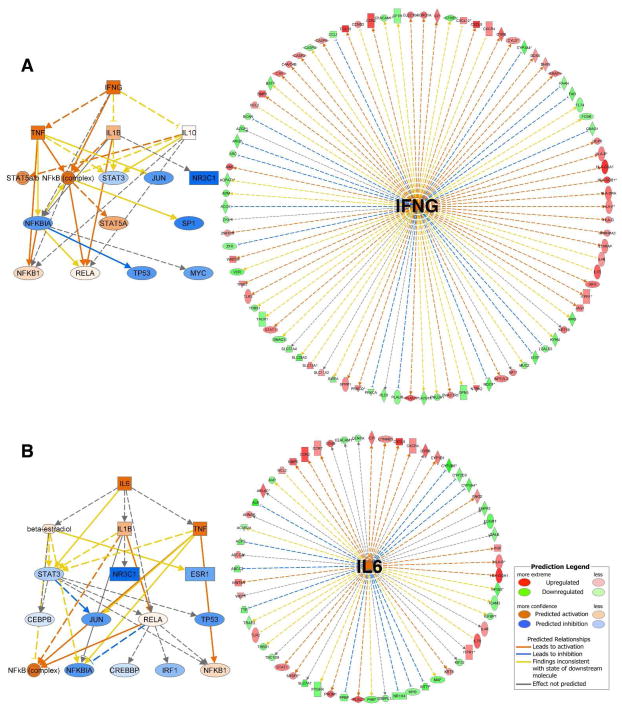
Tacrolimus and sirolimus are commonly used maintenance immunosuppressants in kidney transplantation. As their effects on immune cells and allograft molecular profiles have not been elucidated, we characterized the effects of tacrolimus to sirolimus conversion on the frequency and function of T cells, and on graft molecular profiles. Samples from renal transplant patients in a randomized trial of 18 patients with late sirolimus conversion and 12 on tacrolimus maintenance were utilized. Peripheral blood was collected at 0, 6, 12, and 24 months post randomization, with T-cell subpopulations analyzed by flow cytometry and T-cell alloreactivity tested by IFN-γ ELISPOT. Graft biopsy samples obtained 24 months post randomization were used for gene expression analysis. Sirolimus conversion led to an increase in CD4(+)25(+++)Foxp3(+) regulatory T cells. While tacrolimus-maintained patients showed a decrease in indirect alloreactivity over time post transplant, sirolimus conversion increased indirect alloreactive T-cell frequencies compared with tacrolimus-maintained patients. No histological differences were found in graft biopsies, but molecular profiles showed activation of the antigen presentation, IL-12 signaling, oxidative stress, macrophage-derived production pathways, and increased inflammatory and immune response in sirolimus-converted patients. Thus, chronic immune alterations are induced after sirolimus conversion. Despite the molecular profile being favorable to calcineurin inhibitor-based regimen, there was no impact in renal function over 30 months of follow-up.


Conflict of interest statement

DISCLOSURE

The authors do not have any conflicts of interest to disclose.

Figures

Figure 1
Figure 1
Estimated glomerular filtration rate according to treatment groups: TAC maintained vs. SRL converted group. GFR, Glomerular filtration rate; TAC, Tacrolimus maintained group; SRL Sirolimus converted group; Tx, transplant.
Figure 2
Figure 2
(A) Frequencies of regulatory T cells (CD4+CD25+++FOXP3+ T cells) at baseline, 6 months, 12 months and 24 months post-randomization comparing between TAC maintained and SRL converted group shown in absolute number of cells (Mean ± SD) per microliters of PBMC (Left panel) or percentage of cells (Mean ± SD) within the CD4 T cells (Right panel). (B) Gating strategy and median fluorescent intensity of FOXP3 in CD4+CD25+++FOXP3+ T cells at baseline, 6 months, 12 months and 24 months post-randomization comparing between TAC maintained and SRL converted group. TAC, Tacrolimus maintained group; SRL Sirolimus converted group; Tregs, regulatory T cells; PBMC. Peripheral Blood Mononuclear Cell; MFI, median fluorescent intensity.
Figure 3
Figure 3
Percentage of CD3 T cells, CD4 T cells, CD8 T cells, effector CD4 T cells (CD4+CD25), naïve CD4 T cells (CD4+CD45RA+), memory CD4 T cells (CD4+CD45RO+), naïve CD8 T cells (CD8+CD45RA+) and memory CD8 T cells (CD8+CD45RO+) in PBMC (Mean ± SD) at baseline, 6 months, 12 months and 24 months post-randomization comparing between TAC maintained and SRL converted group. SRL conversion did not result in changes of these T cell subpopulations. TAC, Tacrolimus maintained group; SRL Sirolimus converted group.
Figure 4
Figure 4
Direct and indirect donor T cell alloreactivity measured by IFN-γ ELISPOT at baseline, 6 months and 12 months post-randomization comparing between TAC maintained and SRL converted group. (A) IFN-γ production by PBMC incubated with PHA shows that cell viability was excellent in both groups. (B) IFN-γ production by PBMC incubated with irradiated donor cells showed no difference in direct T cell alloreactivity at 6- and 12-months. (p=0.082 for interaction group*time). (C and D) Indirect T cell alloreactivity, as measured by incubating PBMC either with a donors’ cell membrane preparation or donors’ HLA mismatched synthetic peptides, increased significantly over time in SRL group (p=0.009 and p=0.001 for interaction group*time, respectively). Results are expressed as mean ± SE for log-transformed ELISPOT counts. Analysis was performed using generalized estimating equations.
Figure 5
Figure 5
Top canonical immunological pathways identified among differentially expressed genes between SRL and TAC groups. (A) Humoral mediated immune response, (B) Cellular mediated immune response. The Canonical Pathways that are involved in this analysis are displayed along the x-axis. As the default the y-axis displays the −log of p-value which is calculated by Fisher’s exact test right-tailed. The orange points represent Ratio. The ratio is calculated as follows: # of genes in a given pathway that meet cutoff criteria, divided by total # of genes that make up that pathway.
Figure 6
Figure 6
Mechanistic networks for the 2 top significant upstream regulators identified as activated in SRL converted patients. The two panel picture represents predicted activity of downstream cascades regulated by (A) Left panel: Interferon gamma (IFNγ) and (B) Left panel: Interleukin-6 (IL6). Mechanistic networks enable to discover plausible sets of connected upstream regulators that can work together to elicit the gene expression changes observed in our dataset to discover plausible sets of connected upstream regulators that can work together to elicit the gene expression changes observed in a dataset. (A and B) right panels: Network generated by IPA from the 2 top predicted upstream regulators and target genes present of differentially expressed genes when comparing SRL to TAC samples. Upstream Regulator Analysis is based on expected causal effects between Upstream regulators and targets; the expected causal effects are derived from the literature compiled in the Ingenuity® Knowledge Base. The analysis examined the known targets of each upstream regulator in our dataset, compares the targets’ actual direction of change to expectations derived from the literature, then issues a prediction for each upstream regulator.

References

    1. Meier-Kriesche HU, Schold JD, Srinivas TR, et al. Lack of improvement in renal allograft survival despite a marked decrease in acute rejection rates over the most recent era. American journal of transplantation : official journal of the American Society of Transplantation and the American Society of Transplant Surgeons. 2004;4:378–383. - PubMed
    1. Grinyo JM, Bestard O, Torras J, et al. Optimal immunosuppression to prevent chronic allograft dysfunction. Kidney Int Suppl. 2010:S66–70. - PubMed
    1. Chhabra D, Skaro AI, Leventhal JR, et al. Long-term kidney allograft function and survival in prednisone-free regimens: tacrolimus/mycophenolate mofetil versus tacrolimus/sirolimus. Clin J Am Soc Nephrol. 2012;7:504–512. - PMC - PubMed
    1. Mannon RB. Therapeutic targets in the treatment of allograft fibrosis. American journal of transplantation : official journal of the American Society of Transplantation and the American Society of Transplant Surgeons. 2006;6:867–875. - PubMed
    1. Racusen LC, Solez K, Colvin RB, et al. The Banff 97 working classification of renal allograft pathology. Kidney Int. 1999;55:713–723. - PubMed

Publication types

MeSH terms