Observational Study
. 2015 Mar;87(3):564-74.
doi: 10.1038/ki.2014.346. Epub 2014 Oct 29.

A reassessment of soluble urokinase-type plasminogen activator receptor in glomerular disease

Collaborators, Affiliations
Observational Study

A reassessment of soluble urokinase-type plasminogen activator receptor in glomerular disease

Joann M Spinale et al. Kidney Int. 2015 Mar.

Abstract

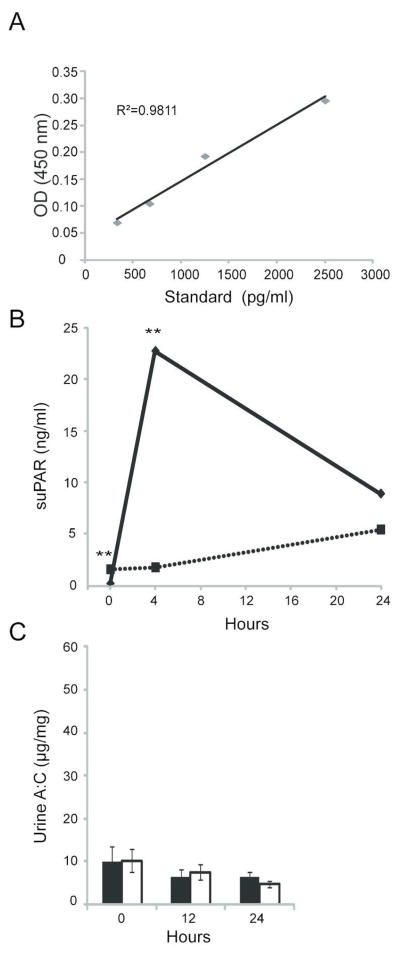
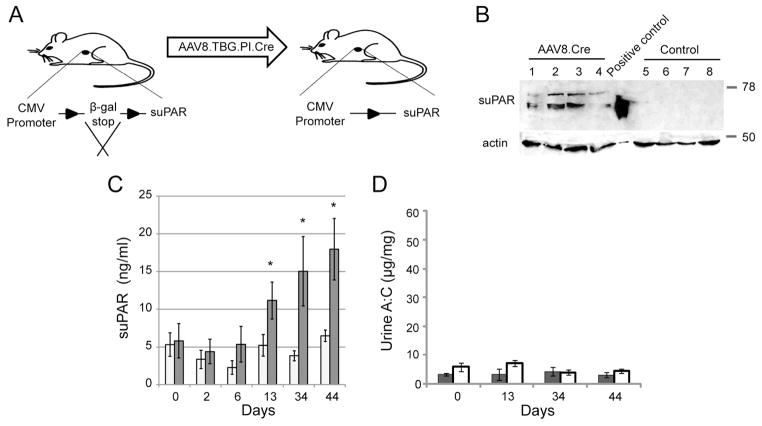
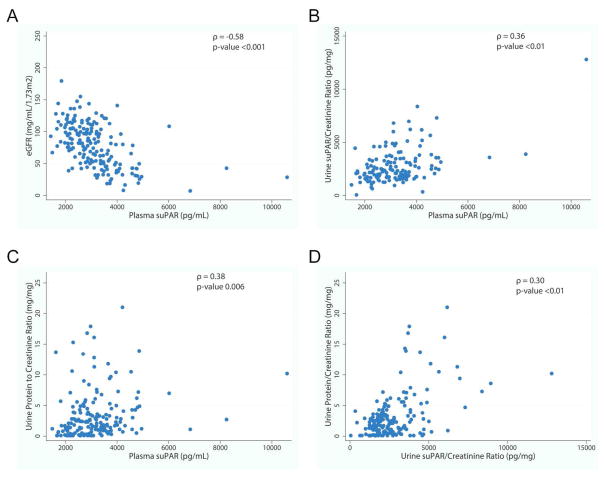
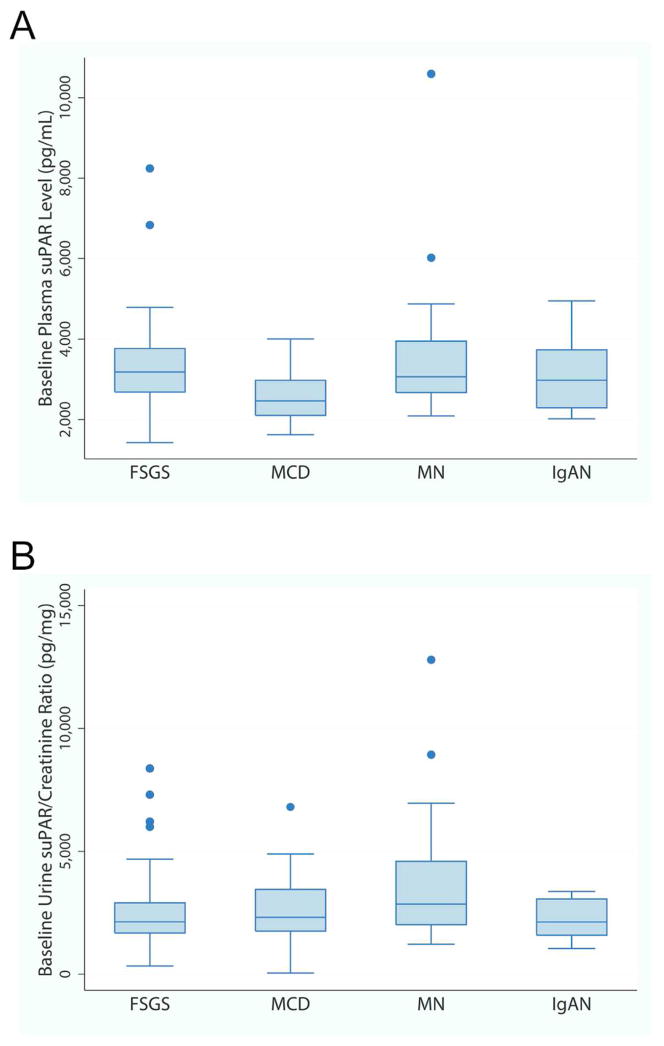
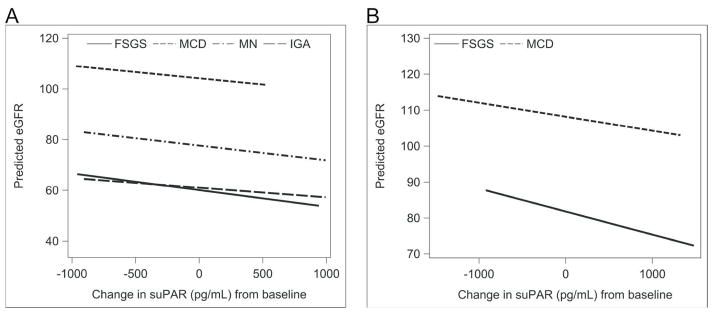
It has been suggested that soluble urokinase receptor (suPAR) is a causative circulating factor for and a biomarker of focal and segmental glomerulosclerosis (FSGS). Here we undertook validation of these assumptions in both mouse and human models. Injection of recombinant suPAR in wild-type mice did not induce proteinuria within 24 h. Moreover, a disease phenotype was not seen in an inducible transgenic mouse model that maintained elevated suPAR concentrations for 6 weeks. Plasma and urine suPAR concentrations were evaluated as clinical biomarkers in 241 patients with glomerular disease from the prospective, longitudinal multicenter observational NEPTUNE cohort. The serum suPAR concentration at baseline inversely correlated with estimated glomerular filtration rate (eGFR) and the urine suPAR/creatinine ratio positively correlated with the urine protein/creatinine ratio. After adjusting for eGFR and urine protein, neither the serum nor urine suPAR level was an independent predictor of FSGS histopathology. A multivariable mixed-effects model of longitudinal data evaluated the association between the change in serum suPAR concentration from baseline with eGFR. After adjusting for baseline suPAR concentration, age, gender, proteinuria, and time, the change in suPAR from baseline was associated with eGFR, but this association was not different for patients with FSGS as compared with other diagnoses. Thus these results do not support a pathological role for suPAR in FSGS.


Conflict of interest statement

Disclosure

The authors have no financial relationship with companies that might have interest in the information contained in this manuscript.

Figures

Figure 1
Figure 1. Injection of mice with recombinant suPAR protein does not induce proteinuria
A) A mouse suPAR ELISA standard curve was generated by adding indicated amounts of purified recombinant Fc-suPAR protein to serum from Plaur −/− mice diluted 1:4. B) Serum suPAR concentration concentration at indicated time points following injection of purified recombinant suPAR protein was estimated using ELISA. Experimental mice (n=5) injected with recombinant protein (solid line) were compared to control mice (n=4) injected with PBS (dashed line). C) Urine albumin and creatinine ratios were calculated at 12 h and 24 h post-Fc-suPAR injection; control (white columns), experimental (gray columns) group. All values are expressed as mean ± standard error of the mean. ** p <0.01, * p <0.05, comparing experimental to control groups at each time point.
Figure 2
Figure 2. Chronic suPAR expression does not induce proteinuria in transgenic mice
Transgenic expression of recombinant suPAR from liver was induced following intravenous injection of AAV8.TBG.PI.Cre virus as described in text. A) Schematic representation of protocol for conditional induction of recombinant suPAR. B) Western blot analysis using polyclonal uPAR antibody demonstrates induced expression of suPAR in liver of experimental (1–4) versus control (5–8) mice. Mouse #5 and mouse #8 were injected with AAV8.LacZ virus while mouse #6 and #7 received PBS. C) Mean serum suPAR concentration over a period of 44 days in the AAV8.TBG.PI.Cre-injected (white columns; n=8) and combined PBS and AAV8.LacZ control-injected (gray columns; n=9) mice assayed using mouse suPAR ELISA. D) Urine albumin/creatinine ratios of AAV8.TBG.PI.Cre-injected (gray columns) and control (white columns) mice for the indicated time points. All values are expressed as mean ± standard error of the mean. * p <0.05, comparing experimental to control groups at each time point.
Figure 3
Figure 3. Correlates of Baseline Plasma and Urine suPAR
A) Plasma suPAR (pg/mL) concentration was negatively correlated with eGFR (ρ = −0.58, p-value <0.001). B) Urine suPAR/creatinine ratio and plasma suPAR concentrations were positively correlated (ρ = 0.36, p-value <0.01). C) Plasma suPAR (pg/mL) was positively correlated with UPCR (ρ = 0.38, p-value 0.006). D) Urine suPAR/creatinine ratio (pg/mg) was positively correlated with urine protein/creatinine ratio (mg/mg) (ρ = 0.30, p-value <0.01).
Figure 4
Figure 4. Baseline Plasma and Urine suPAR concentrations by pathologic diagnosis
A) Baseline plasma suPAR concentration from 183 NEPTUNE participants is plotted by diagnosis. Although MCD participants had a statistically significantly lower median plasma suPAR concentration as compared to all other groups (p-value <0.01), this difference did not persist after adjustment for differences in eGFR. B) Baseline urine suPAR/creatinine ratio from a 24 hour urine specimen in 173 NEPTUNE participants is plotted by diagnosis. Although MN participants had a statistically significantly greater median urine suPAR/creatinine ratio as compared to FSGS and IgAN (p-value 0.01 and 0.02, respectively), this difference did not persist after adjustment for differences in baseline urine protein.
Figure 5
Figure 5. Predicted eGFR values by Change in suPAR from baseline
Median values for each covariate (age, follow-up time, baseline urine protein and baseline suPAR) were used in the linear mixed effects model to generate the predicted line for each histologic cohort. The graph was restricted to overlapping regions of observed values of change in suPAR. Difference in slope as compared to FSGS was not significant in either adult (MCD p-value 0.74, MN p-value 0.78, IgAN p-value 0.35) or pediatric participants (MCD, p-value 0.79).

References

    1. Thuno M, Macho B, Eugen-Olsen J. suPAR: the molecular crystal ball. Dis Markers. 2009;27:157–172. - PMC - PubMed
    1. Wei C, El Hindi S, Li J, et al. Circulating urokinase receptor as a cause of focal segmental glomerulosclerosis. Nat Med. 2011;17:952–960. - PMC - PubMed
    1. Blasi F, Sidenius N. The urokinase receptor: focused cell surface proteolysis, cell adhesion and signaling. FEBS Lett. 2010;584:1923–1930. - PubMed
    1. Smith HW, Marshall CJ. Regulation of cell signalling by uPAR. Nat Rev Mol Cell Biol. 2010;11:23–36. - PubMed
    1. Holst-Hansen C, Hamers MJ, Johannessen BE, et al. Soluble urokinase receptor released from human carcinoma cells: a plasma parameter for xenograft tumour studies. Br J Cancer. 1999;81:203–211. - PMC - PubMed

Publication types

MeSH terms