. 2014 Oct 29;34(44):14783-92.
doi: 10.1523/JNEUROSCI.2039-14.2014.

Distinct roles for alpha- and beta-band oscillations during mental simulation of goal-directed actions

Affiliations

Distinct roles for alpha- and beta-band oscillations during mental simulation of goal-directed actions

Loek Brinkman et al. J Neurosci. .

Abstract

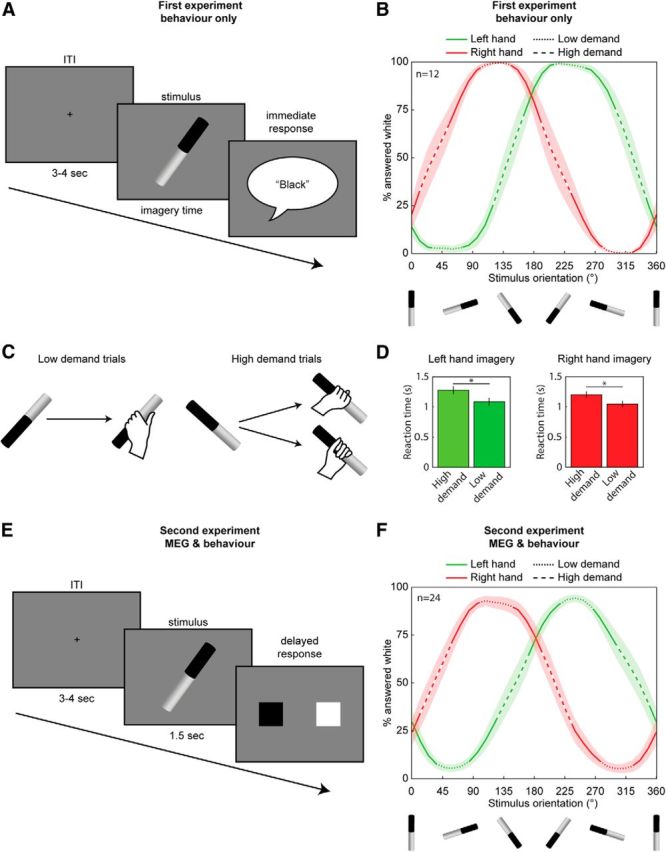
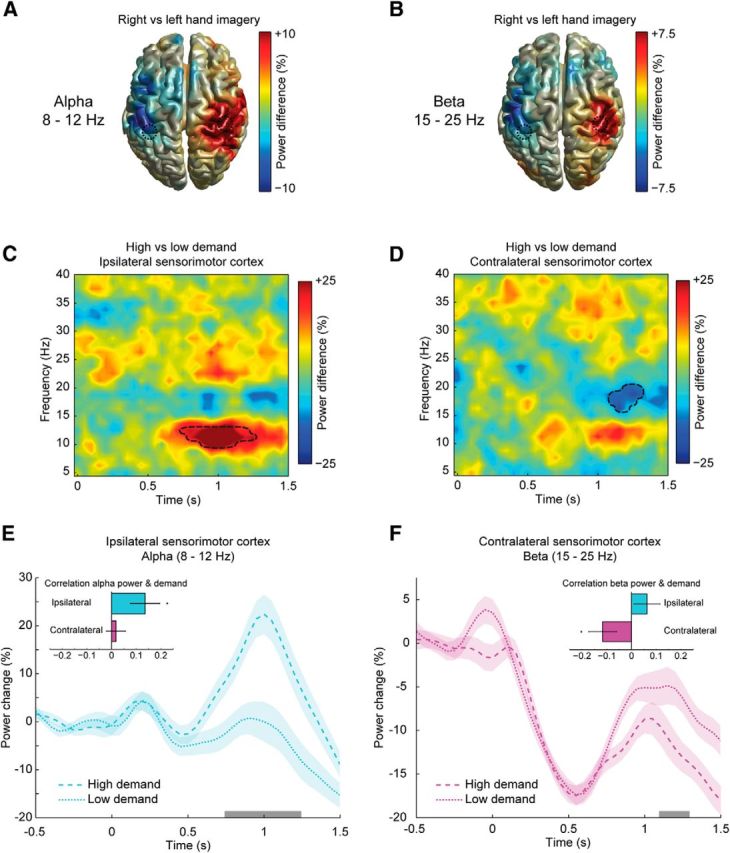
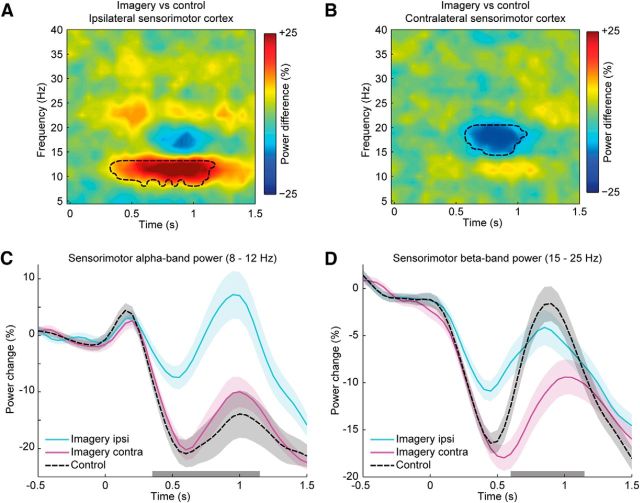
Rhythmic neural activity within the alpha (8-12 Hz) and beta (15-25 Hz) frequency bands is modulated during actual and imagined movements. Changes in these rhythms provide a mechanism to select relevant neuronal populations, although the relative contributions of these rhythms remain unclear. Here we use MEG to investigate changes in oscillatory power while healthy human participants imagined grasping a cylinder oriented at different angles. This paradigm allowed us to study the neural signals involved in the simulation of a movement in the absence of signals related to motor execution and sensory reafference. Movement selection demands were manipulated by exploiting the fact that some object orientations evoke consistent grasping movements, whereas others are compatible with both overhand and underhand grasping. By modulating task demands, we show a functional dissociation of the alpha- and beta-band rhythms. As movement selection demands increased, alpha-band oscillatory power increased in the sensorimotor cortex ipsilateral to the arm used for imagery, whereas beta-band power concurrently decreased in the contralateral sensorimotor cortex. The same pattern emerged when motor imagery trials were compared with a control condition, providing converging evidence for the functional dissociation of the two rhythms. These observations call for a re-evaluation of the role of sensorimotor rhythms. We propose that neural oscillations in the alpha-band mediate the allocation of computational resources by disengaging task-irrelevant cortical regions. In contrast, the reduction of neural oscillations in the beta-band is directly related to the disinhibition of neuronal populations involved in the computations of movement parameters.

Keywords: efference copy; magnetoencephalography; motor imagery; motor plan; movement preparation; sensorimotor cortex.


Figures

Figure 1.
Figure 1.
Task design and behavioral performance. A, In the first experiment, participants performed a reaction time version of the motor imagery task. Each trial started with a fixation cross (ITI, intertrial interval), followed by an image of a tilted cylinder. Participants imagined whole-hand prehension of the cylinder with either the left or right hand (blocked). As soon as participants finished imagining the grasping movement, they reported whether their thumb was on the black or the white part of the cylinder by saying out loud either black or white. Some stimulus orientations afforded two ways in which the cylinder could be grasped, which were more demanding in terms of selecting an action plan, compared with orientations that afforded only one grip (C). B, Percentage of trials in which participants reported to have imagined grasping the cylinder with their thumb on the white part, as a function of cylinder orientations, during trials involving the left and the right hand (green and red curves, respectively). The dashed segments of the lines indicate the regimes of stimulus orientations of high- and low-demand trials. Shaded areas indicate ± 1 SE. High-demand trials were consistently associated with longer reaction times (D; mean reaction time ± 0.5 SE of the difference between conditions; *p < 0.0005, paired-sample t test). E, In the second experiment, participants performed a delayed-response version of the motor imagery task. After 1.5 s the cylinder was replaced with a response screen containing a black and a white square in pseudorandomized order. The overall pattern of the responses in the delayed-response version of the task was very similar to that of the reaction time version of the task (B, F).
Figure 2.
Figure 2.
A, B, Source-reconstructed distribution of differential power changes between 600 and 1000 ms after stimulus presentation between motor imagery trials involving the right or left hand are shown for the alpha- and beta-band frequency, respectively. C, D, Dashed circles indicate the location of the voxels that were selected for subsequent analyses. The TFRs show the differential power changes measured during motor imagery with high and low movement selection demands. At the sensorimotor cortex ipsilateral to the hand that was used for imagery, there was a relative increase in alpha-band power in motor imagery trials with high selection demands compared with motor imagery trials with low selection demands (C). The sensorimotor cortex contralateral to the hand that was used for imagery showed a relative decrease in beta-band power (D). Black dashed lines mark the time-frequency boundaries of significant clusters. The line plots illustrate the temporal dynamics of the baseline-corrected power changes during motor imagery trials in the sensorimotor cortex ipsilateral (E) or contralateral (F) to the hand used for imagery. The gray bars along the x-axes indicate the time interval of the clusters shown in C and D. Shaded areas indicate ± 0.5 SE of the difference between conditions. The insets of E and F show the average Pearson correlation coefficients between task demand and alpha- and beta-band power, respectively (error bars represent ± 1 SE, *p < 0.025, one-sided t test).
Figure 3.
Figure 3.
A, B, Source-reconstructed TFRs of differential power changes between imagery and control tasks are shown for the ipsilateral (A) and contralateral sensorimotor cortices (B). At the sensorimotor cortex ipsilateral to the hand that was used for imagery, there was a relative increase in alpha-band power in the motor imagery condition compared with the control condition (A). The sensorimotor cortex contralateral to the hand that was used for imagery showed a relative decrease in beta-band power (B). Black dashed lines mark the time-frequency boundaries of significant clusters. C, D, The line plots illustrate baseline-corrected power changes of alpha- and beta-band power measured over sensorimotor cortices during imagery and control trials. The line plots distinguish between power changes evoked in the sensorimotor cortex ipsilateral (“imagery ipsi”) and contralateral (“imagery contra”) to the imagined hand. The black dashed lines indicate the spectral power during the control condition (averaged over left and right sensorimotor cortices). The gray bars along the x-axes indicate the time intervals of the clusters shown in A and B. Shaded areas indicate ± 0.5 SE of the differences between imagery and control trials.

References

    1. Anderson KL, Ding M. Attentional modulation of the somatosensory mu rhythm. Neuroscience. 2011;180:165–180. doi: 10.1016/j.neuroscience.2011.02.004. - DOI - PubMed
    1. Bauer M, Kennett S, Driver J. Attentional selection of location and modality in vision and touch modulates low-frequency activity in associated sensory cortices. J Neurophysiol. 2012;107:2342–2351. doi: 10.1152/jn.00973.2011. - DOI - PMC - PubMed
    1. Brown P. Cortical drives to human muscle: the piper and related rhythms. Prog Neurobiol. 2000;60:97–108. doi: 10.1016/S0301-0082(99)00029-5. - DOI - PubMed
    1. Brown P. Abnormal oscillatory synchronisation in the motor system leads to impaired movement. Curr Opin Neurobiol. 2007;17:656–664. doi: 10.1016/j.conb.2007.12.001. - DOI - PubMed
    1. Carlqvist H, Nikulin VV, Strömberg JO, Brismar T. Amplitude and phase relationship between alpha and beta oscillations in the human electroencephalogram. Med Biol Eng Comput. 2005;43:599–607. doi: 10.1007/BF02351033. - DOI - PubMed

Publication types

LinkOut - more resources