. 2014 Dec 19;289(51):35182-92.
doi: 10.1074/jbc.M114.580159. Epub 2014 Oct 29.

Depletion of the central metabolite NAD leads to oncosis-mediated cell death

Affiliations

Depletion of the central metabolite NAD leads to oncosis-mediated cell death

Christopher Del Nagro et al. J Biol Chem. .

Abstract

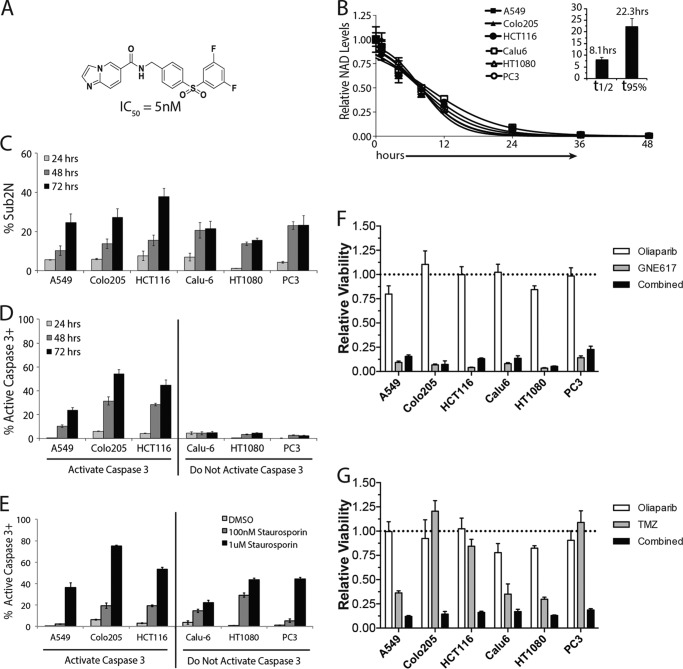
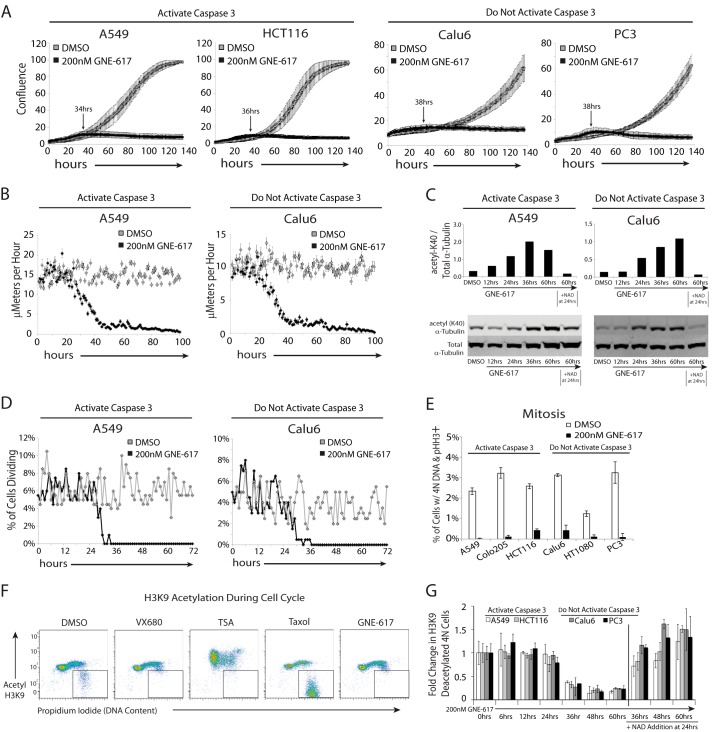
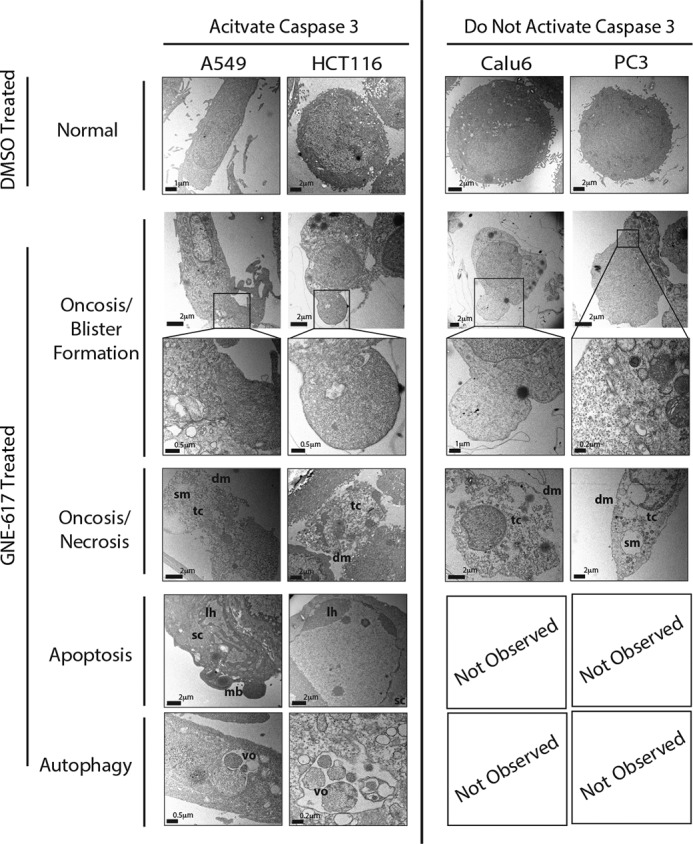
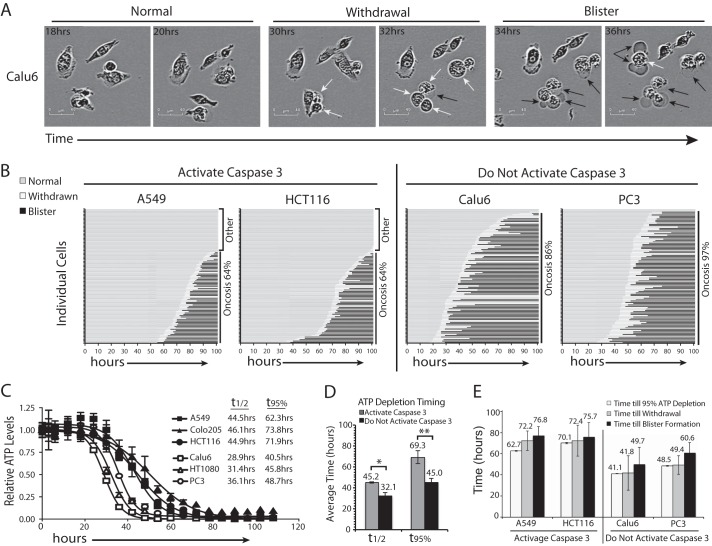
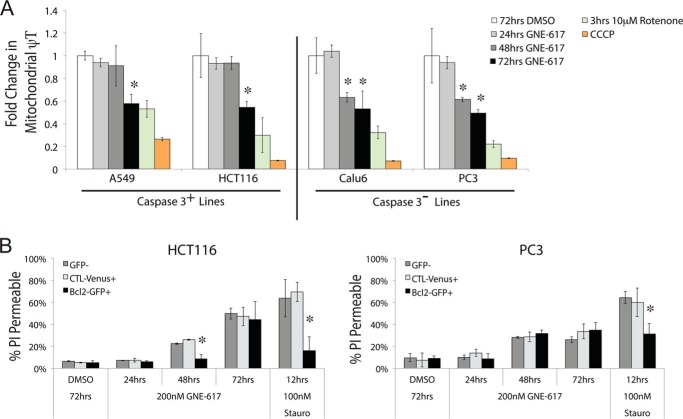
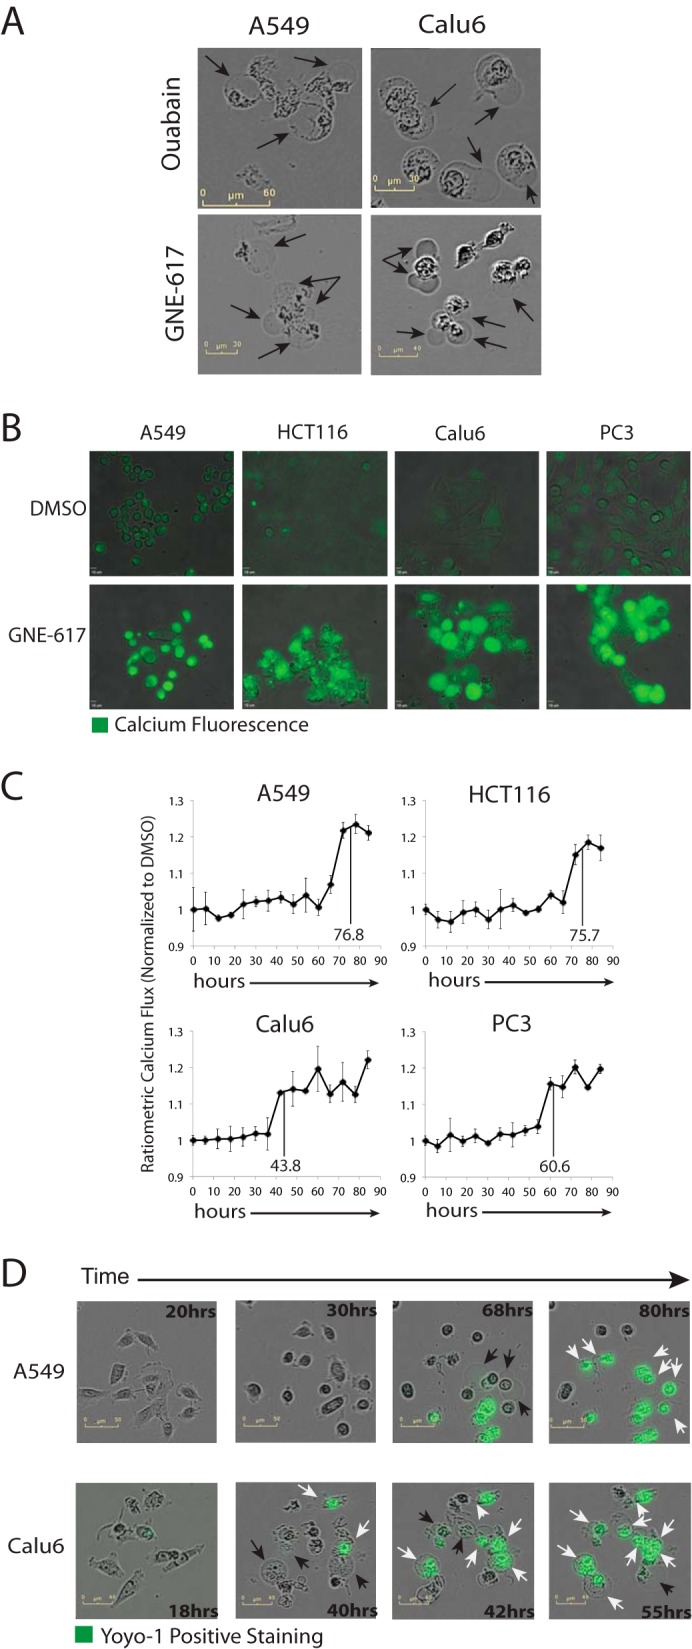
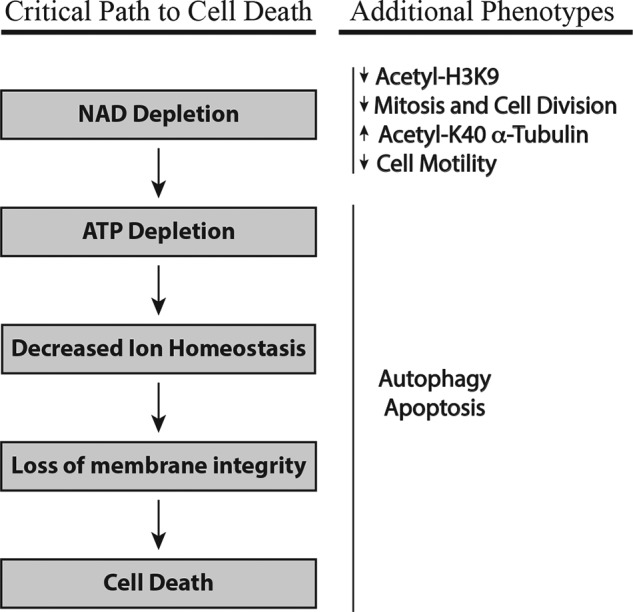
Depletion of the central metabolite NAD in cells results in broad metabolic defects leading to cell death and is a proposed novel therapeutic strategy in oncology. There is, however, a limited understanding of the underlying mechanisms that connect disruption of this central metabolite with cell death. Here we utilize GNE-617, a small molecule inhibitor of NAMPT, a rate-limiting enzyme required for NAD generation, to probe the pathways leading to cell death following NAD depletion. In all cell lines examined, NAD was rapidly depleted (average t½ of 8.1 h) following NAMPT inhibition. Concurrent with NAD depletion, there was a decrease in both cell proliferation and motility, which we attribute to reduced activity of NAD-dependent deacetylases because cells fail to deacetylate α-tubulin-K40 and histone H3-K9. Following depletion of NAD by >95%, cells lose the ability to regenerate ATP. Cell lines with a slower rate of ATP depletion (average t½ of 45 h) activate caspase-3 and show evidence of apoptosis and autophagy, whereas cell lines with rapid depletion ATP (average t½ of 32 h) do not activate caspase-3 or show signs of apoptosis or autophagy. However, the predominant form of cell death in all lines is oncosis, which is driven by the loss of plasma membrane homeostasis once ATP levels are depleted by >20-fold. Thus, our work illustrates the sequence of events that occurs in cells following depletion of a key metabolite and reveals that cell death caused by a loss of NAD is primarily driven by the inability of cells to regenerate ATP.

Keywords: ATP; Apoptosis; Cell Death; Cell Metabolism; GNE-617; NAMPT; Nicotinamide Adenine Dinucleotide (NAD); Oncosis.


Figures

FIGURE 1.
FIGURE 1.
GNE-617 rapidly reduces NAD and induces cell death across multiple cell lines. A, structure of GNE-617 and its associated IC50 for purified human NAMPT. B, cells were exposed to 200 nm GNE-617 for the indicated times, and NAD levels were quantified by LC-MS/MS (average ± S.D., n = 3). The mean half-time (t½) and time to 95% depletion (t95%) for NAD depletion are shown in the inset (average ± S.D.). C and D, cell death (C, percentage of cells with sub-2N DNA content) and caspase-3 activation (D, percentage of cells staining positive for active caspase-3) were assessed by intracellular flow cytometry staining (average ± S.D., n = 3) after treatment of cells with 200 nm GNE-617 for 24, 48, or 72 h. E, all cell lines have the ability to activate caspase-3. Shown is the percentage of cells staining positive for intracellular active caspase-3 by intracellular flow cytometry assessed after treatment with 0.1 or 1 μm staurosporin for 12 h (average ± S.D., n = 3). F, cells were incubated either with GNE-617 (166 nm), olaparib (1.25 μm), or both for 96 h, and cell viability was assessed using a CyQuant assay. The resulting viability for each cell line is show relative to its DMSO control (average ± S.D., n = 3). G, the PARP inhibitor olaparib enhances the activity of temozolomide (TMZ) in the indicated cell lines. The cells were incubated either with olaparib (1.25 μm), temozolomide (250 μm), or both for 96 h, and cell viability was assessed using a CyQuant assay. The resulting viability for each cell line is shown relative to its DMSO control (average ± S.D., n = 3).
FIGURE 2.
FIGURE 2.
NAD depletion results in broad defects in cell motility and division. A, the indicated cell lines were grown for 138 h ± GNE-617 (200 nm), and cell growth (average confluence) was tracked by live cell imaging (average ± S.D., n = 36 fields of view). The indicated time is the time until maximum confluence for each cell line treated with GNE-617. B, cell motility for A549 and Calu6 cells was measured by tracking the movement of 100 cells over 102 h after treatment with either DMSO or 200 nm GNE-617 using ImageJ/MTrackJ tracking software (average ± S.E., n = 100). C, A549 or Calu6 cells exposed to GNE-617 (200 nm) for various times increased acetylation of α-tubulin-K40 as measured by immunoblot analysis (upper panels show quantification of the bands in the lower immunoblots). The addition of 10 μm NAD at 24 h attenuates this increase in acetylation. D, A549 or Calu6 cells were exposed to DMSO or GNE-617 (200 nm) for 72 h, and in each case 200 cells were tracked over time, and the percentage of cells undergoing cell division is shown. E, each cell line was exposed to DMSO or GNE-617 (200 nm) for 36 h, and the mitotic index was determined by intracellular flow staining to detect phosphorylated histone H3 (Ser10)-positive cells (average ± S.D., n = 3). F, the level of acetyl-histone H3-K9 or DNA (propidium iodide) in HCT116 cells was assessed by intracellular staining after 36 h of exposure to DMSO or 200 nm GNE-617 or after 12 h with either 1 μm VX680, 1 μm trichostatin A (TSA), or 10 μm taxol. G, the level of deacetylated histone H3-K9 and 4 n DNA content (as gated in F) in cells was quantified at various times after the addition of GNE-617 (200 nm) (average ± S.D., n = 3) and after the addition of 10 μm NAD at 24 h.
FIGURE 3.
FIGURE 3.
Transmission electron microscopy detects multiple morphological changes associated with NAD depletion. Caspase-3-positive (A549 and HCT116) and capase-3-negative (Calu6 and PC3) cell lines show evidence of oncosis (cell blisters) and necrotic features (translucent cytoplasm (tc), disintegrated plasma membrane (dm), and swollen nuclear/endoplasmic reticulum membranes (sm)) after exposure to GNE617 (200 nm) for 72 h. Apoptotic (smooth dense cytoplasm (sc), lateralized heterochromatin (lh), and membrane budding (mb)) and autophagic (vacuole encapsulated organelles (vo)) phenotypes were seen only in caspase-3-positive lines (A549 and HCT116).
FIGURE 4.
FIGURE 4.
Timing of cell death following NAD depletion. A, representative images of Calu6 cells following treatment with GNE-617 (200 nm) at the indicated times. The withdrawal of membrane extensions (white arrows) is followed by the formation of cell blisters (black arrows). B, for each cell line, 100 individual cells were tracked hourly for 102 h, and the timing of withdrawal of membrane protrusions and formation of blisters are indicated on the graphs. C, cells were exposed to GNE-617 (200 nm) for the indicated times, and ATP levels were determined by CelltiterGlo (average ± S.D., n = 3). D, the average time to depletion of 50% or 95% ATP for cell lines that activate caspase-3 (A549, Colo205, and HCT116) and cell lines that do not activate caspase-3 (Calu6, HT1080 and PC3) was determined. *, p value of <0.025; **, p value of <0.005. E, the average time for cells to display 95% ATP depletion (average ± S.D., n = 3), withdrawal of membrane extensions, and formation of cell blisters are indicated (average ± S.D., n = 100).
FIGURE 5.
FIGURE 5.
Cell death following NAD depletion is not driven by apoptosis. A, the fold change in mitochondrial membrane potential for the indicated cell lines is shown following various treatments. Cells were treated with either GNE-617 (200 nm) for 24, 48, or 72 h; 10 μm rotenone for 3 h; or 50 μm carbonyl cyanide m-chlorophenylhydrazone (CCCP) at the end of the assay (average ± S.D., n = 3). B, HCT116 or PC3 cells were exposed to either DMSO for 72 h; GNE-617 (200 nm) for 24, 48, or 72 h; or 100 nm staurosporin for 12 h (average ± S.D., n = 3). The graph indicates the percentage of BCL2-GFP-positive cells, GFP-negative cells (in the same well), or control vector (VENUS-green) expressing cells that are propidium iodide-positive. *, p value < 0.05.
FIGURE 6.
FIGURE 6.
Cell death coincides with loss of Ca2+ homeostasis and plasma membrane integrity. A, disruption of plasma membrane homeostasis with the Na+/K+-ATPase inhibitor ouabain (10 μm for 8 h) induces similar cell blisters (black arrows) as observed following a 72-h exposure to GNE-617. B, representative images of the indicated cell lines stained with Fluo-4 am after treatment with either DMSO or 200 nm GNE-617 for 72 h. C, time-dependent changes in intracellular calcium levels in the indicated cell lines after treatment with GNE-617 (200 nm) relative to control cells (average ± S.D., n = 3). Vertical lines show the average time to the appearance of cell blisters (see Fig. 4E). D, representative images of A549 and Calu6 cells at the indicated times following treatment with GNE-617 (200 nm) in the presence of the green fluorescence yoyo-1 stain. Cells with blisters that are yoyo-1-negative are indicated with black arrows, whereas cells with blisters that are yoyo-1-positive are indicated with white arrows.
FIGURE 7.
FIGURE 7.
Sequence of events lead to cell death following NAD depletion. Shown are the critical events that directly lead to cell death and the additional phenotypes that are observed during this process. See text for details.

References

    1. Bogan K. L., Brenner C. (2008) Nicotinic acid nicotinamide and nicotinamide riboside: a molecular evaluation of NAD+ precursor vitamins in human nutrition. Annu. Rev. Nutr. 28, 115–130 - PubMed
    1. Hasmann M., Schemainda I. (2003) FK866, a highly specific noncompetitive inhibitor of nicotinamide phosphoribosyltransferase, represents a novel mechanism for induction of tumor cell apoptosis. Cancer Res. 63, 7436–7442 - PubMed
    1. Olesen U. H., Christensen M. K., Björkling F., Jäättelä M., Jensen P. B., Sehested M., Nielsen S. J. (2008) Anticancer agent CHS-828 inhibits cellular synthesis of NAD. Biochem. Biophys. Res. Commun. 367, 799–804 - PubMed
    1. Watson M., Roulston A., Bélec L., Billot X., Marcellus R., Bédard D., Bernier C., Branchaud S., Chan H., Dairi K., Gilbert K., Goulet D., Gratton M. O., Isakau H., Jang A., Khadir A., Koch E., Lavoie M., Lawless M., Nguyen M., Paquette D., Turcotte E., Berger A., Mitchell M., Shore G. C., Beauparlant P. (2009) The small molecule GMX1778 is a potent inhibitor of NAD+ biosynthesis: strategy for enhanced therapy in nicotinic acid phosphoribosyltransferase 1-deficient tumors. Mol. Cell. Biol. 29, 5872–5888 - PMC - PubMed
    1. Xiao Y., Elkins K., Durieux J. K., Lee L., Oeh J., Yang L. X., Liang X., DelNagro C., Tremayne J., Kwong M., Liederer B. M., Jackson P. K., Belmont L. D., Sampath D., O'Brien T. (2013) Dependence of tumor cell lines and patient derived tumors on the NAD salvage pathway renders them sensitive to NAMPT inhibition with GNE-618. Neoplasia 15, 1151–1160 - PMC - PubMed

MeSH terms