. 2014 Dec 19;289(51):35542-60.
doi: 10.1074/jbc.M114.592287. Epub 2014 Oct 29.

Yeast 14-3-3 protein functions as a comodulator of transcription by inhibiting coactivator functions

Affiliations

Yeast 14-3-3 protein functions as a comodulator of transcription by inhibiting coactivator functions

Pabitra K Parua et al. J Biol Chem. .

Abstract

In eukaryotes combinatorial activation of transcription is an important component of gene regulation. In the budding yeast Saccharomyces cerevisiae, Adr1-Cat8 and Adr1-Oaf1/Pip2 are pairs of activators that act together to regulate two diverse sets of genes. Transcription activation of both sets is regulated positively by the yeast AMP-activated protein kinase homolog, Snf1, in response to low glucose or the presence of a non-fermentable carbon source and negatively by two redundant 14-3-3 isoforms, Bmh1 and Bmh2. Bmh regulates the function of these pairs at a post-promoter binding step by direct binding to Adr1. However, how Bmh regulates transcription after activator binding remains unknown. In the present study we analyzed Bmh-mediated regulation of two sets of genes activated independently by these pairs of activators. We report that Bmh inhibits mRNA synthesis when the second activator is absent. Using gene fusions we show that Bmh binding to the Adr1 regulatory domain inhibits an Adr1 activation domain but not a heterologous activation domain or artificially recruited Mediator, consistent with Bmh acting at a step in transcription downstream of activator binding. Bmh inhibits the assembly and the function of a preinitiation complex (PIC). Gene expression studies suggest that Bmh regulates Adr1 activity through the coactivators Mediator and Swi/Snf. Mediator recruitment appeared to occur normally, but PIC formation and function were defective, suggesting that Bmh inhibits a step between Mediator recruitment and PIC activation.

Keywords: 14-3-3 Protein; Adr1; Cat8; Combinatorial Regulation; Gene Regulation; Gene Transcription; Oaf1/Pip2; RNA Polymerase II; Transcription Coactivator.


Figures

FIGURE 1.
FIGURE 1.
Regulation of combinatorial transcription by Bmh. A, expression of various Adr1- and Oaf1/Pip2-activated genes (peroxisome biogenesis and β-oxidation genes) in different S. cerevisiae mutant backgrounds (YLL908 (WT), YLL1087 (bmh1-ts), SRY1 (oaf1Δ), and PPY18 (oaf1Δ bmh1-ts)) in derepressing (0.05% of glucose) and oleate (0.1%) inducing conditions. Oleate induction was done for 1 h. Values were plotted as a percentage of message abundance in wild type cells after normalization them against ACT1 mRNA. B, mRNA analysis was performed in four different S. cerevisiae strains (YLL908 (WT), KBY15 (cat8Δ), KBY20 (cat8Δ bmh1-ts), and YLL1087 (bmh1-ts)) (See also Table 1) grown in low glucose media (0.05%) for 4 h. Values were plotted as a percentage of message abundance in CAT8 BMH1 strains for various Adr1- and Cat8-activated and Cat8 only-activated genes after normalization against ACT1 mRNA. C, observed level of ADH2 and MLS1 (solely Cat8-activated) mRNA after normalization against ACT1 mRNA in four different S. cerevisiae strains (KBY26 (adr1Δ), PPY29 (adr1Δ cat8Δ), PPY27 (adr1Δ cat8Δ bmh1-ts), and KBY30 (adr1Δ bmh1-ts)) in the presence of extrachromosomally expressed Adr1 (pKD16), Adr1c (pKD14-TRP1; Adr1-S230A), or control parental plasmid (pRS314) grown in low glucose medium (0.05%) for 4 h. Error bars represent values obtained from two independent experiment using three biological replicates.
FIGURE 2.
FIGURE 2.
Derepression kinetics of Adr1- and Cat8-activated genes. A–D, mRNA analysis of four genes, ADH2 (A), ACS1 (B), ICL1 (C), and SIP4 (D), after shifting mid-log phase cells into low glucose-containing medium (0.05%) from glucose-containing medium (5.0%). Cells were collected at the indicated times (min) after shift into glucose and processed for total mRNA isolation, cDNA synthesis, and qRT-PCR. Values were plotted after normalization against ACT1 mRNA. Error bars represent values obtained from two independent experiment using three biological replicates.
FIGURE 3.
FIGURE 3.
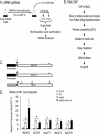
mRNA synthesis rates and pol II-associated nascent transcripts. A, representation of the 4tU labeling experiment. B, schematic chart of the experiment done to isolate and detect the elongating pol II-associated nascent transcript amount. C, schematic diagram of the endogenous genes (ADH2 and ACS1) and chromosomally integrated lacZ ORF under the control of the ADH2 promoter (ADH2p) used to detect the pol II-associated nascent transcript. The numbers and horizontal lines indicate the primer pairs used to amplify the cDNA. D, nascent transcript level of ADH2, ACS1, and lacZ associated with elongating pol II after normalization against the value obtained for the ACT1-nascent transcript in three different mutant yeast (YLL908 (WT), KBY15 (cat8Δ), and KBY20 (cat8Δ bmh1-ts)). WT-R, represents value obtained in wild type cells grown in repressing medium (5.0% glucose). Cells were collected after 4 h of derepression in low glucose (0.05%) medium and processed for RNA ChIP. Error bars represent values obtained from two independent experiment using three biological replicates.
FIGURE 4.
FIGURE 4.
Bmh does not regulate mRNA stability. A, schematic representation of the experiment performed to determine the mRNA stability after shutting off transcription with the addition of 5.0% glucose into the 4-h derepressed (0.05% glucose) S. cerevisiae culture. Sequential 10-ml aliquots of cell culture were collected after 0, 5, 10, 20, and 30 min and processed for mRNA analysis. B, plot shows percentage (%) of stable ADH2 and ACS1 mRNA in two different yeast strains, YLL908 (WT) and YLL1087 (bmh1-ts). Error bars represent values obtained from two independent experiment using three biological replicates.
FIGURE 5.
FIGURE 5.
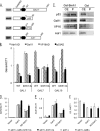
Bmh-mediated regulation is specific for the Adr1 activation domain. A, schematic diagram of GBD fusion hADs (the C-terminal region (residues 797–1081) of yeast Gal11, human p53 (residues 1–92), HSV-encoded transcription activator VP16 (residues 411–490), and Adr1 (residues 260–460). Left panel, represents the level of abundance of the corresponding fusion activator. Results were obtained by Western blotting of the cell extracts with anti-GBD monoclonal antibody (sc-510). B, abundance of GAL mRNAs (GAL1, GAL7, and GAL10) in BMH1 WT and bmh1-ts mutant strains for four different heterologous AD. Values were plotted after normalizion against ACT1 mRNA. C, GST pulldown of four different GBD fusion activators having a Bmh binding region (RD) with glutathione-Sepharose 4B-immobilized GST-Bmh1 or GST. Cell extract (CE) and pellet (P) fractions were electrophoresed on Any kDTM Mini PROTEAN TGX gels (Bio-Rad) followed by visualization of proteins with Western blotting using anti-GBD antibody (sc-510). D–F, ADH2 (D), ACS1 (E), and ICL1 (F) mRNA abundance in four different S. cerevisiae strains (KBY26 (adr1Δ), PPY29 (adr1Δ cat8Δ), PPY27 (adr1Δ cat8Δ bmh1-ts), and KBY30 (adr1Δ bmh1-ts)) harboring a plasmid expressing either the C terminus of Gal11 (residues 797–1081 acids) as an Adr1-DBD fusion protein in the presence and absence of the Bmh-binding region (RD) or an analogous plasmid lacking the RD grown in low glucose (0.05%) medium for 4 h. Values were plotted after normalization against ACT1 mRNA. Error bars represent values obtained from two independent experiment using three biological replicates.
FIGURE 6.
FIGURE 6.
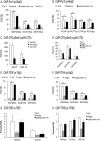
Bmh inhibits PIC formation. A, RNA pol II-ChIP using anti-Rpb3 antibody at the TSS of GAL7 and GAL10 in BMH1 WT strain harboring a plasmid expressing either p53AD (residues 1–92) or VP16AD (residues 411–490) or Adr1AD (residues 260–460) as GBD and Bmh binding region (RD) fusion proteins. B, RNA pol II ChIP using anti-Rpb3 antibody at GAL7 and GAL10 TSS in BMH1 WT (YLL908) and bmh1-ts (YLL1087) strains expressing either Adr1AD or RD-Adr1AD as a GBD fusion protein from the ADH1 promoter (ADH1p). C, ChIP to detect the fusion activator binding at two GAL promoters (GAL7p and GAL10p) in BMH1 WT strain expressing p53AD, VP16AD, or Adr1AD as a GBD-RD fusion protein from the ADH1 promoter (ADH1p) using anti-GBD antibody (sc-577). D, ChIP to detect the fusion activator binding at two GAL promoters (GAL7p and GAL10p) in BMH1 WT and bmh1-ts strains expressing either Adr1AD or RD-Adr1AD as a GBD fusion protein from the ADH1 promoter (ADH1p) using anti GBD antibody (sc-577). Values were plotted after normalizing against telomere region (TEL) amplified using a TEL-specific primer pair (Table 3). Error bars represent values obtained from two independent experiment using three biological replicates. p values (★) range from 0.001 to 0.05.
FIGURE 7.
FIGURE 7.
Bmh inhibits PIC formation. A, ChIP results showing the amount of RNA pol II detected at the TSS of three Adr1- and Cat8-activated genes (ADH2, ACS1, and ADY2) in WT, cat8Δ, and cat8Δ bmh1-ts cells grown in low glucose (0.05%) medium using anti-Rpb3 antibody. B, ChIP results showing the amount of recruited RNA pol II at the TSS of four Adr1- and Oaf1-activated genes in WT, oaf1Δ, and oaf1Δ bmh1-ts strains grown in low glucose (0.05%) medium under oleate-inducing conditions for 2 h. C and D, abundance of pSer-5-CTD-containing RNA pol II at GAL- and Adr1-dependent promoters. C, ChIP results showing the amount of RNA pol II-CTD pSer-5-recruited pol II at the TSS of two GAL genes (GAL7 and GAL10) in BMH1 WT strain harboring plasmids expressing the p53 activation domain (p53AD, residues 1–92), VP16AD (residues 411–490), or Adr1AD (residues 255–460) as GBD and Bmh binding region (RD) fusion proteins using rabbit polyclonal anti-pSer-5 antibody (ab5131, Abcam®). D, ChIP using rabbit polyclonal anti-pSer-5 antibody to detect the pSer-5 level of recruited pol II at the TSS of ADH2, ACS1, and ADY2 in three different S. cerevisiae strains (YLL908 (WT), KBY15 (cat8Δ), and KBY20 (cat8Δ bmh1-ts) grown in low glucose (0.05%) medium. E, ChIP results showing the amount of TFIIF recruitment at the TSS of three Adr1- and Cat8-activated genes (ADH2, ACS1, and ADY2) in WT, cat8Δ, and cat8Δ bmh1-ts cells grown in low glucose (0.05%) medium using rabbit polyclonal anti-Tfg2 antibody (generated against recombinant yeast Tfg2; a gift from S. Hahn). F, ChIP results showing amount of TFIIH recruitment at the TSS of three Adr1- and Cat8-activated genes (ADH2, ACS1, and ADY2) in WT, cat8Δ, and cat8Δbmh1-ts cells grown in low glucose (0.05%) medium using rabbit polyclonal anti-Ssl2 antibody (custom raised against E. coli-produced recombinant yeast Ssl2 from R&R Research, LLC; a gift from S. Hahn). G, ChIP results showing the amount of TBP detected at the TSS of two Adr1- and Cat8-activated genes (ADH2 and ACS1) in WT, cat8Δ, and cat8Δ bmh1-ts cells grown in low glucose (0.05%) medium using anti-TBP antibody. H, ChIP results showing the amount of TFIIB detected at the TSS of three Adr1- and Cat8-activated genes (ADH2, ACS1, and ADY2) in WT, cat8Δ, and cat8Δ bmh1-ts cells grown in low glucose (0.05%) medium using anti-TFIIB antibody. WT-R, represents value obtained in WT cells grown under repressing condition (5.0% glucose). Values were plotted after normalization against the telomere region (TEL) amplified using a telomere-specific primer pair (Table 3). Error bars in A–F represent values obtained from two independent experiment using three biological replicates. For G and H, the error bars represent values from three biological replicas of one experiment.
FIGURE 8.
FIGURE 8.
ChIP results showing the amount of RNA pol II detected at the TSS of three Adr1- and Cat8-activated genes (ADH2, ACS1, and ADY2) in WT, cat8Δ, and cat8Δ bmh1-ts cells after the addition of 5.0% glucose into the low glucose (0.05%) grown cells using anti-Rpb3 antibody. Values were plotted after normalization against the telomere region (TEL) amplified using a telomere-specific primer pair (Table 3). Error bars represent values obtained from two independent experiment using three biological replicates. p values range from 0.02 to 0.05.
FIGURE 9.
FIGURE 9.
RNA pol II recruitment at GAL promoters assayed with 8WG16 antibody. A, ChIP results showing the amount of RNA pol II detected at the TSS of three GAL genes (GAL1, GAL7, and GAL10) in BMH1 WT strain harboring plasmids expressing either p53 activation domain (p53AD, residues 1–92), VP16AD (residues 411–490), or Adr1AD (residues 255–460) as GBD and Bmh binding region (RD) fusion proteins using anti-pol II antibody (8WG16). B, pol II ChIP using 8WG16 antibody at GAL7 and GAL10 TSS in BMH1 WT and bmh1-ts strains expressing Adr1AD, RD-Adr1AD, or RD as a GBD fusion protein from the ADH1 promoter (ADH1p). Values were plotted after normalization against the telomere region (TEL) amplified using a telomere-specific primer pair (Table 3). Error bars represent values obtained from two independent experiment using three biological replicates. p values (★) range from 0.001 to 0.05.
FIGURE 10.
FIGURE 10.
Bmh does not regulate chromatin modification. A, ChIP results showing amount of total histone H3 lysine acetylation (H3KAc) at the TSS of two Adr1- and Cat8-activated genes (ADH2 and ACS1) in WT, cat8Δ, and cat8Δ bmh1-ts cells grown in low glucose (0.05%) medium using anti-H3KAc antibody (06–599, EMD MilliporeTM). WT-R, represents values obtained in WT cells grown in repressing medium (5.0% glucose). B, ChIP results showing amount of total histone H4 lysine acetylation (H4KAc) at the TSS of three Adr1- and Cat8-activated genes (ADH2, ACS1, and ADY2) in WT, cat8Δ, and cat8Δ bmh1-ts cells grown in low glucose (0.05%) medium using anti-H4KAc antibody (06–866, EMD MilliporeTM). C, ChIP measurement of total H3KAc at the promoter of three GAL genes (GAL1, GAL7, and GAL10) in BMH1 WT strain harboring vector expressing p53AD (residues 1–92), VP16AD (residues 411–490), or Adr1AD (residues 260–460) as GBD and Bmh binding region (RD) fusion proteins. D, ChIP to measure total H4KAc at the promoter of three GAL genes (GAL1, GAL7, and GAL10) in BMH1 WT strain harboring vector expressing p53AD, VP16AD, or Adr1AD as GBD and RD fusion proteins. RD representing the Bmh only-binding region was expressed as the GBD fusion protein. E, H3KAc-ChIP using anti-H3KAc antibody at three Gal4-dependent promoters (GAL1p, GAL7p, and GAL10p) in BMH1 WT and bmh1-ts strains expressing Adr1AD, RD-Adr1AD, or RD as a GBD fusion protein from the ADH1 promoter (ADH1p). F, ChIP results showing amount of histone H3 lysine 4 trimethylation (H3K4me3) at the TSS of three Adr1- and Cat8-activated genes (ADH2, ACS1, and ADY2) in WT, cat8Δ, and cat8Δ bmh1-ts cells grown in low glucose (0.05%) medium using anti-H3K4me3 antibody (Upstate/EMD Millipore). WT-R, represents values obtained in WT cells grown in repressing medium (5.0% glucose). G, ChIP to measure H3K4me3 at the promoter of three GAL genes (GAL1, GAL7, and GAL10) in BMH1 WT strain harboring vector expressing p53AD (residues 1–92), VP16AD (residues 411–490), or Adr1AD (residues 260–460) as GBD and Bmh binding region (RD) fusion proteins. Values are plotted after normalization against telomere region (TEL) amplified using a telomere-specific primer pair (Table 3). Error bars represent values obtained from two independent experiment using three biological replicates. p values range from 0.003 to 0.05.
FIGURE 11.
FIGURE 11.
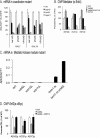
Bmh functions through coactivator(s). A, abundance of GAL mRNAs (GAL7 and GAL10) in WT and various coactivator (gcn5Δ (EAY12), gal11Δ (TYY540), and snf2Δ (EAY15)) mutant strains harboring vector expressing one of three different heterologous GBD-RD-AD fusion proteins described in Fig. 5A. Values were plotted after normalization against ACT1 mRNA. B, ChIP to detect Mediator recruitment at the promoter of three Adr1- and Cat8-activated genes (ADH2, ACS1, and ADY2) in WT (YLL908), cat8Δ, (KBY15), and cat8Δ bmh1-ts (KBY20) cells grown in low glucose (0.05%) medium using rabbit polyclonal anti-Srb4 antibody (generated against recombinant yeast Srb4, a gift from S. Hahn). WT-R, represents values obtained in WT cells grown in repressing medium (5.0% glucose). C, observed level of ADH2 message in various Mediator subunit mutant backgrounds (PPY2 (srb8Δ), PPY3 (srb10Δ), PPY4 (srb11Δ), PPY5 (bmh1-ts srb8Δ), YLL908 (WT), and YLL1087 (bmh1-ts)) under repressing conditions (5.0% glucose). D, occupancy of Swi/Snf complex at Adr1- and Cat8-activated promoters (ADH2p, ACS1p, and ADY2p) was measured by ChIP using anti-cMyc antibody (9E10X) against endogenously expressed SNF2-MYC13 from three different S. cerevisiae strains (RBY5 (WT), RBY21 (cat8Δ), and RBY30 (adr1Δcat8Δ, harboring vector pKD14H (HIS3) expressing ADR1c-S230A allele). Values were plotted as percentage of WT values after normalization against the telomere region (TEL) amplified using a telomere-specific primer pair (Table 3). Error bars represent values obtained from two independent experiment using three biological replicates.

Similar articles

Cited by

References

    1. Glass C. K. (1994) Differential recognition of target genes by nuclear receptor monomers, dimers, and heterodimers. Endocr. Rev. 15, 391–407 - PubMed
    1. Shore P., Sharrocks A. D. (1995) The MADS-box family of transcription factors. Eur. J. Biochem. 229, 1–13 - PubMed
    1. Wegner M. (1999) From head to toes: the multiple facets of Sox proteins. Nucleic Acids Res. 27, 1409–1420 - PMC - PubMed
    1. Herr W., Cleary M. A. (1995) The POU domain: versatility in transcriptional regulation by a flexible two-in-one DNA-binding domain. Genes Dev. 9, 1679–1693 - PubMed
    1. Messenguy F., Dubois E. (2003) Role of MADS box proteins and their cofactors in combinatorial control of gene expression and cell development. Gene 316, 1–21 - PubMed

Publication types

MeSH terms

LinkOut - more resources