. 2014 Oct 30;514(7524):591-6.
doi: 10.1038/nature13890.

Crystal structure of the PRC1 ubiquitylation module bound to the nucleosome

Affiliations

Crystal structure of the PRC1 ubiquitylation module bound to the nucleosome

Robert K McGinty et al. Nature. .

Abstract

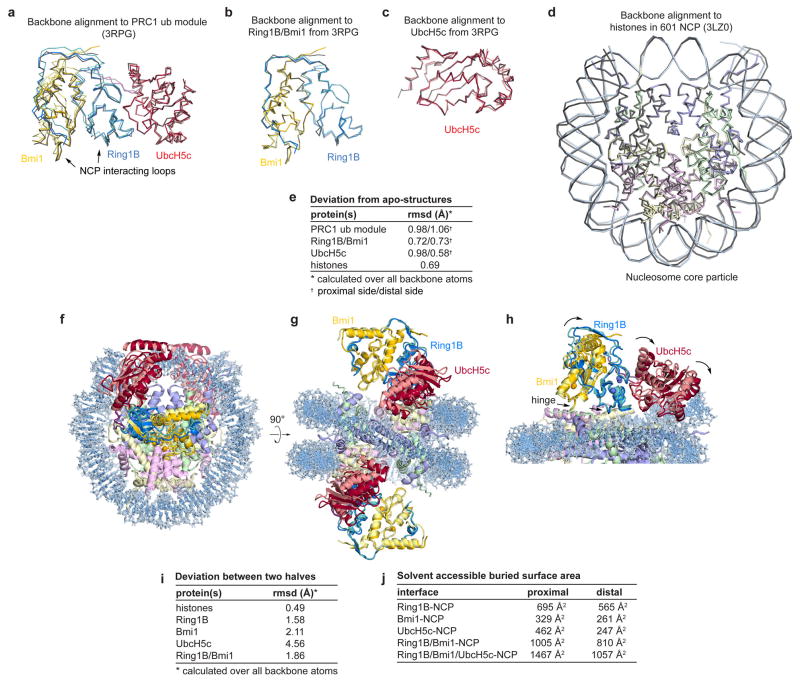
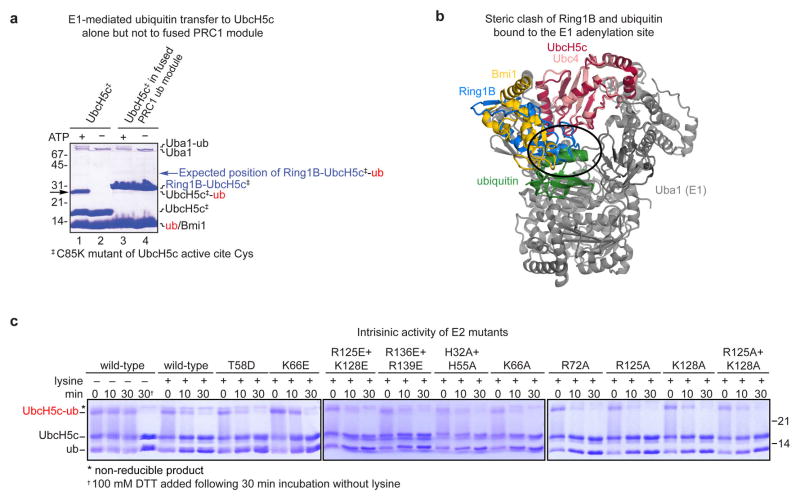
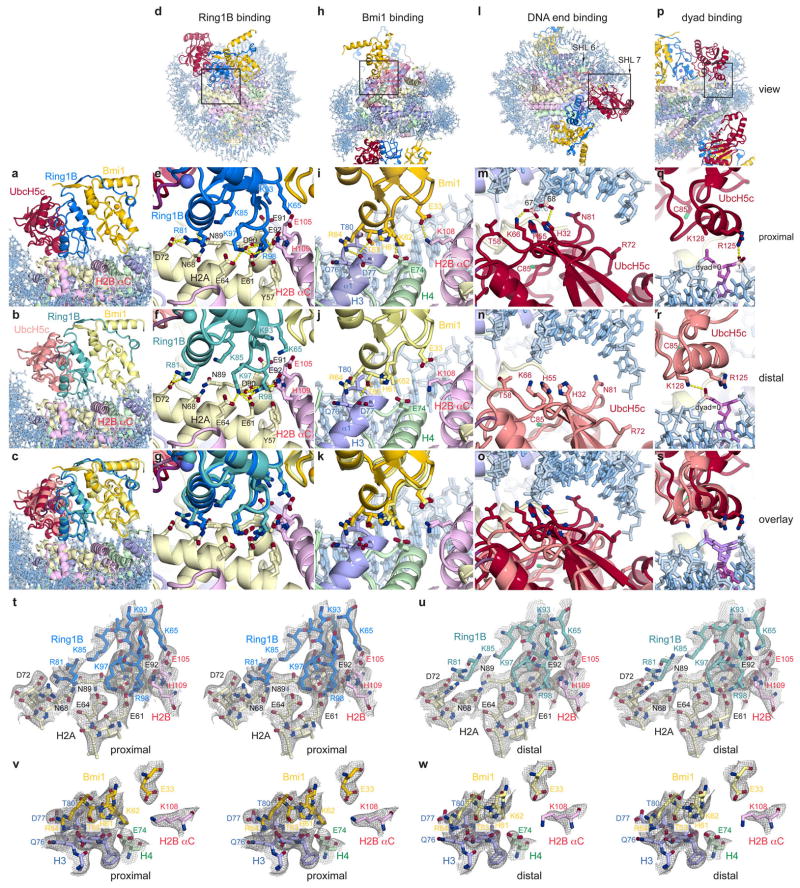
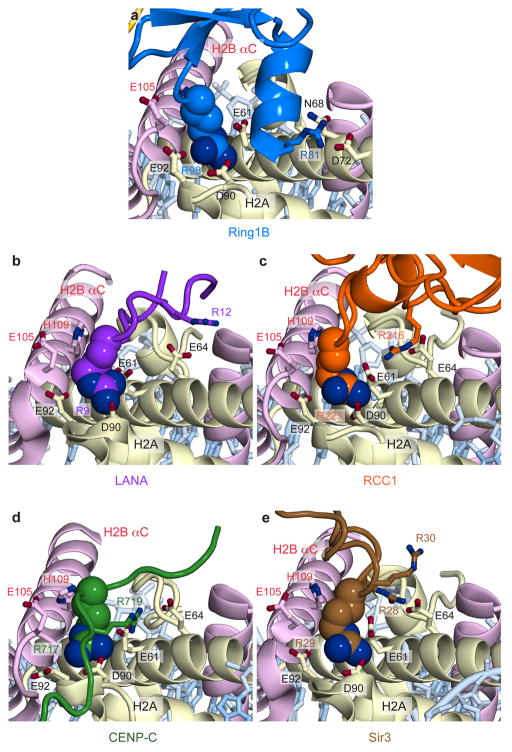
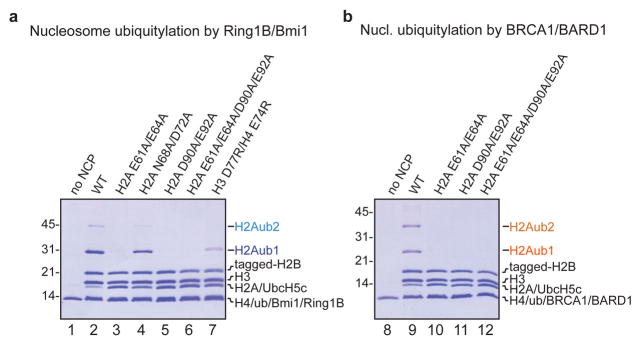
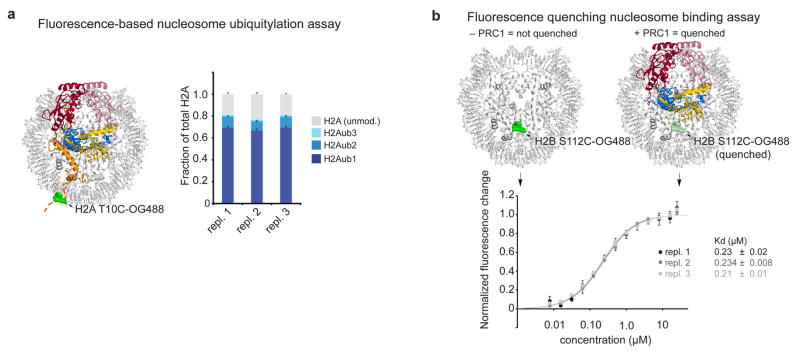
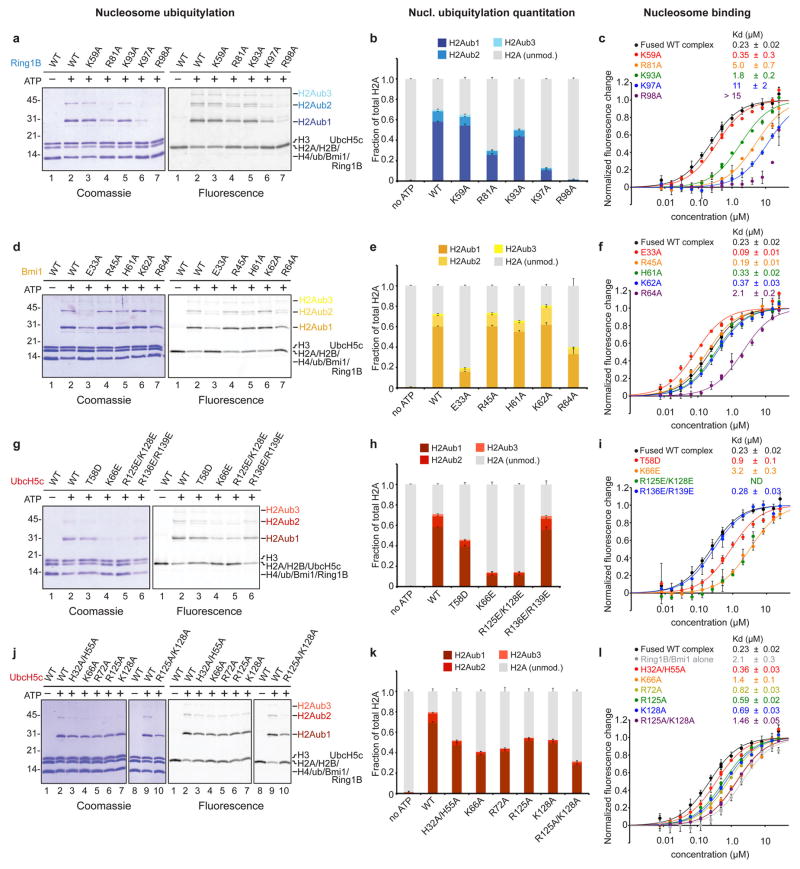
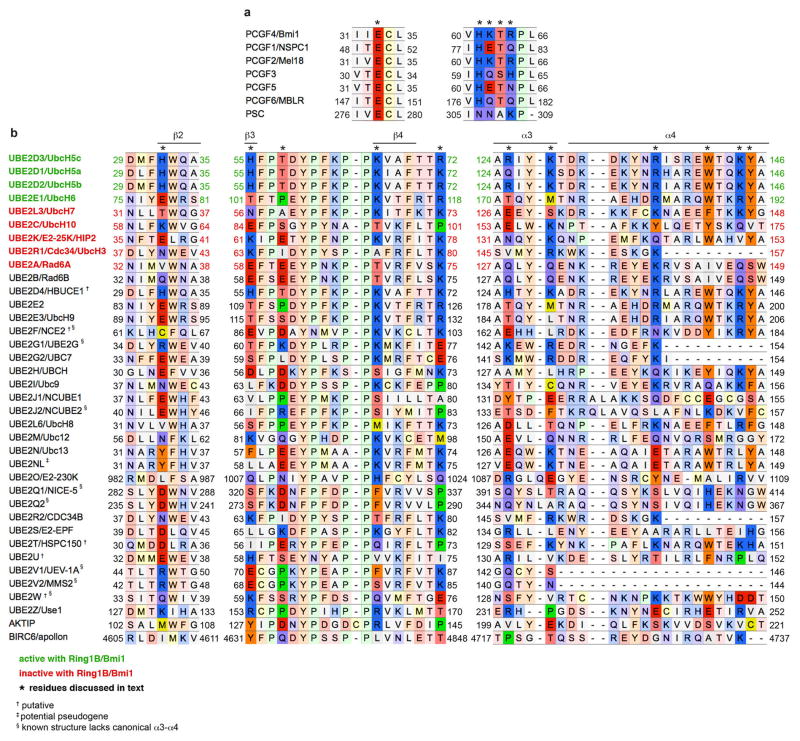
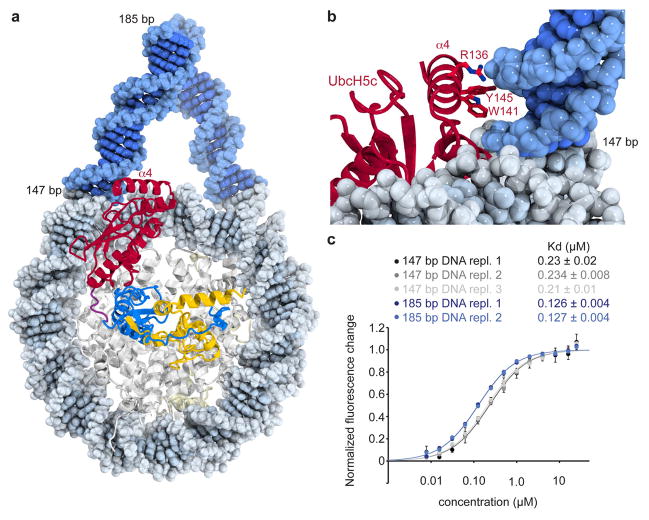
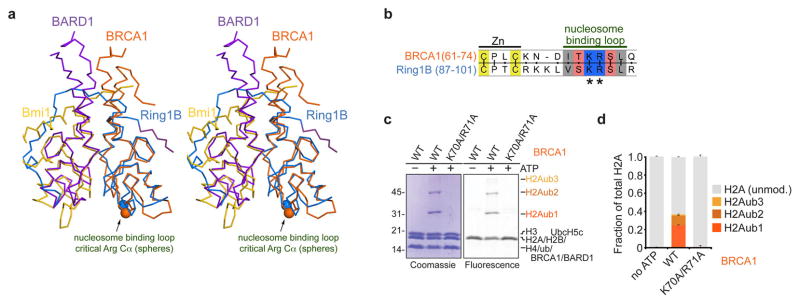
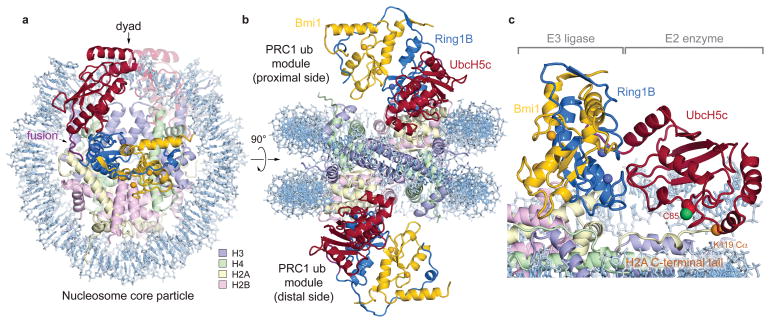
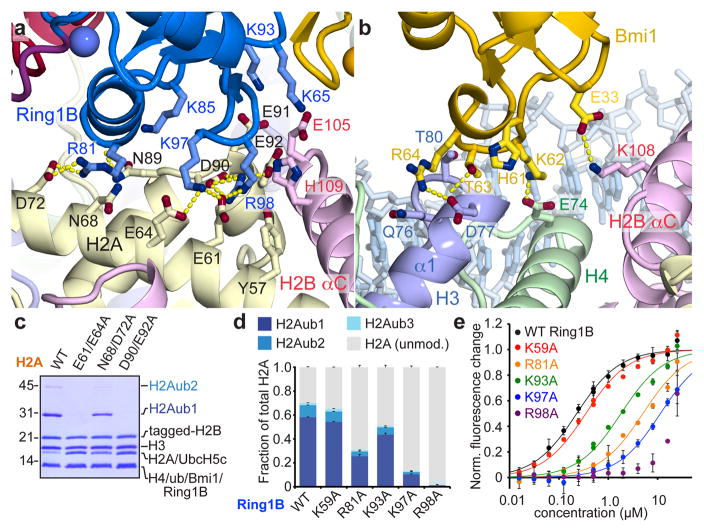
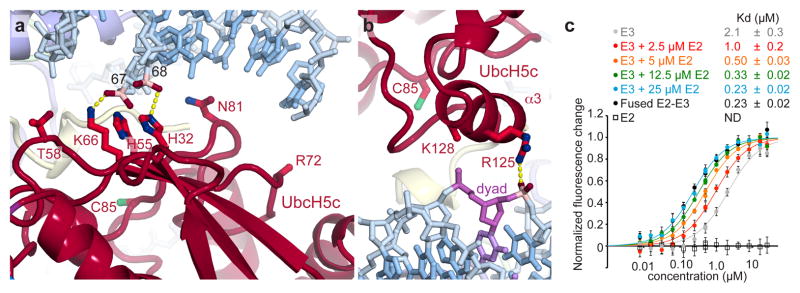
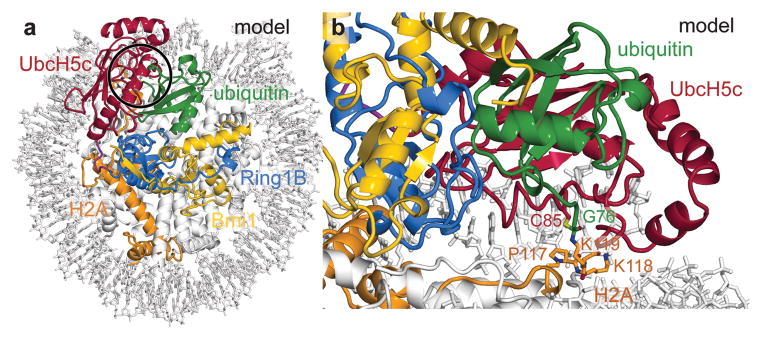
The Polycomb group of epigenetic enzymes represses expression of developmentally regulated genes in many eukaryotes. This group includes the Polycomb repressive complex 1 (PRC1), which ubiquitylates nucleosomal histone H2A Lys 119 using its E3 ubiquitin ligase subunits, Ring1B and Bmi1, together with an E2 ubiquitin-conjugating enzyme, UbcH5c. However, the molecular mechanism of nucleosome substrate recognition by PRC1 or other chromatin enzymes is unclear. Here we present the crystal structure of the human Ring1B-Bmi1-UbcH5c E3-E2 complex (the PRC1 ubiquitylation module) bound to its nucleosome core particle substrate. The structure shows how a chromatin enzyme achieves substrate specificity by interacting with several nucleosome surfaces spatially distinct from the site of catalysis. Our structure further reveals an unexpected role for the ubiquitin E2 enzyme in substrate recognition, and provides insight into how the related histone H2A E3 ligase, BRCA1, interacts with and ubiquitylates the nucleosome.


Conflict of interest statement

The authors declare no competing financial interests.

Figures

Extended Data Figure 1
Extended Data Figure 1. Alignment of PRC1 ubiquitylation module and nucleosome core particle with previously determined sub-structures and comparison of the two halves of the structure
a, Alignment of PRC1 ubiquitylation model from the proximal (darker colors) and distal (lighter colors) halves of the PRC1 ubiquitylation module-nucleosome core particle structure with the previously determined structure of the PRC1 ubiquitylation module alone (grey, PDB ID 3RPG) using all backbone atoms. Similar alignment using b, Ring1B/Bmi1 subcomplex or c, UbcH5c only. d, Alignment of the nucleosome core particle from the PRC1 ubiquitylation module-nucleosome core particle complex (colored) and the previously determined nucleosome core particle complex (PDB ID 3LZ0) containing the identical 601 nucleosome positioning sequence. e, Root mean square deviation (rmsd) for each of the alignments calculated over all backbone atoms. fg, Orthogonal views of an alignment of two copies of the complex following rotation of one copy about the pseudo-two-fold axis of symmetry of the nucleosome. This was accomplished by simultaneously aligning each histone in one copy to its symmetry related counterpart in the other copy. For visualization, the PRC1 ubiquitylation module from one copy of the structure is depicted with lighter colors. h, Zoomed view of the alignment showing PRC1 ubiquitylation module-nucleosome core particle interface. In panel h the proximal and distal PRC1 ubiquitylation modules are shown in dark and light colors, respectively. Hinge indicated by arrows. i, rmsd for each of the components following alignment of the two halves as described above. j, Buried surface area calculations for the indicated interfaces on the proximal and distal sides of the structure.
Extended Data Figure 2
Extended Data Figure 2. Characterization of fused and unfused UbcH5c
a, Coomassie stained gel of E1-mediated ubiquitin transfer to UbcH5c Cys85Lys mutant (UbcH5c) alone and in the context of the fused PRC1 ubiquitylation module. Ubiquitin is transferred by the E1 Uba1 to the UbcH5c mutant in an ATP dependent manner, black arrow (lanes 1 and 2). No ubiquitin transfer to the fused PRC1 ubiquitylation module is observed (lanes 3 and 4, expected band position for Ring1B-UbcH5c-ubiquitin conjugate indicated by a blue arrow). The Cys85Lys mutant was used to assist in visualization of the UbcH5c-ubiquitin stable isopeptide conjugates. b, Ring1B of the fused PRC1 ubiquitylation module (blue) clashes with ubiquitin in the E1 Uba1 adenylation site (green). Alignment of UbH5c subunit of PRC1 ubiquitylation module (PDB ID 3RPG) to Ubc4 in Ubc4/Uba1/ubiquitin structure (PDB ID 4II2). Ubc4 and Uba1 are shown pink and grey, respectively. c, Intrisic activity of wild-type and mutant UbcH5c enzymes. Time-course of UbcH5c-ubiquitin thioester aminolysis upon lysine addition. Reactions quenched with non-reducing loading buffer unless 100 mM DTT addition is indicated (†). Asterisk denotes a non-reducible product.
Extended Data Figure 3
Extended Data Figure 3. Comparison of the proximal and distal Ring1B-, Bmi1-, and UbcH5c-nucleosome interfaces
Identical views of Ring1B/Bmi1 saddle from a, proximal and b, distal halves of structure and c, overlay. dg, Ring1B-histone interface views, including d, zoom out with box indicating field of view depicted in zoomed panels from e, proximal and f, distal halves of structure and g, overlay. hk, Similar views of Bmi1-histone interface. l–s, Simlar views of UbcH5c-DNA interfaces. t–u, 2mFo-DFc difference Fourier transform electron density maps for the Ring1B-nucleosome interface contoured at 1.0 σ on the t, proximal and u, distal sides of the PRC1 ubiquitylation module-nucleosome core particle structure. vw, Similarly contoured electron density map for the v, proximal and w, distal Bmi1-nucleosome interface. All views are identical to those depicted in Fig. 2 and 3.
Extended Data Figure 4
Extended Data Figure 4. Chromatin factors use an arginine-anchor to bind the H2A/H2B acidic patch
Identical views of a, E3 ligase Ring1B (blue), b, viral LANA peptide (purple, PDB ID 1ZLA), c, chromatin factor RCC1 (purple, PDB ID 3MVD), d, centromeric protein CENP-C (green, PDB ID 4INM), and e, silencing protein Sir3 (brown, PDB ID 3TU4) bound the acidic patch. Conserved arginine is shown in space-filling representation. Other arginines involved in binding are shown as sticks. UbcH5c and the Ring1B loop between residues 81 and 98 are not shown for figure clarity.
Extended Data Figure 5
Extended Data Figure 5. Ring1B/Bmi1- and BRCA1/BARD1-mediated ubiquitylation of nucleosomes containing histone mutations
Coomassie stained gels of ubiquitylation assays using nucleosomes with the specified histone mutants, E1 Uba1, E2 UbcH5c, STR-His10 tagged ubiquitin and a, Ring1B/Bmi1 or b, BRCA1/BARD1 RING heterodimers. Tagged H2B (STR-His6) was used to prevent electrophoretic comigration with unmodified H2A. Experiment was repeated twice in our laboratory.
Extended Data Figure 6
Extended Data Figure 6. Fluorescence-based nucleosome ubiquitylation and binding assays
a, Fluorescence-based nucleosome ubiquitylation assay. Ubiquitylation assays performed with nucleosomes labeled with Oregon Green 488 maleimide on H2A Thr10Cys mutant (H2A T10C-OG488), left. Right, replicates 1, 2 and 3 of wild-type assay run on four different gels and quantified to demonstrate reproducibility across gels. Means and standard deviations shown, n = 4. b, Fluorescence-based nucleosome binding assay. Nucleosomes labeled with Oregon Green 488 on H2B Ser112Cys mutant (H2B S112-OG488), top left. Binding of PRC1 ubiquitylation module leads to partial quenching of the fluorophore allowing affinity measurements to be made, top right. Three technical replicates of fused wild-type PRC1 ubiquitylation module are shown to demonstrate reproducibility, bottom. Means and standard deviations shown for each data point, n = 3.
Extended Data Figure 7
Extended Data Figure 7. Effects of PRC1 ubiquitylation module mutants on nucleosome ubiquitylation and binding
a, Representative gel of one replicate of ubiquitylation assay using E1 Uba1, UbcH5c, STR-His10 tagged ubiquitin, nucleosome core particles, and E3 Ring1B/Bmi1 with the indicated Ring1B mutants stained with Coomassie (left) and scanned for fluorescent H2A (right). Nucleosome core particles in the experiment are doped with nucleosome core particles containing the H2A Thr10Cys mutant labeled with Oregon Green 488 maleimide. b, Quantitation of mono- (H2Aub1, dark blue), di- (H2Aub2, blue) and tri-ubiquitylated H2A (H2Aub3, light blue) are shown as a fraction of total H2A. Means and standard deviations from three technical replicates are depicted. Samples from the same experiment were analyzed on different gels, processed in parallel. c, Fluorescence quenching binding curves for fused PRC1 ubiquitylation modules containing the indicated mutations of Ring1B (colored as shown). Means and standard deviations are shown with n = 3 for each data point. Fluorescence is normalized to fit values for unbound and saturated nucleosome core particles. Concentrations depicted using log scale. Experiments as described above for df, indicated Bmi1 mutants, gi, UbcH5c charge reversal mutants and jl, UbcH5c alanine mutants. Triplicate ubiquitylation assays were repeated at least two times in our laboratory.
Extended Data Figure 8
Extended Data Figure 8. Alignment of Bmi1 paralogs and E2s
a, Sequence alignment of segments of Bmi1 with PCGF (Polycomb group RING finger) paralogs also found in PRC1. b, Sequence alignment of UbcH5c and other E2s known to be active (green) or inactive with (red) or of unknown compatibility with Ring1B/Bmi1-mediated nucleosomal ubiquitylation. Key residues discussed in the text are indicated with an asterisk.
Extended Data Figure 9
Extended Data Figure 9. Linker DNA increases the affinity of the PRC1 ubiquitylation modules for the nucleosome
a, Linear B-form duplex DNA modeled onto the DNA ends of the PRC1 ubiquitylation module-nucleosome core particle structure. b, The UbcH5c α4 helix occupies the major groove of modeled linker DNA. Several basic and aromatic side chains line the DNA-adjacent face of the α4 helix. c, Linker DNA enhances nucleosomal binding of fused PRC1 ubiquitylation module. Fluorescence quenching binding curves for the wild-type fused PRC1 ubiquitylation module binding to nucleosomes centered on 147 bp (black, grey, and light grey) or 185 bp (blue and light blue) 601 DNA. Technical replicates performed on different days are depicted in different shades of grey and blue. Means and standard deviations are shown with n = 3 for each data point. Fluorescence is normalized to fit values for unbound and saturated nucleosome core particles. Concentrations depicted using log scale.
Extended Data Figure 10
Extended Data Figure 10. BRCA1 requires similar loop region and H2A/H2B acidic patch for nucleosome ubiquitylation
a, Alignment of the BRCA1/BARD1 and Ring1B/Bmi1 heterodimers using the RING domains of BRCA1 from the BRCA1/BARD1 NMR structure (PDB ID 1JM7) and Ring1B. BRCA1 and BARD1 are shown in orange and purple, respectively; Cα atoms of essential arginine residues are indicated by spheres. b, Sequence alignment of Ring1B and BRCA1 shows conserved nucleosome interacting loop. c, BRCA1 Lys70Ala/Arg71Ala mutation eliminates E3 ligase activity of BRCA1/BARD1 RING heterodimer. Representative gel of one replicate of ubiquitylation assay using E1 Uba1, E2 UbcH5c, STR-His10 ubiquitin, nucleosome core particles, and E3 BRCA1/BARD1 with the indicated mutants stained with Coomassie and scanned for fluorescent H2A. Nucleosome core particles in the experiment are doped with nucleosome core particles containing the H2A Thr10Cys mutant labeled with Oregon Green 488 maleimide. d, Quantitaion of mono- (H2Aub1, dark orange), di- (H2Aub2, orange) and tri-ubiquitylated H2A (H2Aub3, light orange) are shown as a fraction of total H2A. Means and standard deviations from three technical replicates are depicted. Ubiquitylation assay was repeated twice in our laboratory.
Figure 1
Figure 1. Crystal structure of PRC1 ubiquitylation module-nucleosome core particle complex
a, View of the complex looking down on the DNA superhelical axis. b, Orthogonal view of the complex with proximal and distal halves of the structure indicated. c, Zoomed view demonstrating Ring1B/Bmi1 heterodimer positioning UbcH5c active site Cys85 over the H2A C-terminal tail near the H2A Lys119 Cα atom (orange sphere). Crystals contain the minimal RING heterodimer Ring1B(2-116)/Bmi1(2-109).
Figure 2
Figure 2. Ring1B/Bmi1 E3 heterodimer interacts with histone surface
a, Ring1B-histone acidic patch interactions in cartoon representation with relevant side chains and hydrogen bonds (yellow) highlighted. b, Bmi1-histone interface shown similarly. c, Coomassie blue stained gel of ubiquitylation assay using H2A mutant NCP as indicated. d, Quantitated nucleosome ubiquitylation assay using indicated Ring1B mutants. e, Nucleosome binding curves for fused wild-type and Ring1B mutant E2-E3 complexes. Means and standard deviations are shown in d and e with n = 3 for each data point. Fluorescence is normalized to fit values for unbound and saturated NCP. Concentrations depicted using log scale.
Figure 3
Figure 3. UbcH5c binds to nucleosomal DNA enhancing Ring1B/Bmi1-NCP affinity
a, UbcH5c antiparallel β-sheet-DNA end interactions. Important phosphates colored pink. The catalytic UbcH5c Cys85 is shown. b, UbcH5c-dyad interactions. The nucleosome dyad nucleotide is colored purple. Arg72 and Lys128 side chains not modeled due to limited electron density. c, Fluorescence quenching NCP binding curves for E3 Ring1B/Bmi1 alone (grey), fused to E2 UbcH5c (black), or with E2 UbcH5c added in trans (colored as shown). E2 UbcH5c alone (open squares) is undetectable under assay conditions as it either fails to bind to the NCP or is undetectable due to the location of the fluorescent probe used to monitor Ring1B/Bmi1 binding. Means and standard deviations are shown with n = 3 for each data point. Fluorescence is normalized to fit values for unbound and saturated NCP. Concentrations depicted using log scale.
Figure 4
Figure 4. Model of ubiquitylation transition state complex
a, View of transition state model looking down on the DNA superhelical axis with region around catalytic site highlighted with black circle. Ubiquitin modeled from the RNF4/UbcH5a/Ub (PDB ID 4AP4) structure based on of alignment of its E2 subunit and UbcH5c from the proximal half of the PRC1 ubiquitylation module-nucleosome core particle structure. b, Side view of tetrahedral intermediate model.

Comment in

References

    1. Boyer LA, et al. Polycomb complexes repress developmental regulators in murine embryonic stem cells. Nature Cell Biology. 2006;441:349–353. - PubMed
    1. Di Croce L, Helin K. Transcriptional regulation by Polycomb group proteins. Nature Structural & Molecular Biology. 2013;20:1147–1155. - PubMed
    1. Laugesen A, Helin K. Chromatin repressive complexes in stem cells, development, and cancer. Cell Stem Cell. 2014;14:735–751. - PubMed
    1. Bracken AP, Helin K. Polycomb group proteins: navigators of lineage pathways led astray in cancer. Nat Rev Cancer. 2009;9:773–784. - PubMed
    1. Crea F, Paolicchi E, Marquez VE, Danesi R. Polycomb genes and cancer: Time for clinical application? Critical Reviews in Oncology / Hematology. 2012;83:184–193. - PubMed

Publication types

MeSH terms

Associated data