. 2014 Oct 30:4:6835.
doi: 10.1038/srep06835.

Loss of α-catenin elicits a cholestatic response and impairs liver regeneration

Affiliations

Loss of α-catenin elicits a cholestatic response and impairs liver regeneration

Keira Joann Herr et al. Sci Rep. .

Abstract

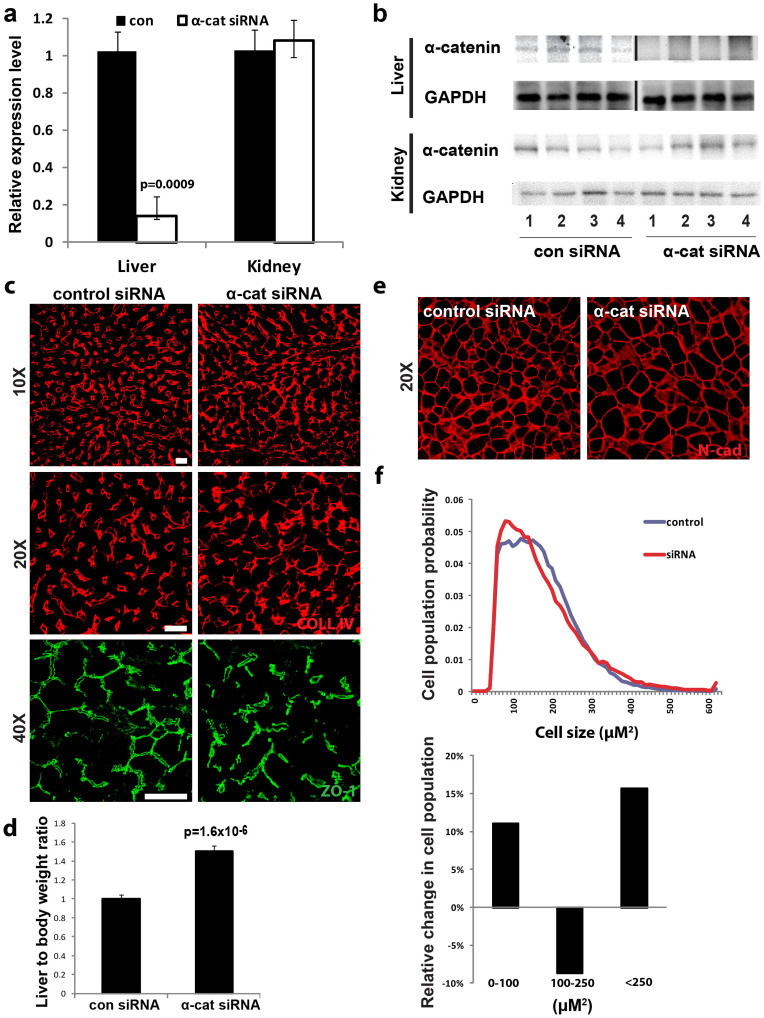
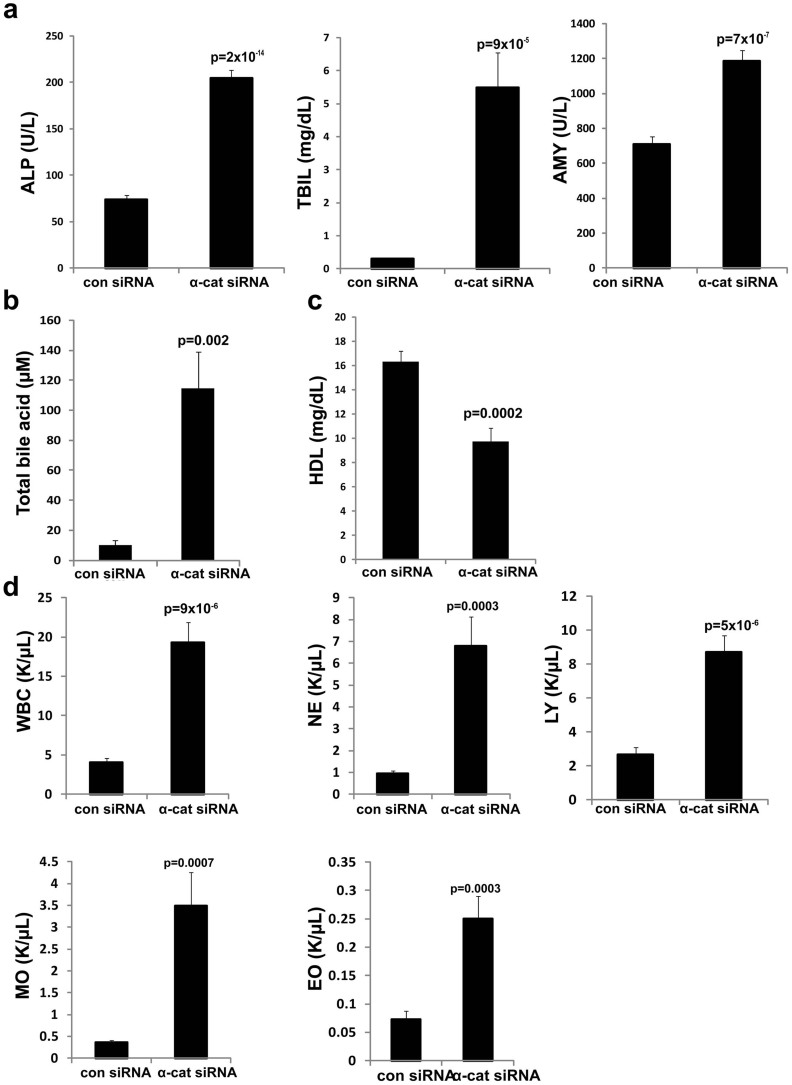
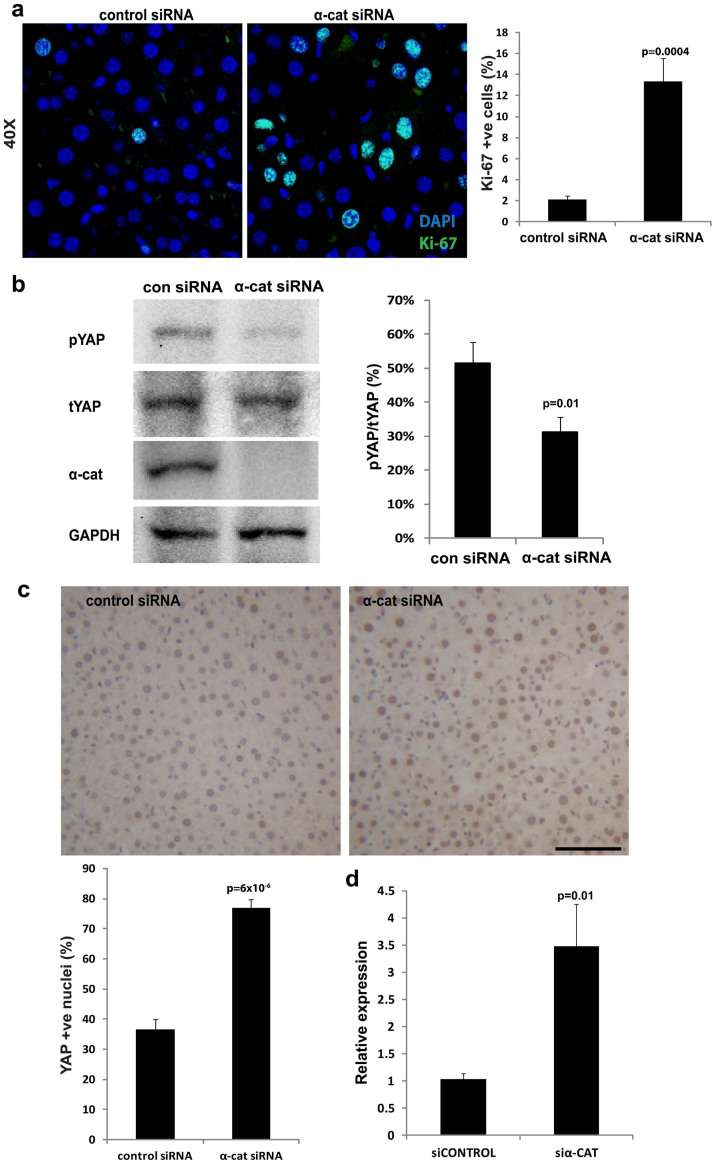
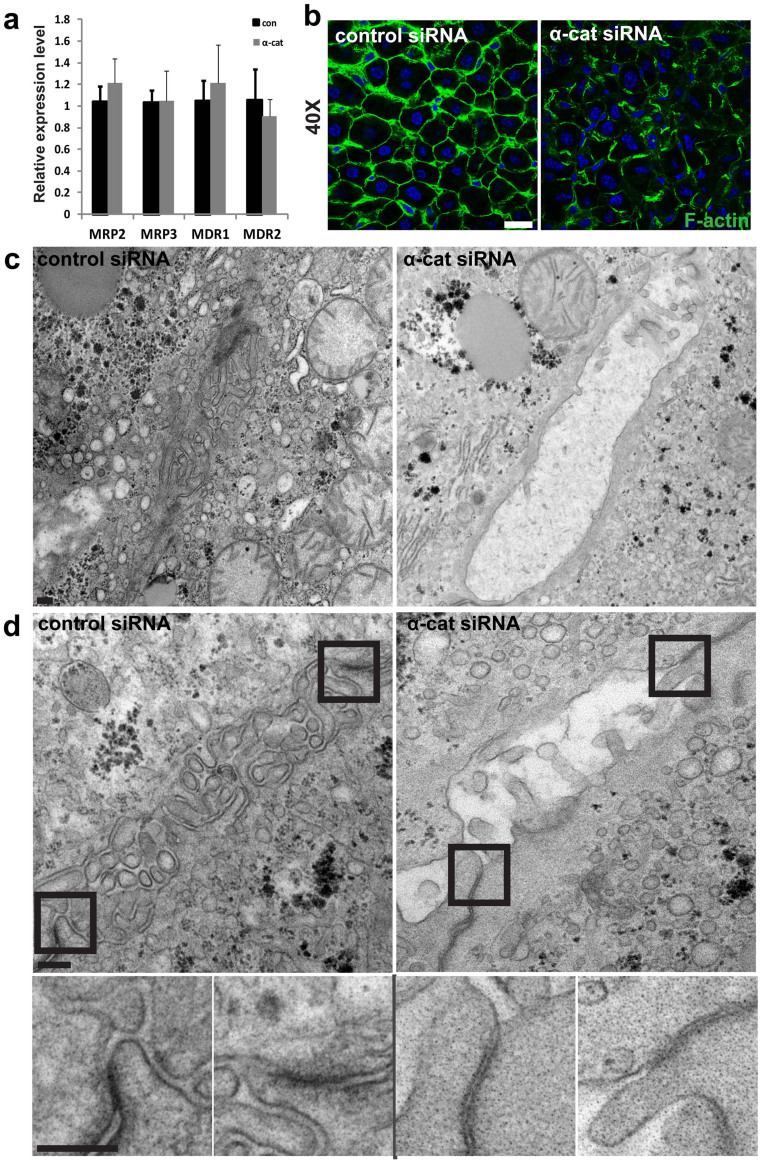
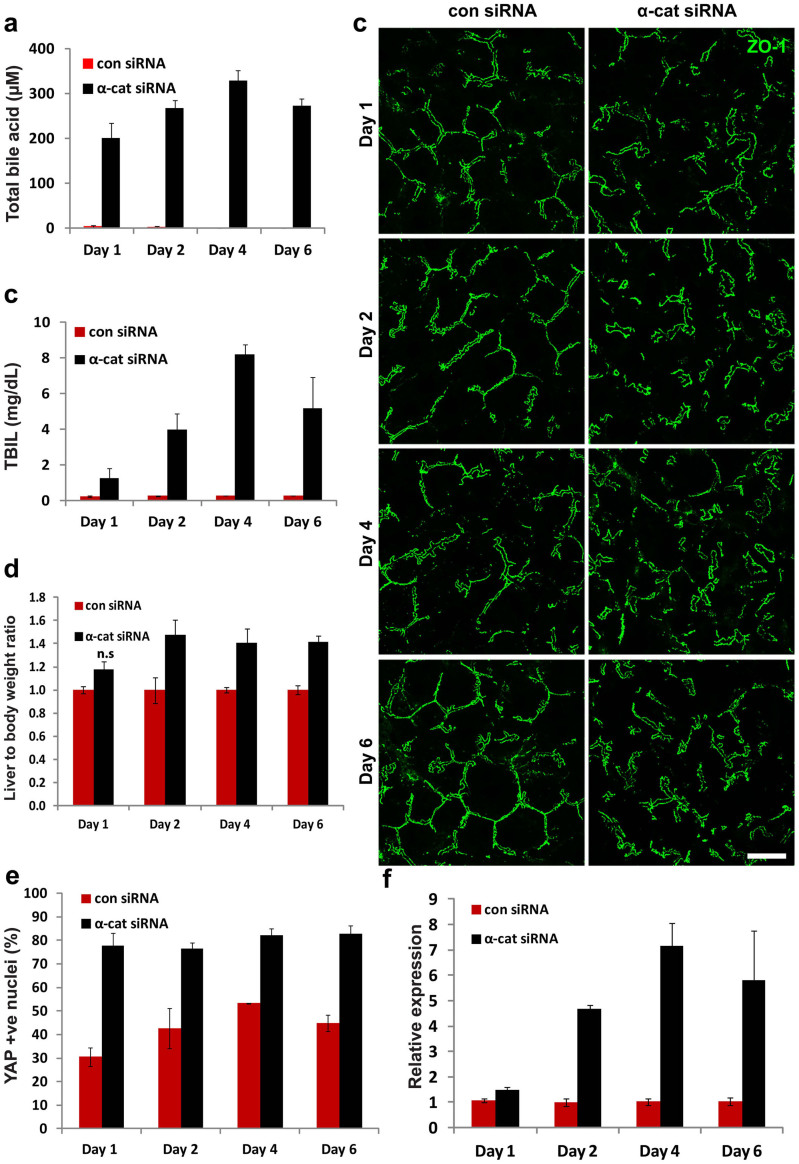
The liver is unique in its capacity to regenerate after injury, during which hepatocytes actively divide and establish cell-cell contacts through cell adhesion complexes. Here, we demonstrate that the loss of α-catenin, a well-established adhesion component, dramatically disrupts liver regeneration. Using a partial hepatectomy model, we show that regenerated livers from α-catenin knockdown mice are grossly larger than control regenerated livers, with an increase in cell size and proliferation. This increased proliferation correlated with increased YAP activation, implicating α-catenin in the Hippo/YAP pathway. Additionally, α-catenin knockdown mice exhibited a phenotype reminiscent of clinical cholestasis, with drastically altered bile canaliculi, elevated levels of bile components and signs of jaundice and inflammation. The disrupted regenerative capacity is a result of actin cytoskeletal disorganisation, leading to a loss of apical microvilli, dilated lumens in the bile canaliculi, and leaky tight junctions. This study illuminates a novel, essential role for α-catenin in liver regeneration.


Figures

Figure 1
Figure 1. Specific knockdown of α-catenin in liver induces major alterations to the hepatic functional unit.
(A) α-catenin siRNA-nanolipid particle (LNP)-injected mice exhibited a specific knockdown in α-catenin transcript levels (n = 6 for each group) in liver but not in kidney (n = 4 for each group). (B) α-catenin protein levels in liver showed a corresponding decrease (n = 6 for each group). Gel image shown is cropped for concise presentation. (C) Regenerated liver tissues were immunolabelled with antibodies directed against collagen IV (red; 10× and 20×) and zona occludens (ZO)-1 (green; 40× magnification). Sinusoids labelled with collagen IV were tortuous and disorganised in α-catenin siRNA-treated livers. Bile canaliculi immunolabelled with ZO-1 were arranged in an organised network of tubular structures, whereas a disruption in this network was observed in α-catenin siRNA-injected livers. The lumens of the BC were also enlarged. (D) Upon harvesting, the livers were dissected and weighed. The α-catenin siRNA-injected livers were 50% bigger than the control livers. (E) Immunolabelling of cell membranes of liver sections with N-cadherin (red; 20× magnification) revealed that some cells in α-catenin siRNA-injected livers were significantly larger. (F) A statistical analysis of the cell size profile of the experimental livers was performed. Top: The probability distribution graph of the cells was computed and shown. Bottom: The difference between control and α-catenin siRNA cell populations was computed and is represented by the percentage change between the siRNA and control populations. This shows that α-catenin siRNA-injected livers were more highly enriched in the smaller and larger cell fractions as compared with control livers (Control: n = 8, α-cat: n = 11). Scale bars, 50 µm.
Figure 2
Figure 2. Blood chemistry of α-catenin-knockdown mice is indicative of cholestasis in vivo.
Blood chemistry analysis was performed on blood samples taken from mice at the time of liver harvesting, and several markers linked to liver function were measured. (A) Alkaline phosphatase (ALP) levels were significantly higher in the α-catenin siRNA-injected group. High ALP levels are clinically linked to bile canaliculi malfunction. Total bilirubin (TBIL) content was also elevated in the siRNA-injected group as compared with the control, which suggests a dysfunction in bile production and flow. Amylase (AMY) levels were also significantly higher in the α-catenin-injected group, which is clinically linked to disrupted bile flow (Control: n = 17, α-cat: n = 21). (B) Total bile acid (TBA) levels were also elevated in the α-catenin-injected group, indicating that there is a high build-up of TBA in the blood. (C) High-density lipoprotein (HDL) levels were significantly decreased in α-catenin-injected group, corresponding to a blockage in bile transport (con: n = 9, α-cat: n = 10). (D) siRNA-injected mice exhibited a significantly higher total white blood cells (WBC), suggesting inflammation. Furthermore, the different subsets within the white blood cell population were all significantly higher, including neutrophils (NE) and monocytes (MO), lymphocytes (LY) and eosinophils (EO). K/µl: Thousands per microliter of blood (con: n = 17, siRNA: n = 21).
Figure 3
Figure 3. Increase in liver size is caused by an increase in hepatocyte proliferation via the activation of YAP.
(A) Nuclei of cells from liver sections were immunolabelled with anti-Ki67 antibody (green) and DAPI (blue). Left: Representative images of control and α-catenin knockdown liver sections. Scale bars, 50 µm. Right graph: The percentage of Ki67-positive cells out of all nuclei-positive cells was then calculated for α-catenin knockdown and control livers. α-catenin knockdown livers exhibited a much greater level of proliferation (%) as compared with the control livers (13.37% versus 2.1%, respectively). (B) Liver lysates were blotted for phosphorylated (p) YAP and total (t) YAP, and the ratio of phosphorylated YAP to total YAP (as a percentage) was significantly lower in the α-catenin knockdown livers (n = 9 for each group). Gel images shown are cropped and representative of gels run under the same experimental conditions. (C) Nuclei of cells from liver sections were immunolabelled with anti-YAP antibody (brown). Top: Representative images of control and α-catenin knockdown liver sections. Scale bars, 50 µm. Left bottom graph: The percentage of YAP-positive (+ve) nuclei was calculated for α-catenin knockdown and control livers (n = 7 for each group). (D) Connective tissue growth factor (CTGF), an important downstream transcriptional target of YAP, was assessed for gene expression levels. CTGF was found to be substantially up-regulated in alpha-catenin knockdown liver (n = 7 for control group, n = 10 for alpha-catenin group).
Figure 4
Figure 4. Bile canaliculi (BC) disruption caused by actin cytoskeleton disorganisation results in a loss of microvilli and dilated BC lumens.
(A) The real-time expression of four important bile transporter proteins— Multidrug resistance-associated protein-2 (Mrp2), Mrp3, multidrug resistance gene-1 (Mdr1, otherwise known as P-glycoprotein multidrug transporter (Pgp) or ABCB1), and Mdr2—was measured in α-catenin knockdown livers and compared with control livers. No significant change was observed for any of the proteins. (B) Liver sections were immunolabelled with phalloidin to stain for F-actin (green) and with DAPI (blue) and visualized by confocal microscopy. Representative staining shows that actin microfilaments are arranged along the cell periphery in an organised pericanalicular pattern in control livers, but are grossly distorted and misshapen in α-catenin knockdown livers. Scale bar, 20 µm. (C-D) Representative images from electron microscopy performed on α-catenin knockdown and control livers. (C) Control BC consists of lumens filled with microvilli, as shown. Strikingly, the BC in α-catenin knockdown mice possess increased dilation in the lumens, with a severe paucity of microvilli. (D) A closer look at the tight junctions that seal the BC is shown in the magnified insets (bottom row). In control livers, tight junctions were marked by a fusion of two membranes into a characteristic darker single membrane. In contrast, there was an absence of fusion of the membranes on the sides of the BC in α-catenin knockdown livers, with tight junction regions exhibiting two separated plasma membranes. Scale bars, 0.2 µm.
Figure 5
Figure 5. α-catenin is required throughout the entire timeline of liver regeneration.
α-catenin siRNA-nanolipid particle (LNP)-injected mice were subjected to surgery and assessed at 1, 2, 4, 6 days after surgery for blood and liver analyses. (A) α-catenin siRNA-LNP-injected mice exhibited a significant increase in total bile acids from day 1 with a peak at day 4. (B) Total bilirubin levels (TBIL) showed a corresponding increase from day 1, again peaking at day 4. (C) ZO-1 staining (green) for bile canaliculi structure was disrupted in α-catenin siRNA-LNP injected mice as early as day 1 after surgery and persisted until day 6. (D) The total liver-to-body weight ratio was significantly increased only from day 2 (n = 3 for each time point except day 6; n = 2 for control group). All paired groups had significant p-values except day 6 (not significant). Scale bars, 20 µm. (E) Nuclei of cells from liver sections were immunolabelled with anti-YAP antibody (brown). The percentage of YAP-positive (+ve) nuclei was then calculated for α-catenin knockdown and control livers at each time point. Significant differences were measured at each time-point (p<0.05). (F) Gene expression of connective tissue growth factor (CTGF). CTGF was substantially up-regulated from day 2 onwards. Significant differences were measured at each time-point (p<0.05).

Similar articles

Cited by

References

    1. Foundation, A. L. Liver Wellness. Increasing Public Awareness of Liver Health, <http://www.liverfoundation.org/downloads/alf_download_29.pdf> (2009). Accessed 7th July 2014.
    1. Liver E. A. f. t. S. o. Facts and Figures. The Liver: Vital for Life, <http://old.easl.eu/eu_facts.asp> (2009). Accessed 7th July 2014.
    1. Huang J. & Rudnick D. A. Elucidating the metabolic regulation of liver regeneration. Am. J. Pathol. 184, 309–321, 10.1016/j.ajpath.2013.04.034 (2014). - PMC - PubMed
    1. Mitchell C. & Willenbring H. A reproducible and well-tolerated method for 2/3 partial hepatectomy in mice. Nat. Protoc. 3, 1167–1170, 10.1038/nprot.2008.80 (2008). - PubMed
    1. Michalopoulos G. K. Liver regeneration. J. Cell. Physiol. 213, 286–300, 10.1002/jcp.21172 (2007). - PMC - PubMed

Publication types

MeSH terms

LinkOut - more resources