Review
. 2015 Jul-Aug;10(4):245-65.
doi: 10.1002/cmmi.1629. Epub 2014 Oct 29.

A review of responsive MRI contrast agents: 2005-2014

Affiliations
Review

A review of responsive MRI contrast agents: 2005-2014

Dina V Hingorani et al. Contrast Media Mol Imaging. 2015 Jul-Aug.

Abstract

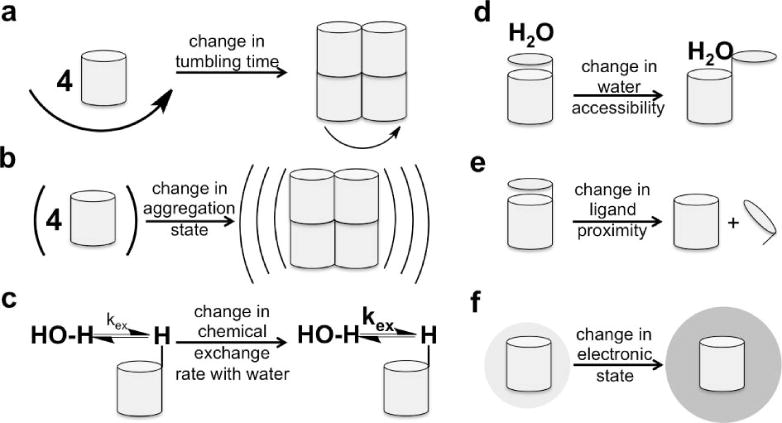
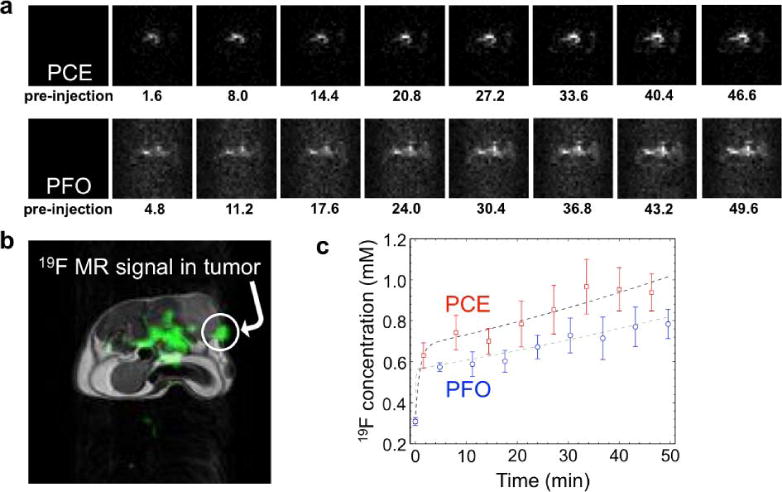
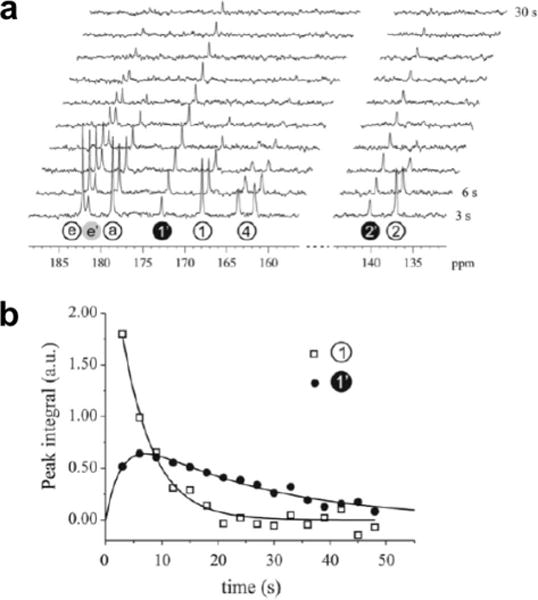
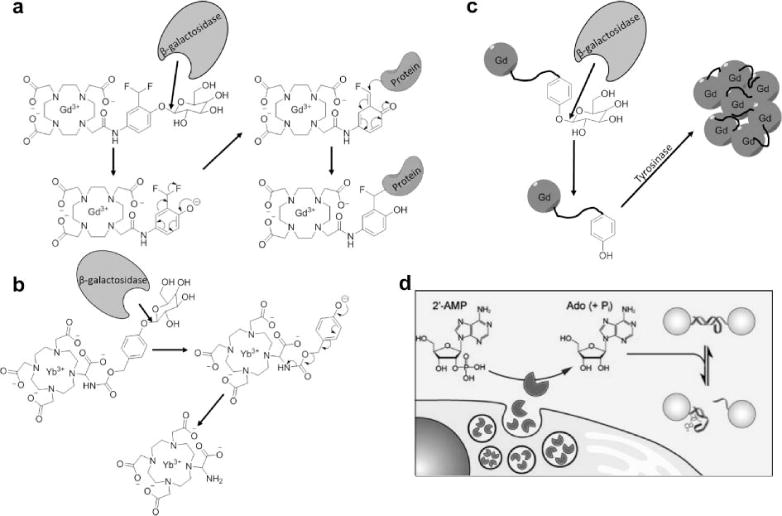
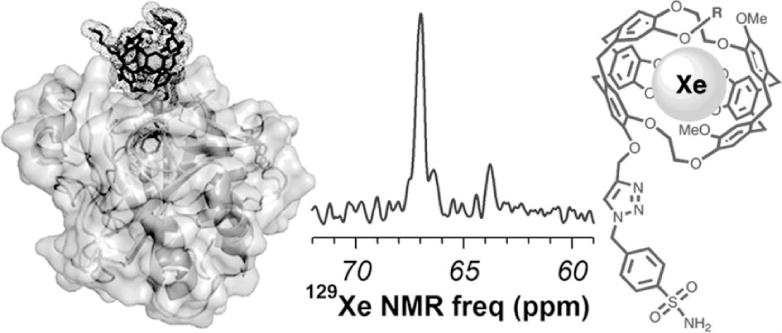
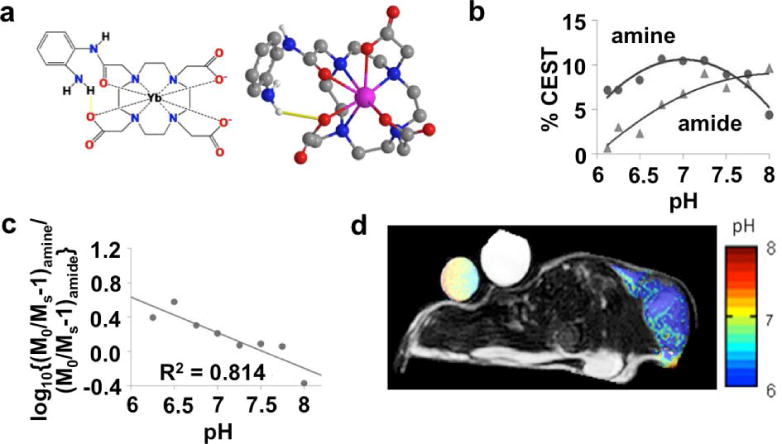
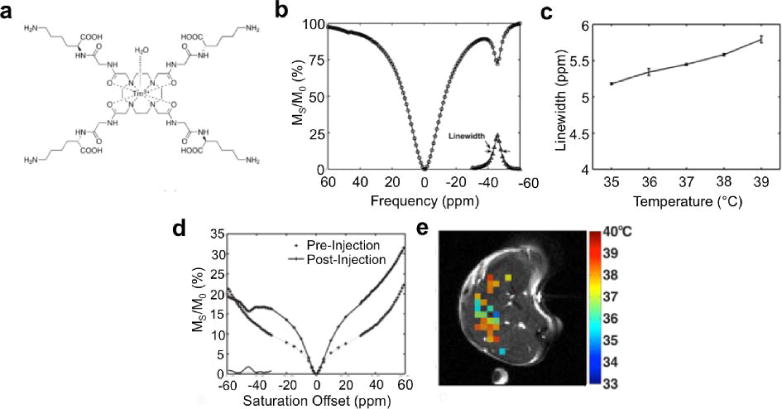
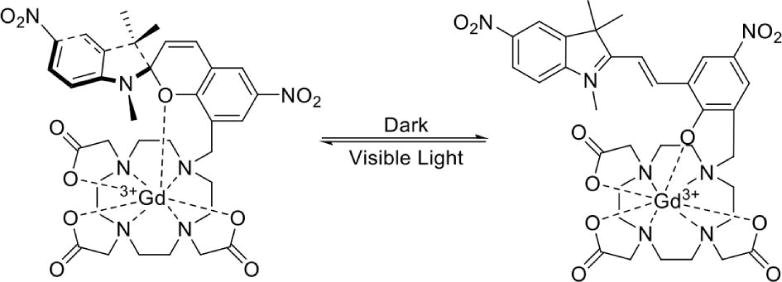
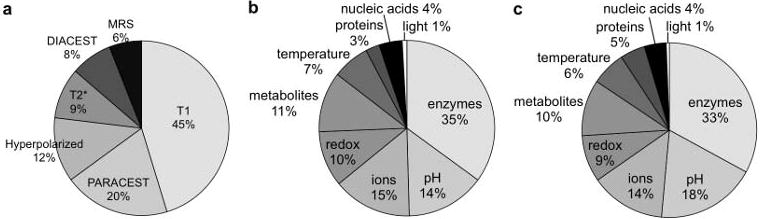
This review focuses on MRI contrast agents that are responsive to a change in a physiological biomarker. The response mechanisms are dependent on six physicochemical characteristics, including the accessibility of water to the agent, tumbling time, proton exchange rate, electron spin state, MR frequency or superparamagnetism of the agent. These characteristics can be affected by changes in concentrations or activities of enzymes, proteins, nucleic acids, metabolites, or metal ions, or changes in redox state, pH, temperature, or light. A total of 117 examples are presented, including ones that employ nuclei other than (1) H, which attests to the creativity of multidisciplinary research efforts to develop responsive MRI contrast agents.

Keywords: CEST agents; MRI contrast agents; MRS agents; T1 agents; T2* agents; hyperpolarized agents; responsive agents.


Figures

Figure 1
Figure 1
Schematic of the six physicochemical mechanisms that can be exploited to create a responsive MRI contrast agent: a) a change in tumbling time; b) a change in aggregation state that changes superparamagnetism; c) a change in chemical exchange rate between the agent and water; d) a change in water accessibility; e) a change in ligand proximity; f) a change in electronic state.
Figure 2
Figure 2
Monitoring a T1 MRI contrast agent within in vivo tissues. a) An axial MR image of a xenograft tumor model of MDA-MB-231 mammary carcinoma before injection, and b) after injection of 0.1 mmol/kg of Gd-DTPA (Magnevist™) showed a brighter image in the tumor due to accumulation of the agent. c) The temporal change in T1-weighted MR signal of the tumor can be used to track the dynamic uptake of the agent in the tumor. (Pagel, unpublished results).
Figure 3
Figure 3
Monitoring a T2* MRI contrast agent within in vivo tissues. a) A brain MR image (with nonbrain areas masked) of an intracerebral mouse tumor model before injection, and b) after injection of 26.9 μg Fe/g of Feridex® showed a darker image in the tumor due to accumulation of the agent. c) The temporal change in T2*-weighted MR signal was used to track the enhanced uptake of the agent in the tumor, relative to lower uptake in the contralateral side of the brain. Reproduced with permission from (30).
Figure 4
Figure 4
Monitoring a CEST MRI contrast agent within in vivo tissues. a) An axial MR image of a xenograft tumor model of MDA-MB-231 mammary carcinoma before injection showed the location of the tumor. b) The MR signals from the tumor region were measured in images acquired with a series of selective saturation frequencies, which were used to create a CEST spectrum. The CEST effects at 5.6 and 4.2 ppm arose from the exchangeable amide protons of the CEST agent, and the decreased water signal shown at 0 ppm arose from direct saturation of water. (Chen, Howison and Pagel, unpublished results).
Figure. 5
Figure. 5
Monitoring two 19F nanoemulsions during an in vivo MRI study. a) The 19F MRI results of a mouse model with a MDA-MB-231 tumor after co-injection of perfluorocrownether (PCE) and perfluorooctane (PFO) showed accumulation of each agent in the tumor tissue. The time point in units of minutes is listed below each image. b) A 1H MR image (grayscale) provides an anatomical reference for the 19F MRI signal (green), which demonstrates that a region of the tumor showed substantial 19F MR signal. C) The 19F concentrations of PCE and PFO show a similar temporal dependence in tumor tissue. Reproduced with permission from (37).
Fig. 6
Fig. 6
Montoring a hyperpolarized 13C MRS agent during an in vivo MR study. A) Serial 13C MR spectra recorded every 3 seconds following addition of hyperpolarized 3,5-DFBGlu to 10 units of carboxypeptidase G2 were used to generate b) integrals of the parent peak 1 and its metabolic product 1′, which showed dynamic changes due to carboxypeptidase G2 activity. Reproduced with permission from (100).
Figure 7
Figure 7
Responsive MRI contrast agents can detect enzyme activities using a multistep approach. a) β-galactosidase hydrolyzes a β-galactopyranose ligand, forming a reactive phenolate anion that binds the contrast agent to a protein, slowing the tumbling time of the contrast agent and decreasing T1 relaxation time constant (59). b) β-galactosidase hydrolyzes the same ligand on CEST agent, forming an electron donating group that promotes aromatic delocalization that creates an amine group that can generate CEST (55). c) β-galactosidase-catalyzed hydrolysis of the same ligand creates a tyrosine ligand that can be polymerized by tyrosinase, creating a large molecular system with a slower tumbling time with decreased T1 relaxation time constant (62). d) Secreted alkaline phosphatase de-phosphorylates 2′-AMP to create adenosine, which can disrupt a DNA duplex that links SPIONs, which increases T2* relaxation time constant. Figure 7d was reproduced with permission from (80).
Figure 8
Figure 8
Protein detection with hyperpolarized 129Xe MRS. A xenon-binding cryptophane with a p-benzenesulfonamide ligand (right) can noncovalently bind to carbonic anhydrase IX (left). The binding causes a 3.2 ppm shift in the 129Xe MR spectrum, from 63.7 ppm for the unbound agent to 66.9 ppm for the bound agent (center). Reproduced with permission from reference (101).
Figure 9
Figure 9
Nucleic acid detection with a T2* MRI contrast agent. A) Intercalation of the agent’s ligands into the DNA double helix causes aggregation of the iron oxide nanoparticles. b) The aggregation decreases r2 relaxivity (circles) that indicates an increase in the T2* relaxation time constant. The r1 relaxivity (triangles) also decreased following aggregation. Reproduced with permission from reference (105).
Figure 10
Figure 10
Detecting a metabolite with a responsive MRI contrast agent. The BM3h-8C8 agent was developed through directed evolution to bind dopamine to the protein’s heme group. a) A coronal MR image from a rat injected with BM3h-8C8 in the presence (orange dashed circle) or absence (blue dashed circle) of equimolar dopamine. MRI hyperintensity is noticeable near the tip of the dopamine-free cannula, indicating a short T1 relaxation time constant, while the lack of hyperintensity at the dopamine cannula indicates a long T1 relaxation time constant for the system in the presence of this agent. b,c) The temporal change in T1-weighted MRI signal shows a relative decrease in T1-weighting in the presence of dopamine (orange) in the rat treated with BM3h-8C8 relative to the rat treated with the wildtype BM3h protein that does not bind to dopamine. Reproduced with permission from reference (121).
Figure 11
Figure 11
Detection of in vivo redox state with a responsive MRI contrast agent. T1-weighted MR images were acquired 2 minutes after injection of the nitroxide. a) Reduction of the nitroxide in the tumor tissue caused a loss of MR contrast due to a longer T1 relaxation time constant. b) The reduction of the nitroxide causes a loss of the radical form. c) The same study was performed with a healthy brain, which showed highly reducing activity that caused a loss of MR contrast from the agent in the brain. Reproduced with permission from reference (126).
Figure 12
Figure 12
Responsive MRI contrast agents that detect zinc. a) The ligand of a Gd(III) chelate changes conformation when the ligand binds to Zn2+, which improves water access to Gd(III) and decreases T1 relaxation time constant (142). b) Two ligands of a Eu(III) chelate change conformation when the ligands bind to Zn2+, which accelerates the chemical exchange of water coordinated to the Eu(III) and improves CEST (150).
Figure 13
Figure 13
A MRI contrast agent that measures extracellular pH within in vivo tumor tissue. a) 2-dimensional and 3-dimensional models of Yb-DO3A-oAA shows that the proximity of Yb(III) to the amide and the amine causes a shift in the magnetic resonance frequencies of these labile protons, which facilitates CEST MRI studies. b) The CEST effects from the amide and amine are dependent on pH. c) A log10 ratio of the CEST effects is linearly related to pH. d) A parametric pH map of a mouse tumor model overlaid on an anatomic MR image shows an acidic extracellular environment in the tumor region. The agent was directly injected into the tumor tissue to generate strong CEST signals in the tumor. Significant CEST signals were not detected elsewhere in the mouse model. Reproduced with permission from (174).
Figure 14
Figure 14
Temperature measurement with CEST MRI. A) The chemical structure of Tm-DOTA-Gly-Lys shows amide protons that are proximal to the Tm(III) metal. B) This proximity causes a highly shifted CEST effect at −50 ppm. C) The linewidth of this CEST effect is correlated with temperature. D) The linewidth of the CEST peak in an in vivo CEST spectrum e) can be used to generate a parametric map of in vivo temperature. Reproduced with permission from reference (175).
Figure 15
Figure 15
A unique light-responsive MRI contrast agent with a merocyanine motif (right) can be converted to a spiropyran motif (left) with light at 563 nm wavelength, which increases the T1 relaxation time constant (134).
Figure 16
Figure 16
The distributions of responsive MRI contrast agents. 117 responsive MRI contrast agents were reported in 2005–2014, and have been categorized with regard to a) detection mechanism and b) biomarker. c) The distribution of 171 responsive MRI contrast agents reported in this current review and our previous review (17) is also shown.

References

    1. Lauterbur PC. All science is interdisciplinary – From magnetic moments to molecules to men (Nobel lecture) Angew Chemie Int Ed. 2005;44(7):1004–1011. doi: 10.1002/anie.200462400. - DOI - PubMed
    1. Smith-Bindman R, Miglioretti DL, Johnson E, Lee C, Feigelson HS, Flynn M, Greenlee RT, Kruger RL, Hornbrook MC, Roblin D, Solberg LI, Vanneman N, Weinmann S, Williams AE. Use of diagnostic imaging studies and associated radiation exposure for patients enrolled in large integrated health care systems, 1996–2010. J Am Med Assoc. 2012;307(22):2400–2409. doi: 10.1001/jama.2012.5960. - DOI - PMC - PubMed
    1. Organisation for Economic Co-operation and Development. Health at a glance 2011: OECD indicators. OECD Publishing; Paris, France: 2011.
    1. Young IR, Clarke GJ, Bailes DR, Pennock JM, Doyle FH, Bydder GM. Enhancement of relaxation rate with paramagnetic contrast agents in NMR imaging. J Comput Tomogr. 1981;5(6):543–547. - PubMed
    1. Brady TJ, Goldman MR, Pykett IL, Buonanno FS, Kistler JP, Newhouse JH, Burt CT, Hinshaw WS, Pohost GM. Proton nuclear magnetic resonance imaging of regionally ischemic canine hearts: Effect of paramagnetic proton signal enhancement. Radiol. 1982;144(2):343–347. - PubMed

Publication types

MeSH terms