

Evaluation of the cell survival curve under radiation exposure based on the kinetics of lesions in relation to dose-delivery time
- PMID: 25355708
- PMCID: PMC4572602
- DOI: 10.1093/jrr/rru090
Evaluation of the cell survival curve under radiation exposure based on the kinetics of lesions in relation to dose-delivery time
Abstract
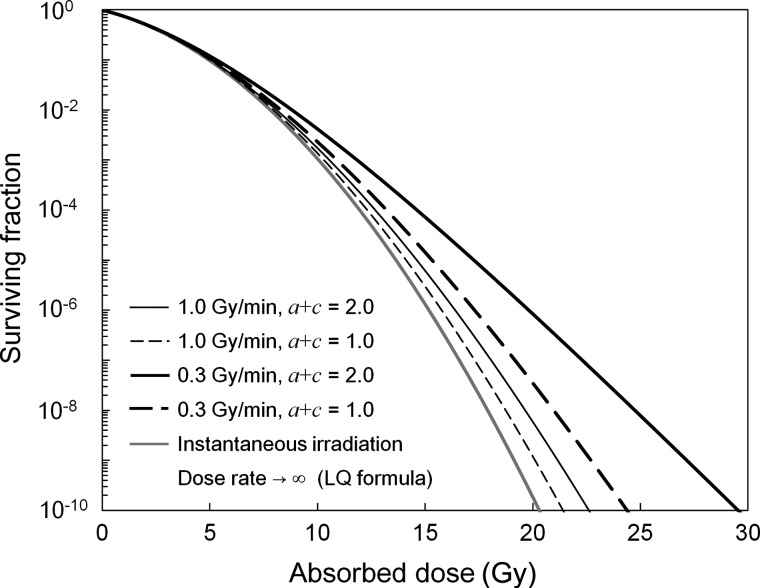
We have investigated the dose rate effects on cell damage caused by photon-beam irradiation. During a relatively long dose-delivery time with a low dose rate, lesions created in cells may undergo some reactions, such as DNA repair. In order to investigate these reactions quantitatively, we adopted the microdosimetric-kinetic (MK) model and deduced a cell surviving fraction (SF) formula for continuous irradiation. This model enabled us to estimate the SF from dose and dose rate. The parameters in the MK model were determined so as to generate the SF, and we attempted to evaluate the dose rate effects on the SF. To deduce the cell-specific parameters in the SF formula, including the dose rate, we performed a split-dose experiment and a single-dose experiment with a constant dose-delivery time (10 min) (to retain the condition for equivalent behavior of cell lesions) by means of a clonogenic assay. Then, using the MK model parameters, the SFs were reproduced for a variety of dose rates (1.0, 0.31, 0.18, 0.025 and 0.0031 Gy/min) and were compared with reported experimental data. The SF curves predicted by the MK model agreed well with the experimental data, suggesting that the dose rate effects appear in the kinetics of cell lesions during the dose-delivery time. From fitting the analysis of the model formula to the experimental data, it was shown that the MK model could illustrate the characteristics of log-SF in a rectilinear form at a high dose range with a relatively low dose rate.
Keywords: continuous irradiation; dose rate effects; linearity of high dose region; microdosimetric–kinetic model.
© The Author 2014. Published by Oxford University Press on behalf of The Japan Radiation Research Society and Japanese Society for Radiation Oncology.
Figures


References
-
- ICRP. 1990 recommendations of the International Commission on Radiological Protection ICRP Publication 60. Ann ICRP. 1991;21:1–201. - PubMed
-
- Joiner M, van der Kogel AJ. The dose-rate effect. In: Joiner M, van der Kogel AJ, editors. Basic Clinical Radiobiology. London: Edward Arnold; 2009. pp. 158–68.
Publication types
MeSH terms
LinkOut - more resources
Full Text Sources
Other Literature Sources
Research Materials
