. 2014 Nov 11;111(45):E4896-905.
doi: 10.1073/pnas.1411117111. Epub 2014 Oct 29.

Activity-dependent PI(3,5)P2 synthesis controls AMPA receptor trafficking during synaptic depression

Affiliations

Activity-dependent PI(3,5)P2 synthesis controls AMPA receptor trafficking during synaptic depression

Amber J McCartney et al. Proc Natl Acad Sci U S A. .

Abstract

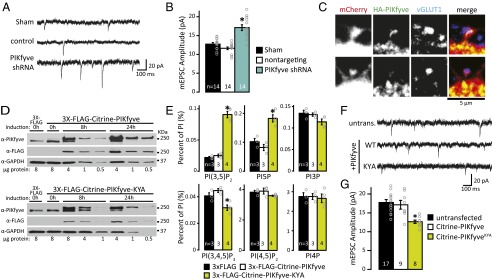
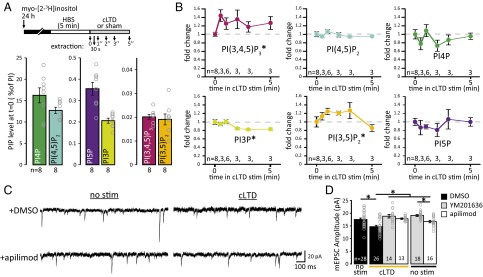
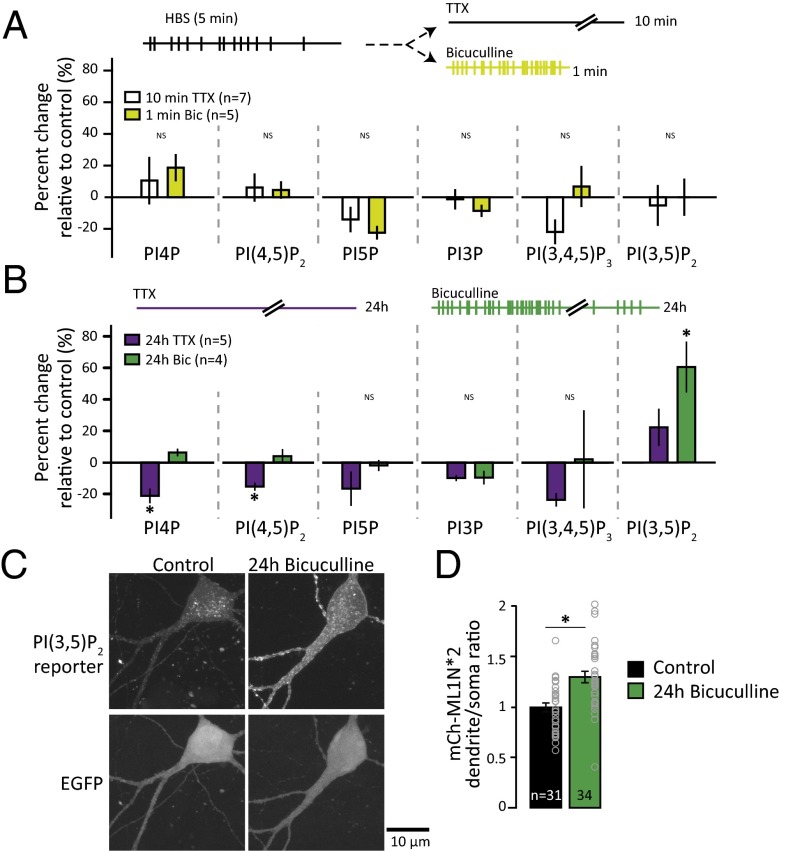
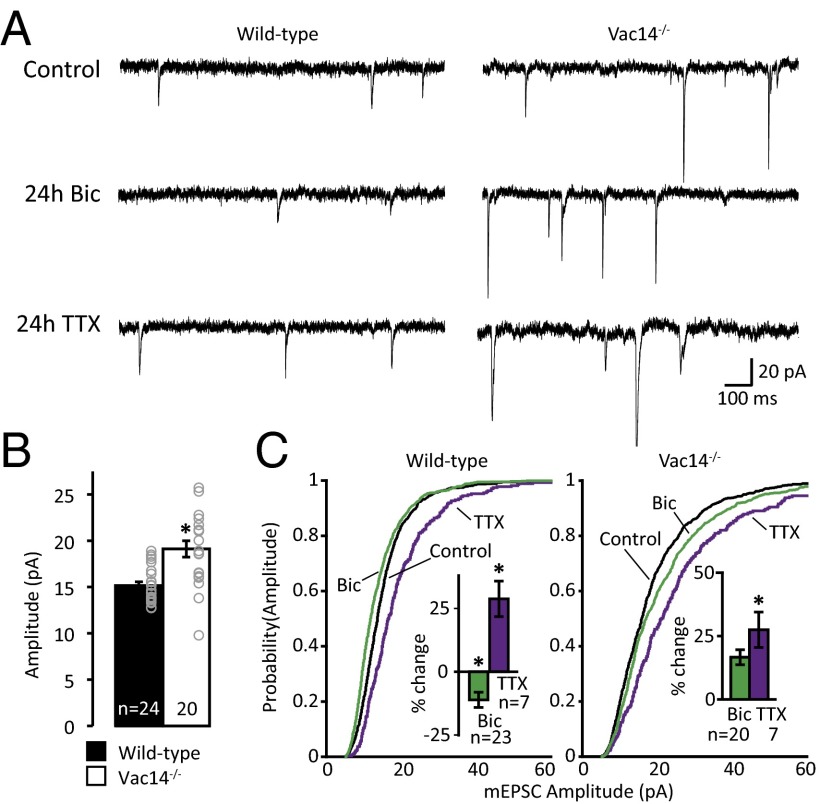
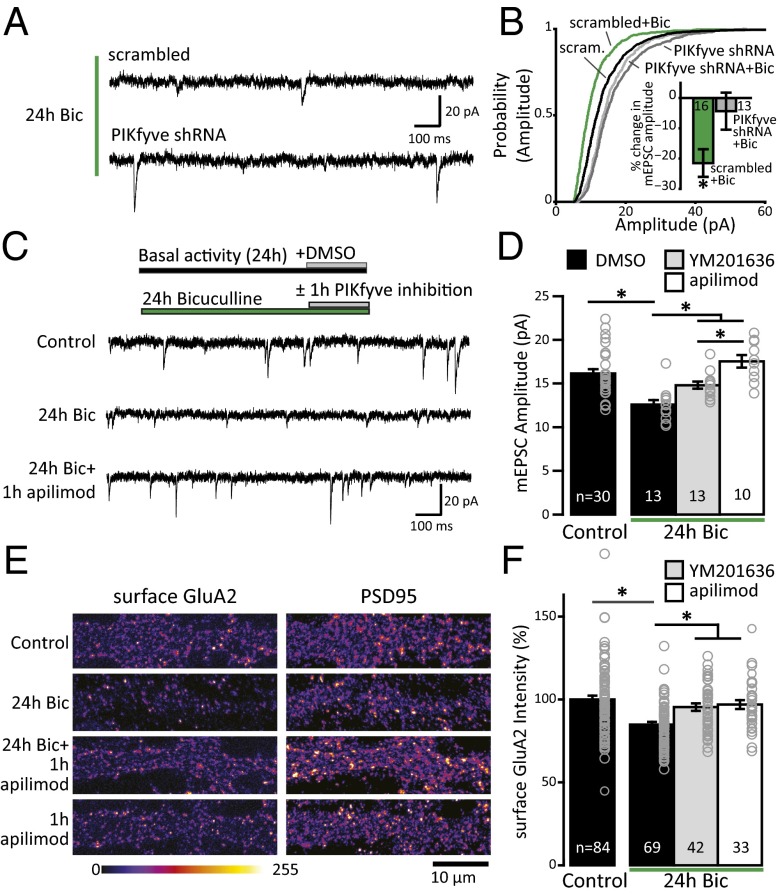
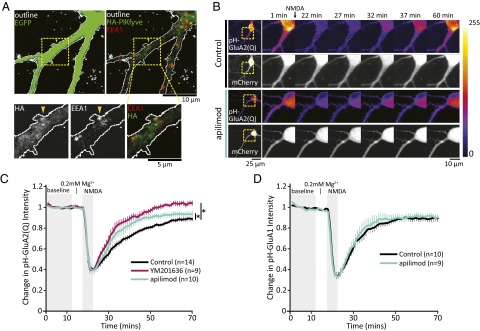
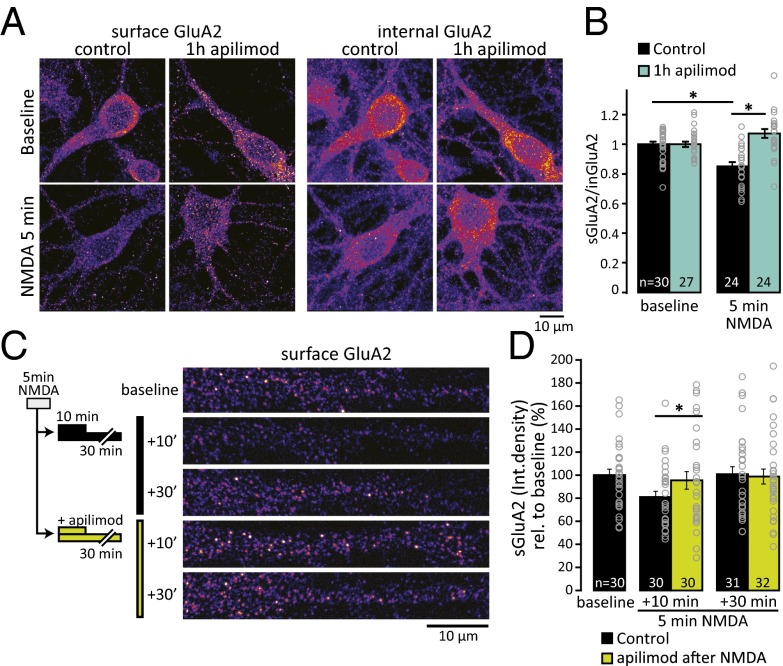
Dynamic regulation of phosphoinositide lipids (PIPs) is crucial for diverse cellular functions, and, in neurons, PIPs regulate membrane trafficking events that control synapse function. Neurons are particularly sensitive to the levels of the low abundant PIP, phosphatidylinositol 3,5-bisphosphate [PI(3,5)P2], because mutations in PI(3,5)P2-related genes are implicated in multiple neurological disorders, including epilepsy, severe neuropathy, and neurodegeneration. Despite the importance of PI(3,5)P2 for neural function, surprisingly little is known about this signaling lipid in neurons, or any cell type. Notably, the mammalian homolog of yeast vacuole segregation mutant (Vac14), a scaffold for the PI(3,5)P2 synthesis complex, is concentrated at excitatory synapses, suggesting a potential role for PI(3,5)P2 in controlling synapse function and/or plasticity. PI(3,5)P2 is generated from phosphatidylinositol 3-phosphate (PI3P) by the lipid kinase PI3P 5-kinase (PIKfyve). Here, we present methods to measure and control PI(3,5)P2 synthesis in hippocampal neurons and show that changes in neural activity dynamically regulate the levels of multiple PIPs, with PI(3,5)P2 being among the most dynamic. The levels of PI(3,5)P2 in neurons increased during two distinct forms of synaptic depression, and inhibition of PIKfyve activity prevented or reversed induction of synaptic weakening. Moreover, altering neuronal PI(3,5)P2 levels was sufficient to regulate synaptic strength bidirectionally, with enhanced synaptic function accompanying loss of PI(3,5)P2 and reduced synaptic strength following increased PI(3,5)P2 levels. Finally, inhibiting PI(3,5)P2 synthesis alters endocytosis and recycling of AMPA-type glutamate receptors (AMPARs), implicating PI(3,5)P2 dynamics in AMPAR trafficking. Together, these data identify PI(3,5)P2-dependent signaling as a regulatory pathway that is critical for activity-dependent changes in synapse strength.

Keywords: Fab1; PIKfyve; Vac14; phosphatidylinositol lipids; synaptic plasticity.


Conflict of interest statement

The authors declare no conflict of interest.

Figures

Fig. 1.
Fig. 1.
PIKfyve activity regulates synaptic responses. (A) Representative mEPSC recordings from WT mouse neurons 1 wk after lentiviral transduction with vehicle control (sham), nontargeting control shRNA, or PIKfyve shRNA. (B) Mean (±SEM) mEPSC amplitude. Knocking down PIKfyve increased mEPSC amplitude [sham: 12.73 ± 0.40 pA, control shRNA: 11.63 ± 0.35 pA, PIKfyve shRNA: 17.11 ± 0.77 pA; one-way ANOVA: F(2,39) = 29.00, P = 1.9 × 10⁻⁸]. (C) Representative confocal image showing HA-PIKfyve in proximity to excitatory synapses. Neurons were transfected with mCherry and HA-PIKfyve before fixing and staining for HA-PIKfyve and presynaptic glutamatergic terminals (vGLUT1). HA-PIKfyve is found inside (Top) and at the base (Bottom) of spines with an opposed presynaptic terminal. (D) Representative Western blots depicting doxycycline-dependent induction of 3× FLAG control, 3× FLAG-Citrine-PIKfyve (Top) or 3× FLAG-Citrine-PIKfyveKYA (Bottom) in stable cell lines (HEK 293). Cells were induced for 0, 8, or 24 h before lysis and analyzed by Western blot. Immunoblotting for PIKfyve shows two bands, consistent with detection of endogenous PIKfyve and 3× FLAG-Citrine-PIKfyve or 3× FLAG-Citrine-PIKfyveKYA. (E) Mean (±SEM) PIP levels relative to total PI. Induction of 3× FLAG-Citrine-PIKfyveKYA for 24 h increases PI(3,5)P2 and PI5P levels [PI(3,5)P2: 3× FLAG: 0.022 ± 0.001%, 3× FLAG-Citrine-PIKfyve: 0.025 ± 0.002%, 3× FLAG-Citrine-PIKfyveKYA: 0.093 ± 0.005%; one-way ANOVA: F(2,7) = 105.44, P = 5.9 × 10⁻⁶]. [PI5P: 3× FLAG: 0.102 ± 0.011%, 3× FLAG-Citrine-PIKfyve: 0.082 ± 0.011%, 3× FLAG-Citrine-PIKfyveKYA: 0.185 ± 0.012%; one-way ANOVA: F(2,7) = 21.63, P = 0.001]. (F) Representative recordings from cultured rat hippocampal neurons [21 days in vitro (DIV)] transfected at DIV14 with Citrine-PIKfyve or Citrine-PIKfyveKYA. untrans., untransfected. (G) Mean (±SEM) mEPSC amplitude of untransfected and transfected neurons expressing Citrine-PIKfyve or Citrine-PIKfyveKYA. PIKfyveKYA expression decreased mEPSC amplitude [untransfected: 17.75 ± 0.78 pA, Citrine-PIKfyve: 17.14 ± 1.16 pA, Citrine-PIKfyveKYA: 12.65 ± 0.43 pA; one-way ANOVA: F(2,31) = 17.32, P = 0.0005]. *P < 0.05.
Fig. 2.
Fig. 2.
PIKfyve activity is required for NMDAR-dependent cLTD. (A) Schematic of experimental design. Samples were collected during cLTD induction (20 μM NMDA, 1 μM glycine, 0.2 mM Mg2+) at 30 s, 1 min, 2 min, 3 min, or 5 min. Mean (±SEM) PIP levels at time point 0. (B) Mean (±SEM) levels for each PIP normalized to 0 min. The induction of cLTD evokes a dynamic change in the levels of three PIPs. The distributions of each PIP level during the stimulation were compared with baseline values (0 min) using a two-sample Kolmogorov–Smirnov test (K-S test). PI(3,5)P2 levels transiently rise between 30 s and 3 min (K-S test: D = 0.55, P = 0.026). PI(3,4,5)P3 levels remain elevated during cLTD stimulus (K-S test: D = 0.65, P = 0.0045). The levels of PI3P decrease after 2 min of the cLTD stimulus (K-S test: D = 0.75, P = 0.0037). For PI4P, PI(4,5)P2, and PI5P, levels during the stimulus are from the same continuous distribution as at baseline. (C) Representative recording of mEPSCs. After cLTD or sham stimulation, neurons were incubated with reserved conditioned media without PIKfyve inhibitors for 30 min at 37 °C. (D) Mean (±SEM) mEPSC amplitude after stimulation in the presence or absence of 1 μM apilimod or 2 μM YM201636. The amplitude decreased after induction of cLTD, which was blocked by incubation with 1 μM apilimod or 2 μM YM201636 [control: 17.52 ± 0.55 pA, cLTD: 14.72 ± 0.53 pA, cLTD + YM201636: 18.83 ± 0.71 pA, cLTD + apilimod: 17.86 ± 0.30 pA; 7.5 min of YM201636: 19.11 ± 0.37 pA, 7.5 min of apilimod: 16.72 ± 0.48 pA; one-way ANOVA: F(5,109) = 9.77, P = 9.8 × 10⁻⁸]. *P < 0.05. stim, stimulus.
Fig. 3.
Fig. 3.
PI(3,5)P2 synthesis accompanies homeostatic synaptic weakening following prolonged hyperactivity. (A) Schematic of experimental design. Neurons were metabolically labeled with [3H]-inositol for 24 h. The media were replaced with Hepes-buffered saline (HBS). After 5 min, HBS was replaced with HBS + 2 μM TTX for 10 min or 50 μM bicuculline for 1 min and lipids were extracted. For each experiment, unstimulated controls (5 min of HBS) were collected and the mean (±SEM) PIP level after incubation with TTX or bicuculline is expressed as a percentage of the control (5 min of HBS). (B) Schematic of experimental design. Neurons were metabolically labeled with [3H]-inositol for 24 h in the presence of DMSO control, 2 μM TTX, or 50 μM bicuculline. The mean (±SEM) percent change in PIP levels relative to control from neurons incubated with 2 μM TTX (n = 5) or 50 μM bicuculline (n = 4) for 24 h is shown. The level of PI4P decreased after 24 h of TTX [percent change: −21.26 ± 1.77%; one-way ANOVA: F(2,11) = 15.2, P = 0.0007]. The level of PI(4,5)P2 decreased after 24 h of TTX [percent change: −15.34 ± 2.45%; one-way ANOVA: F(2,11) = 6.54, P = 0.014]. The level of PI(3,5)P2 increased after 24 h of bicuculline [percent change: 60.49 ± 16.05%; one-way ANOVA, F(2,11) = 7.13, P = 0.01]. (C) Representative images of neurons expressing the PI(3,5)P2 reporter, mCherry-ML1N*2, and GFP. (D) Mean (±SEM) ratio of dendritic mCherry-ML1N*2 fluorescence to soma mCherry-ML1N*2 fluorescence. The dendritic-to-soma ratio of mCherry-ML1N*2 intensity increased after 24 h of bicuculline [control: 1.0 ± 0.04, 24 h of bicuculline: 1.30 ± 0.06; t test: t(63) = 4.12, P = 0.0001]. *P < 0.05.
Fig. 4.
Fig. 4.
PIKfyve activity is required for synaptic depression. (A) Representative example recordings from WT and Vac14−/− mouse hippocampal cultured neurons treated for 24 h with vehicle, 2 μM TTX, or 50 μM bicuculline (Bic). (B) Mean (±SEM) mEPSC amplitude. The amplitude of Vac14−/− mEPSCs is increased relative to WT [WT: 15.16 ± 0.39 pA, Vac14−/−: 19.12 ± 0.88 pA; t(43) = 31.04, P = 4.45 × 10⁻³¹]. (C) Cumulative distribution frequency of mEPSC amplitude from WT (Left) and Vac14−/− (Right) neurons treated for 24 h with vehicle control (black line), 2 μM TTX (purple line), or 50 μM Bic (green line). In WT neurons, the distribution of mEPSC amplitude is left-shifted following 24 h of Bic and right-shifted following 24 h of TTX. Although Vac14−/− neurons normally scale-up mEPSC amplitude in response to 24 h of TTX, they fail to scale-down. All six distributions were compared using the one-way Kruskal–Wallis ANOVA [χ2(5, n = 4,016) = 411.56, P = 9.6 × 10−87] and the results of Tukey–Kramer post hoc test reported here: WT + Bic is different from every group. WT + TTX is different from WT. Vac14−/− + TTX is different from every group. WT control is different from Vac14−/− control. (Insets) Mean (±SEM) percent change in mEPSC amplitude relative to unstimulated controls of the corresponding genotype. In WT neurons, 24 h of treatment with TTX increases mEPSC amplitude and 24 h of treatment with Bic decreases mEPSC amplitude [WT, percent change from control (n = 24): +TTX: 28.79 ± 6.99% (n = 7), +Bic: −11.11 ± 2.97% (n = 23); one-way ANOVA: F(2,51) = 21.41, P = 1.8 × 10⁻⁷]. In Vac14−/− neurons, 24 h of treatment with TTX increases mEPSC amplitude but 24 h of treatment with Bic does not decrease mEPSC amplitude [Vac14−/−, percent change from control (n = 20): +TTX: 24.28 ± 8.99% (n = 7), +Bic: 13.72 ± 6.03% (n = 20); one-way ANOVA: F(2,45) = 4.06, P = 0.02]. *P < 0.05.
Fig. 5.
Fig. 5.
Loss of PI(3,5)P2 synthesis reverses homeostatic synaptic depression. (A) Representative recordings of mEPSCs from mouse cultured hippocampal neurons infected with scrambled or PIKfyve shRNA for 1 wk and then treated with 50 μM Bic for 24 h. (B) Cumulative distribution frequency of mEPSC amplitude is scaled-down after 24 h of Bic treatment in scrambled (scram) but not PIKfyve shRNA-expressing neurons [one-way Kruskal–Wallis ANOVA: χ2(3, n = 2,486) = 331.7963, P = 1.3 × 10−71; Tukey–Kramer post hoc results: scrambled + 24 h of Bic is different from each group, and PIKfyve-shRNA and PIKfyve-shRNA + 24 h of Bic are different from scrambled but not different from each other]. (Inset) Mean percent change (±SEM) in mEPSC amplitude relative to untreated neurons. Treatment with 50 μM Bic for 24 h decreases mEPSC amplitude in scrambled but not PIKfyve-shRNA–expressing neurons [scrambled + Bic: −21.50 ± 4.57% change from scrambled, PIKfyve-shRNA + Bic: −4.33 ± 6.11% change from PIKfyve-shRNA; one-way ANOVA, F(3,79) = 5.17, P = 0.0026]. (C) Representative recordings of mEPSCs from rat cultured hippocampal neurons treated or untreated with 50 μM Bic for 24 h. After 23 h, the PIKfyve inhibitor apilimod or YM201636 was added for 1 h. (D) Mean (±SEM) mEPSC amplitude. Treatment with 50 μM Bic for 24 h decreases mEPSC amplitude. Application of 1 μM apilimod or 2 μM YM201636 for 1 h does not affect the amplitude of mEPSCs in control neurons not treated with Bic. Application of 1 μM apilimod or 2 μM YM201636 for 1 h in Bic-treated neurons restores mEPSC amplitude to control levels [control + DMSO: 16.15 ± 0.49 pA, 24 h of Bic + DMSO: 12.58 ± 0.50 pA, 24 h of Bic + YM201636: 14.80 ± 0.41 pA, 24 h of Bic + apilimod: 17.53 ± 0.73 pA; one-way ANOVA: F(3,51) = 13.9, P = 9.6 × 10⁻⁷]. (E) Representative images of sGluA2 and PSD-95 staining with or without 50 μM Bic for 24 h. Neurons were live-labeled with an aminoterminal antibody for the GluA2 subunit. After permeabilization, the cells were stained for PSD-95. Intensity is presented in the “fire” lookup table color scheme. (F) Mean (±SEM) sGluA2 intensity quantified in the first 50 μm of dendrite relative to control. Treatment with Bic for 24 h decreased the abundance of sGluA2, which was restored to control levels within 1 h by PIKfyve inhibition with either 1 μM apilimod or 2 μM YM201636 [control: 100 ± 2.29%, 24 h of Bic: 83.71 ± 1.97, 24 h of Bic + 1 h of YM201636: 95.41 ± 2.27%, 24 h of Bic + 1 h of apilimod: 96.94 ± 2.68%, one-way ANOVA: F(3,224) = 11.16, P = 7.5 × 10⁻⁷]. *P < 0.05.
Fig. 6.
Fig. 6.
PIKfyve activity regulates AMPAR trafficking. (A) Representative images of neurons transfected with EGFP and HA-PIKfyve, and stained to mark early endosomes (EEA1). The dashed box indicates the enlarged regions below. The yellow arrowheads indicate an example of HA-PIKfyve colocalizing with EEA1 at the base of a dendritic spine. (Top Left) Z-projected images of a neuron expressing EGFP (green, outlined in white). (Top Right) Merged 0.41-μm slice of HA-PIKfyve (green) and EEA1 (red). (B) Representative images of neurons cotransfected with pH-GluA2(Q) and mCherry. Neurons were incubated with DMSO or PIKfyve inhibitors for 1 h before live confocal imaging. During imaging, all solutions were continuously perfused at 32 °C. (C) Mean (±SEM) intensity of pH-GluA2(Q) relative to the mean intensity of the first 10 min of imaging. Once a stable baseline was obtained, HBS (0.2 mM Mg2+) was washed for 5 min, followed by 5 min of stimulation with NMDA (20 μM NMDA, 10 μM glycine, 0.2 mM Mg2+), which quenches the fluorescence of pH-GluA2(Q). After NMDA stimulation, normal HBS was continuously perfused for the remainder of the experiment. PIKfyve inhibition by either 1 μM apilimod or 2 μM YM201636 enhances the rate of pH-GluA2(Q) fluorescence recovery [Kruskal–Wallis ANOVA: χ2(2, 2,146) = 137.27, P = 1.6 × 10⁻³⁰]. (D) Mean (±SEM) intensity of pH-GluA1 relative to the mean intensity of the first 10 min of imaging. The fluorescence of pH-GluA1 is strongly quenched by NMDA stimulation. Brief PIKfyve inhibition does not have an impact on the rate of recovery. *P < 0.05.
Fig. 7.
Fig. 7.
PIKfyve inhibition blocks activity-dependent trafficking of GluA2. (A) Representative images of neurons stained for surface or internal GluA2. (B) Ratio (±SEM) of surface GluA2 to internal GluA2. The sGluA2/inGluA2 ratio is reduced by 5 min of NMDA stimulation (20 μM NMDA, 10 μM glycine, 0.2 mM Mg2+) in control neurons. Incubation with 1 μM apilimod blocks this decrease [relative to average baseline; baseline: 1.0 ± 0.02; 5 min of NMDA: 0.86 ± 0.03, 1 h of apilimod: 1.0 ± 0.02, 1 h of apilimod + 5 min of NMDA: 1.07 ± 0.03; one-way ANOVA, F(3,101) = 14.68, P = 5.26 × 10⁻⁸]. (C) Schematic of experimental design and representative images of sGluA2 staining in dendrites. After 5 min of NMDA stimulation, PIKfyve was inhibited by 1 μM apilimod for 10 min or 30 min before staining for sGluA2. (D) Mean (±SEM) sGluA2 puncta integrated density (mean intensity × puncta size) relative to unstimulated baseline. After 10 min, GluA2 is decreased in control but not in apilimod-treated neurons [NMDA + 10 min: 78.43 ± 5.46%, NMDA + 30 min: 95.47 ± 7.62%, NMDA + 10 min with apilimod: 100 ± 6.47%, NMDA + 30 min with apilimod: 98.84 ± 6.47%; Kruskal–Wallis ANOVA: χ2 (4,154) = 12.1, P = 0.017]. *P < 0.05.

References

    1. Di Paolo G, De Camilli P. Phosphoinositides in cell regulation and membrane dynamics. Nature. 2006;443(7112):651–657. - PubMed
    1. Balla T. Phosphoinositides: Tiny lipids with giant impact on cell regulation. Physiol Rev. 2013;93(3):1019–1137. - PMC - PubMed
    1. McCartney AJ, Zhang Y, Weisman LS. Phosphatidylinositol 3,5-bisphosphate: Low abundance, high significance. BioEssays. 2014;36(1):52–64. - PMC - PubMed
    1. Chow CY, et al. Mutation of FIG4 causes neurodegeneration in the pale tremor mouse and patients with CMT4J. Nature. 2007;448(7149):68–72. - PMC - PubMed
    1. Duex JE, Nau JJ, Kauffman EJ, Weisman LS. Phosphoinositide 5-phosphatase Fig 4p is required for both acute rise and subsequent fall in stress-induced phosphatidylinositol 3,5-bisphosphate levels. Eukaryot Cell. 2006;5(4):723–731. - PMC - PubMed

Publication types

MeSH terms

Substances