. 2014 Dec 15;193(12):5894-903.
doi: 10.4049/jimmunol.1401752. Epub 2014 Oct 29.

CD28-CD80 interactions control regulatory T cell motility and immunological synapse formation

Affiliations

CD28-CD80 interactions control regulatory T cell motility and immunological synapse formation

Timothy J Thauland et al. J Immunol. .

Abstract

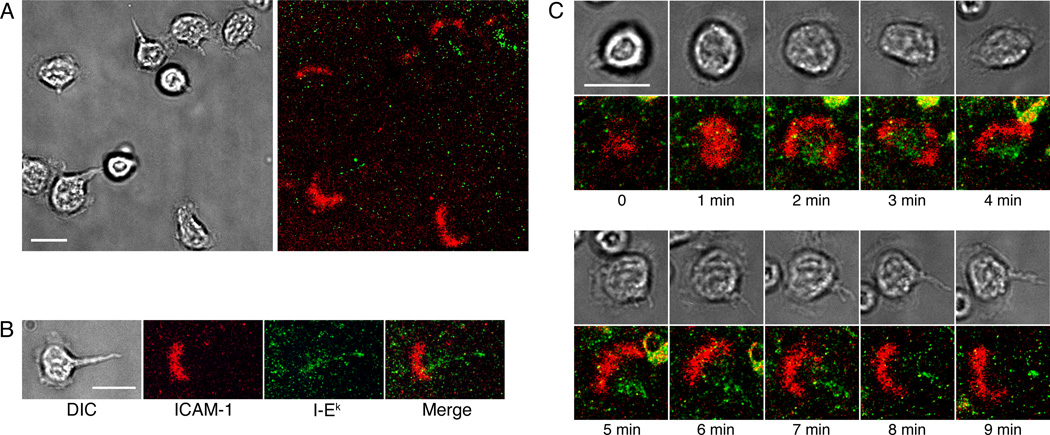
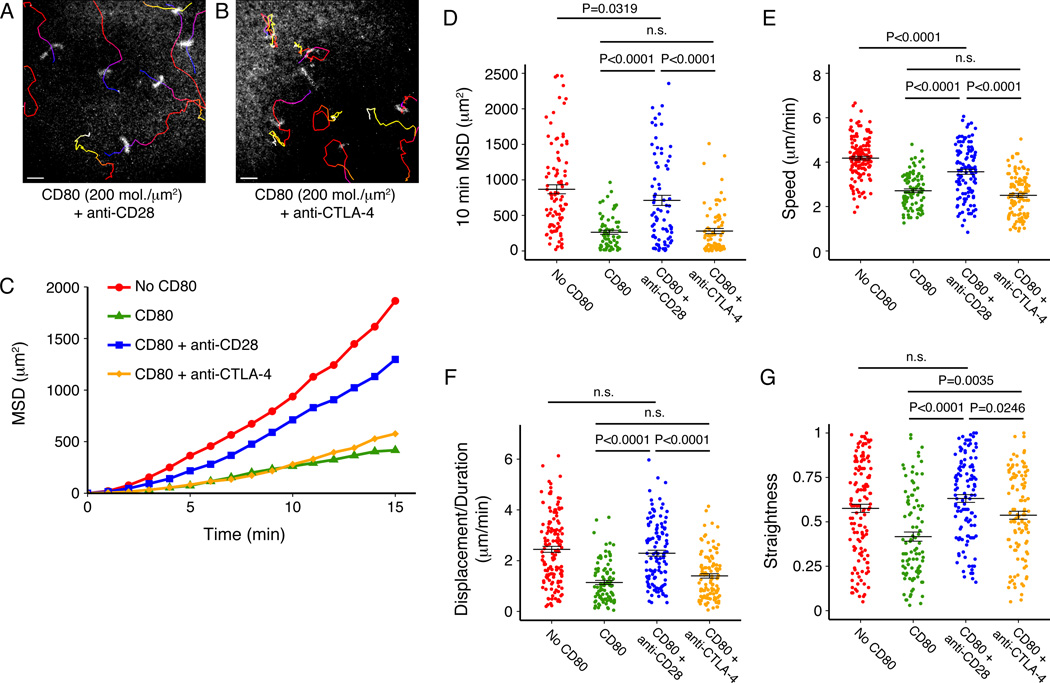
Regulatory T cells (Tregs) are essential for tolerance to self and environmental Ags, acting in part by downmodulating costimulatory molecules on the surface of dendritic cells (DCs) and altering naive CD4 T cell-DC interactions. In this study, we show that Tregs form stable conjugates with DCs before, but not after, they decrease surface expression of the costimulatory molecule CD80 on the DCs. We use supported planar bilayers to show that Tregs dramatically slow down but maintain a highly polarized and motile phenotype after recognizing Ag in the absence of costimulation. These motile cells are characterized by distinct accumulations of LFA-1-ICAM-1 in the lamella and TCR-MHC in the uropod, consistent with a motile immunological synapse or "kinapse." However, in the presence of high, but not low, concentrations of CD80, Tregs form stationary, symmetrical synapses. Using blocking Abs, we show that, whereas CTLA-4 is required for CD80 downmodulation, CD28-CD80 interactions are critical for modulating Treg motility in the presence of Ag. Taken together, these results support the hypothesis that Tregs are tuned to alter their motility depending on costimulatory signals.


Figures

Figure 1
Figure 1. Tregs modify DC phenotype, concomitant with a change in the stability of Treg-DC interactions
(A) TCR transgenic CD4 T cells were cultured under Treg-polarizing conditions and expressed high levels of FoxP3 and CTLA-4 at day 4 post-stimulation. Naïve B10.BR CD4 T cells are shown for comparison. (B) Tregs were labeled with CFSE and introduced to BMDCs loaded with MCC peptide. The majority of Treg-DC interactions were stable. For further examples of stable Treg-DC contacts, see Movie 1. (C) 24 hrs after addition, the Tregs were highly motile and swarmed around BMDCs. (D) Fresh, CFSE-labeled Tregs were added to BMDCs 24 hrs after the addition of unlabeled Tregs. These freshly added Tregs had a polarized phenotype and crawled along the surface of BMDCs. Scale bars represent 10 µm. The still images shown in Fig. 1D are from Movie 2. (E–H) Tregs were incubated with BMDCs in the presence or absence of MCC peptide, and the BMDCs were assayed at 24 hrs for surface levels of CD80. The T cell:DC ratios were 1:1 (E), 5:1 (F) or 10:1 (G and H). Fab fragments of anti-CTLA-4 (G) or anti-CD28 (H) were included in the cultures at 100 µg/mL. Results are representative of three (B–D) or six (E–H) independent experiments.
Figure 2
Figure 2. Tregs form immunological kinapses on supported planar bilayers containing pMHC and ICAM-1
(A) Representative field of Tregs interacting with bilayers containing pMHC and ICAM-1. DIC (left) and fluorescence (right) images with pMHC (green) and ICAM-1 (red) are shown. (B) Representative image of a motile Treg with ICAM-1 accumulated in the mid-body of the cell and pMHC accumulation in the uropod. (C) Representative time-lapse images of the initial Treg-bilayer contact showing pMHC (green) and ICAM-1 (red). Tregs displayed a polarized phenotype rapidly upon contact with the bilayer. Scale bars represent 10 µm. Images are representative of seven independent experiments.
Figure 3
Figure 3. High concentrations of CD80 reduce the motility of Tregs
Tregs were introduced to bilayers containing pMHC, ICAM-1 and 0 (A), 40 (B) or 200 (C) molecules/µm2 of CD80. Time-coded tracks (blue to white from the beginning to the end of the experiment) are overlaid on ICAM-1 images. Scale bars represent 10 µm. The tracks shown are representative of four (A), two (B) or six (C) independent experiments. Movies 3, 4 and 5 are time-lapse videos of Tregs interacting with bilayers containing 0, 40 and 200 molecules/µm2 of CD80 respectively. (D) Mean square displacement (MSD) over time is plotted for three densities of CD80, and the MSD at 10 min is shown (E). The average speed (F), displacement/duration (G) and straightness (track displacement/length) (H) of Treg tracks on bilayers with 0, 40 or 200 molecules/µm2 of CD80 are shown. Results (D–H) are from one representative experiment of three with n=38, 52 and 41 for 0, 40 and 200 molecules/µm2 of CD80 respectively. Error bars represent SEM. One-way ANOVAs followed by Tukey’s HSD tests were used to determine P values. P>0.05 was considered not significant (n.s.). Scale bars represent 10 µm.
Figure 4
Figure 4. Treg-APC interactions have an altered phenotype in the presence of CD80
The percentage of Tregs that were either non-motile (A) or continuously motile (B) over the entire length of the experiment is shown. (C) An example of a cell transitioning from a motile phenotype to a stable IS. DIC (top) and fluorescence (bottom) images with pMHC (green) and ICAM-1 (red) are shown. (D) The percentage of cells that reformed IS over the length of an experiment. (E) An example of a cell attached to the bilayer via its uropod. The cell’s track is overlaid on DIC images. (F) The percentage of cells that were anchored by their uropods over the course of an experiment. Data in A, B, D and F show the mean of the fraction of cells displaying a given phenotype from two (40 molecules/µm2 CD80) or three (0 and 200 molecules/µm2 CD80) independent experiments with n=115, 87 and 129 for 0, 40 and 200 molecules/µm2 of CD80 respectively. Error bars represent SEM. One-way ANOVAs followed by Tukey’s HSD tests were used to determine P values. P>0.05 was considered not significant (n.s.). Scale bars represent 10 µm.
Figure 5
Figure 5. CD80 reduces the motility of nTregs on supported planar bilayers
(A) Naïve CD4 cells from B10.BR or AD10 mice were assayed for the expression of CD25 and FoxP3. (B and C) Naïve AD10 mice CD4 cells were purified from the spleens of AD10 X Foxp3-GFP mice and introduced to supported planar bilayers containing pMHC, ICAM-1 and 0 (B) or 200 (C) molecules/µm2 CD80. Time-coded tracks (blue to white from the beginning to the end of the experiment) are overlaid on ICAM-1 images. The movements of both nTregs (GFP+) and naïve CD4 cells (GFP) were followed over time, but only the nTreg tracks are shown here. Scale bars represent 10 µm. (D) Mean square displacement (MSD) over time is plotted for nTregs and naïve CD4 cells on bilayers lacking CD80 and on bilayers with 200 molecules/µm2 CD80. The MSD at 10 min and the fraction of cells with an MSD greater than 500 um2 are shown (E and F). The results are pooled from three experiments with n=48, 40, 73 and 77 for nTreg/No CD80, nTreg/CD80 200 molecules/µm2, naïve/No CD80 and naïve/CD80 200 molecules/µm2 respectively. Error bars represent SEM (E) or 95% confidence interval (F). P values were determined with a one-way ANOVA followed by Tukey’s HSD test (E) or Fisher’s exact test (F). Scale bars represent 10 µm.
Figure 6
Figure 6. Tregs migrate rapidly in the absence of cognate antigen
Tregs were introduced to bilayers containing ICAM-1 and I–Ek loaded with either MCC or irrelevant (Hb) peptides. (A) Representative time-coded tracks (blue to white from the beginning to the end of the experiment) of Tregs migrating on bilayers containing MHC loaded with Hb peptide overlaid on an ICAM-1 image are shown. Scale bar represent 10 µm. (B) Mean square displacement (MSD) over time is plotted for Tregs interacting with bilayers loaded with MCC or Hb peptide, and the MSD at 10 min is shown (C). The straightness (D), speed (E) and average displacement/duration (F) of Treg tracks on bilayers with MCC or Hb are shown. Results (B–F) are from one representative experiment of two with n=62 and 84 for MCC and Hb respectively. Error bars represent SEM. P values were determined with two-tailed Student’s t tests. Scale bars represent 10µm.
Figure 7
Figure 7. CD28-CD80 interactions are responsible for modulating Treg motility
Tregs were introduced to bilayers containing pMHC, ICAM-1 and 200 molecules/µm2 of CD80 in the presence of anti-CTLA-4 (A) or anti-CD28 (B) Fab antibodies. Time-coded tracks (blue to white from the beginning to the end of the experiment) are overlaid on ICAM-1 images. Scale bars represent 10 µm. The tracks shown are representative of two (A) or three (B) independent experiments. (C) Mean square displacement (MSD) over time is plotted for Tregs on bilayers lacking CD80 and on bilayers with 200 molecules/µm2 CD80 with or without anti-CTLA-4 and anti-CD28 Fab antibodies, and the MSD at 10 min is shown (D). The average speed (E), average displacement/duration (F) and straightness (track displacement/length) (G) of Treg tracks on bilayers with or without CD80 and Fab antibodies are shown. Results (C–G) are from one representative experiment of three with n=135, 92, 113 and 109 for No CD80, CD80, CD80 + anti-CD28 and CD80 + anti-CTLA-4 respectively. Error bars represent SEM. One-way ANOVAs followed by Tukey’s HSD tests were used to determine P values. P>0.05 was considered not significant (n.s.). Scale bars represent 10µm.

References

    1. Belkaid Y, Tarbell K. Regulatory T cells in the control of host-microorganism interactions. Annu Rev Immunol. 2009;27:551–589. - PubMed
    1. Sakaguchi S, Yamaguchi T, Nomura T, Ono M. Regulatory T cells and immune tolerance. Cell. 2008;133:775–787. - PubMed
    1. Fontenot JD, Gavin MA, Rudensky AY. Foxp3 programs the development and function of CD4(+)CD25(+) regulatory T cells. Nat Immunol. 2003;4:330–336. - PubMed
    1. Khattri R, Cox T, Yasayko SA, Ramsdell F. An essential role for Scurfin in CD4+CD25+ T regulatory cells. Nat Immunol. 2003;4:337–342. - PubMed
    1. Hori S, Nomura T, Sakaguchi S. Control of regulatory T cell development by the transcription factor foxp3. Science. 2003;299:1057–1061. - PubMed

Publication types

MeSH terms