

Therapeutic effects of globular adiponectin in diabetic rats with nonalcoholic fatty liver disease
- PMID: 25356056
- PMCID: PMC4209559
- DOI: 10.3748/wjg.v20.i40.14950
Therapeutic effects of globular adiponectin in diabetic rats with nonalcoholic fatty liver disease
Abstract
Aim: To explore the therapeutic role of globular adiponectin (gAd) in high-fat diet/streptozotocin (STZ)-induced type 2 diabetic rats with nonalcoholic fatty liver disease (NAFLD).
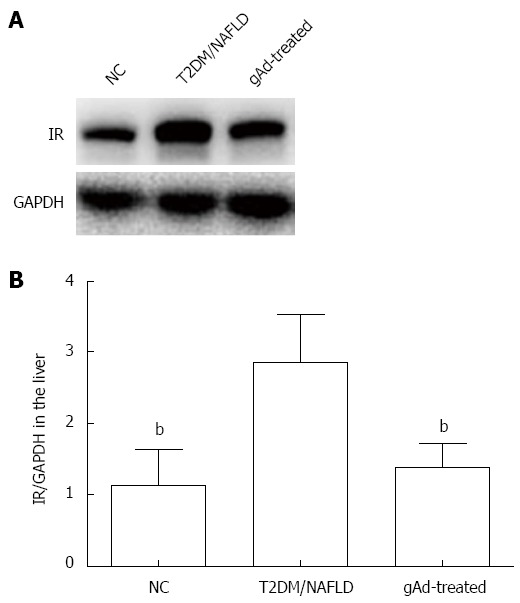
Methods: Seven rats were fed a basic diet (normal control group; NC) during the experiment. Experimental rats (14 rats) were given a high-fat diet for 4 wk and were then injected with STZ to induce type 2 diabetes mellitus (T2DM) and NAFLD. Half of the T2DM/NAFLD rats were randomly injected intraperitoneally with gAd for 7 d (gAd-treated group), while the other 7 rats (T2DM/NAFLD group) received 0.9% saline. Plasma biochemical parameters and insulin concentrations were measured. Liver histopathology was examined by hematoxylin-eosin staining. Insulin receptor expression in the liver was analyzed by immunohistochemical staining, Western blot and quantitative real-time reverse transcription polymerase chain reaction analysis.
Results: Compared to the control group, the T2DM/NAFLD group had increased levels of glucolipid and decreased levels of insulin. Plasma glucose and lipid levels were decreased in the gAd-treated group, while serum insulin levels increased. The expression of insulin receptor in the T2DM/NAFLD group increased compared with the NC group, and gAd downregulated insulin receptor expression in the livers of T2DM/NAFLD rats. Steatosis of the liver was alleviated in the gAd-treated group compared to the T2DM/NAFLD group (NAS 1.39 ± 0.51 vs 1.92 ± 0.51, P < 0.05).
Conclusion: Globular adiponectin exerts beneficial effects in T2DM rats with NAFLD by promoting insulin secretion, mediating glucolipid metabolism, regulating insulin receptor expression and alleviating hepatic steatosis.
Keywords: Adiponectin; Insulin receptor; Insulin secretion; Steatosis.
Figures


References
-
- Musso G, Gambino R, Cassader M, Pagano G. Meta-analysis: natural history of non-alcoholic fatty liver disease (NAFLD) and diagnostic accuracy of non-invasive tests for liver disease severity. Ann Med. 2011;43:617–649. - PubMed
-
- Saadeh S, Younossi ZM, Remer EM, Gramlich T, Ong JP, Hurley M, Mullen KD, Cooper JN, Sheridan MJ. The utility of radiological imaging in nonalcoholic fatty liver disease. Gastroenterology. 2002;123:745–750. - PubMed
-
- Tolman KG, Fonseca V, Tan MH, Dalpiaz A. Narrative review: hepatobiliary disease in type 2 diabetes mellitus. Ann Intern Med. 2004;141:946–956. - PubMed
Publication types
MeSH terms
Substances
LinkOut - more resources
Full Text Sources
Other Literature Sources
Medical
