. 2014 May;2(1):http://fulltextarticles.avensonline.org/JOCB-2334-2838-02-0017.html.
doi: 10.13188/2334-2838.1000017.

The Trabecular Meshwork: A Basic Review of Form and Function

Affiliations

The Trabecular Meshwork: A Basic Review of Form and Function

Diala W Abu-Hassan et al. J Ocul Biol. 2014 May.
No abstract available


Figures

Figure 1
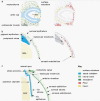
Figure 1. The embryonic and fetal development of the TM and SC
(A) Optic cup stage: at the 5th week of gestation, the surface ectoderm thickens and invaginates to form the lens pit and the optic vesicle forms the optic cup. (B) The periocular mesenchyme migrates between the surface ectoderm and lens vesicle to form corneal stroma, corneal endothelium, TM and SC at the 5 th month of gestation. (C) Maturation of a functional TM and SC postnatally. Taken from [16].
Figure 2
Figure 2. Postnatal development of the iridocorneal angle and the TM
The diagram shows the developmental stages of the TM and SC. (A) The TM appears as a condensed mesenchymal tissue (arrows). (B) The TM cells have differentiated and become separated from each other by small open spaces. Extracellular fibers accumulate in the intercellular spaces, whereas; vessels appear in the adjacent sclera (open arrows). (C) The trabecular beams or lamellae have formed by reorganization of the extracellular fibers in the chamber angle but still are not fenestrated. The beams become covered by TM cells. The scleral vessels next to the chamber angle coalesce and fuse to SC. Anterior chamber (AC), ciliary body (CB). Taken from [21].
Figure 3
Figure 3. Histological postnatal development of the iridocorneal angle and the TM
The diagram shows the developmental stages of the TM and SC in C57BL/6J mice. (A) The TM is recognized as condensed mesenchymal tissue (arrows) between the corneal stroma (CS), ciliary body (CB) and anterior chamber (AC). (B) The TM cells have differentiated and the trabecular beams or lamellae have developed but still are not fenestrated. (C) SC is present between (arrowheads), but AH entry to SC (arrows) is still restricted. ECM partially accumulates in the spaces. (D) Organization and maturation of the TM continues with enlargement of the present spaces and opening of new ones. Scale bars represent 50 μm. Taken from [15].
Figure 4
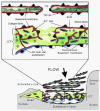
Figure 4. Outflow pathway through the TM and JCT
The lower portion of the figure shows a side view of the TM (radial section). The arrow indicates the direction of AH flow across the TM until it enters SC. The upper inset represents an expanded view of the JCT region. Once the AH passes through the intratrabecular spaces (ITS) of corneoscleral meshwork, it goes to the JCT region, and then through the inner wall endothelial lining of SC. Taken from [12].
Figure 5
Figure 5. Ex vivo perfused anterior segment organ culture outflow model
The anterior half of the eye with lens, iris and ciliary body removed is mounted and sealed in a chamber that is connected via tubing to a perfusion reservoir. The reservoir is placed at around 8 mm Hg to generate normal physiological pressure (1x). To increase the pressure, the bottle is placed at a higher position, commonly at 16 mm Hg (2x). Fluid flow rate is determined gravimetrically. Alternatively, fluid can be pumped at a constant pressure and resultant pressure measured with a pressure transducer.
Figure 6
Figure 6. The IOP homeostatic response in perfused human anterior segments
Perfusion of human anterior segment explants at normal physiological pressure (1x, around 7–8 mm Hg) and flow rate measured at around 2.5–3 μL/min. Pressure was then doubled (2x) as indicated. The corrective resistance change due to ECM turnover adjustments by TM cells exemplifies a typical IOP homeostatic response.

References

    1. Quigley HA. Open-angle glaucoma. N Eng J Med. 1993;328:1097–1106. - PubMed
    1. Quigley HA. Number of people with glaucoma worldwide. Br J Ophthalmol. 1996;80:389–393. - PMC - PubMed
    1. Quigley HA, Broman AT. The number of people with glaucoma worldwide in 2010 and 2020. Br J Ophthalmol. 2006;90:262–267. - PMC - PubMed
    1. Quigley HA, Vitale S. Models of open-angle glaucoma prevalence and incidence in the United States. Invest Ophthalmol Vis Sci. 1997;38:83–91. - PubMed
    1. Thylefors B, Negrel AD. The global impact of glaucoma. Bull World Health Organ. 1994;72:323–326. - PMC - PubMed

LinkOut - more resources