. 2015 Jan;156(1):242-54.
doi: 10.1210/en.2014-1281.

Loss of basal and TRH-stimulated Tshb expression in dispersed pituitary cells

Affiliations

Loss of basal and TRH-stimulated Tshb expression in dispersed pituitary cells

Paula Bargi-Souza et al. Endocrinology. 2015 Jan.

Abstract

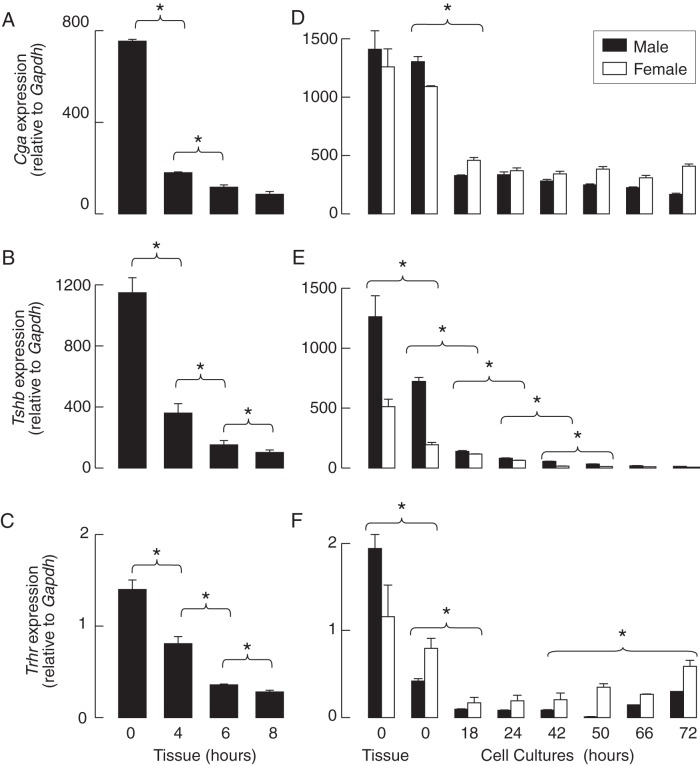
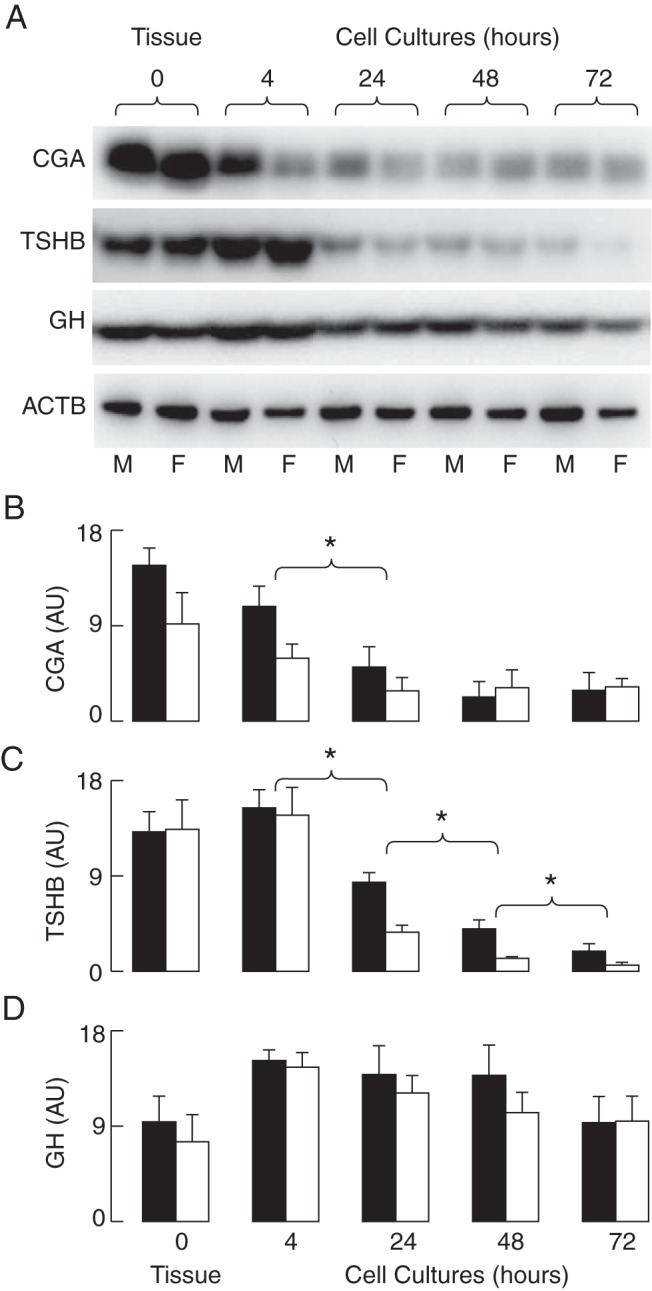
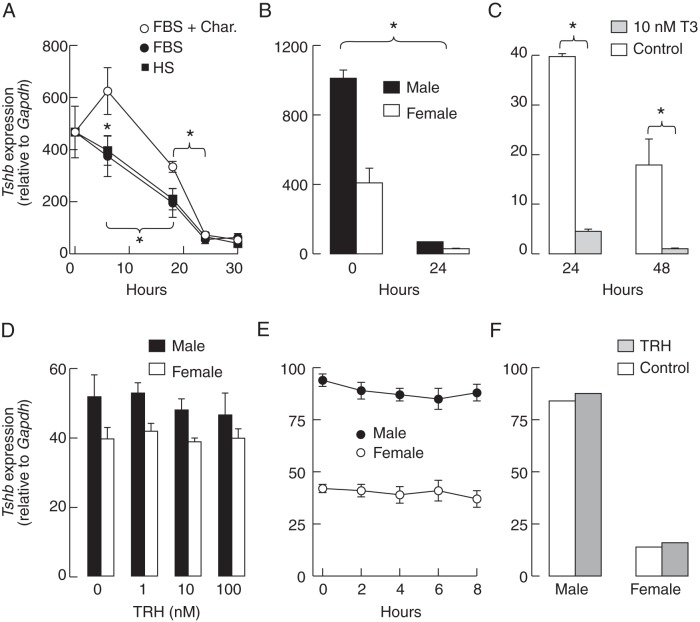
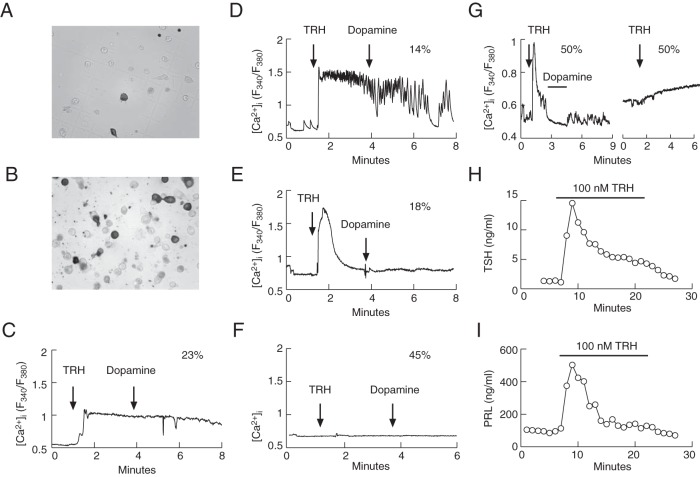
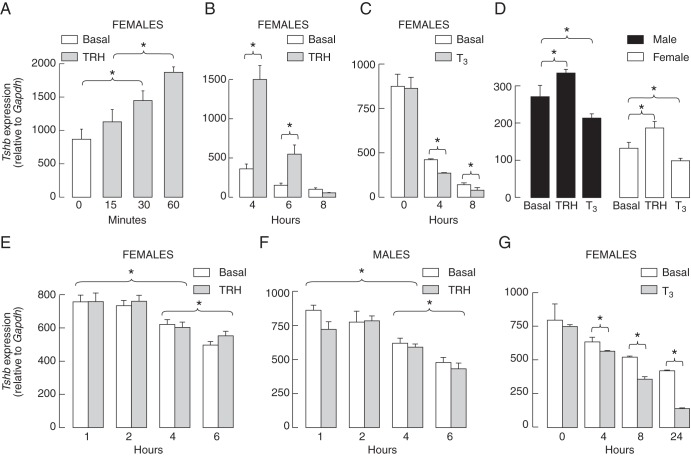
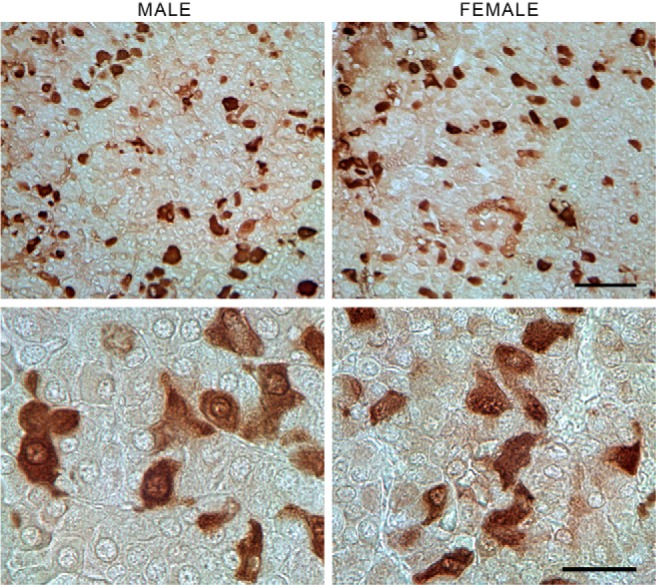
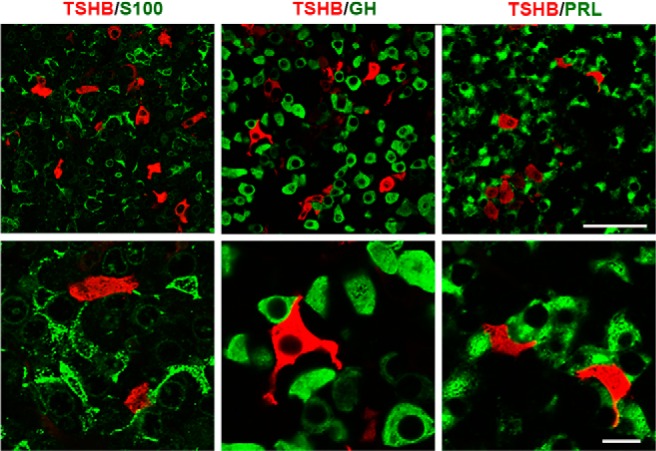
This study addresses the in vivo and in vitro expression pattern of three genes that are operative in the thyrotroph subpopulation of anterior pituitary cells: glycoprotein α-chain (Cga), thyroid-stimulating hormone β-chain (Tshb), and TRH receptor (Trhr). In vivo, the expression of Cga and Tshb was robust, whereas the expression of Trhr was low. In cultured pituitary cells, there was a progressive decline in the expression of Cga, Tshb, and Trhr. The expression of Tshb could not be reversed via pulsatile or continuous TRH application in variable concentrations and treatment duration or by the removal of thyroid and steroid hormones from the sera. In parallel, the expression of CGA and TSHB proteins declined progressively in pituitary cells from both sexes. The lack of the effect of TRH on Tshb expression was not related to the age of pituitary cultures and the presence of functional TRH receptors. In cultured pituitary fragments, there was also a rapid decline in expression of these genes, but TRH was able to induce transient Tshb expression. In vivo, thyrotrophs were often in close proximity to each other and to somatotroph and folliculostellate cell networks and especially to the lactotroph cell network; such an organization pattern was lost in vitro. These observations suggest that the lack of influence of anterior pituitary architecture and/or intrapituitary factors probably accounts for the loss of basal and TRH-stimulated Tshb expression in dispersed pituitary cells.


Figures

Figure 1.
Figure 1.. The time course of gene expression in cultured rat pituitary fragments and dispersed cells in the absence of TRH and T3.
A–C, Decay in Cga (A), Tshb (B), and Trhr (C) expression in cultured pituitary tissues from adult males. D–F, Anterior pituitaries from 7-week-old females and males were used for cell dispersion, and the residual pituitaries were used for mRNA extraction from tissue. Immediately after dispersion, a fraction of the cells were used for mRNA extraction (0 h group), and the residual cells were cultured for 18–72 hours prior to the mRNA extraction and qRT-PCR analysis of Cga (D), Tshb (E), and Trhr (F) expression. The data shown are the means ± SEM values relative to Gapdh (100%) from a single (panels A–C) and three experiments (panels D–F), each done with at least five dishes per time point in males (black bars) and females (white bars). Asterisks indicate significant differences (P < .05) between compared groups for both females and males, calculated separately.
Figure 2.
Figure 2.. The down-regulation of CGA and TSHB proteins in cultured rat pituitary cells.
Tissue samples and the fraction of cells obtained immediately after cell preparation (4 h) were used for protein extraction; the residual cells were cultured for 24–72 hours prior to protein extraction and Western blot analysis of the CGA and TSHB content. The GH and ACTB content served as controls. A, Representative blots. B–D, The means ± SEM values of arbitrary units obtained via a densitometry analysis of CGA (B), TSHB (C), and GH (D) for males (M; black bars) and females (F; white bars) from six experiments. Asterisks indicate significant differences (P < .05) between compared groups for both females and males.
Figure 3.
Figure 3.. Effect of culture conditions on Tshb expression in rat pituitary cells.
A, The down-regulation of basal Tshb expression in pituitary cells from females is independent of the type of serum used: charcoal-treated fetal bovine serum (FBS + Char), charcoal-untreated FBS, or charcoal-untreated HS. B, The down-regulation of basal Tshb expression in cells bathed in medium containing 0.1% BSA only. In both panels, zero represents samples from cells immediately after cell dispersion. C, T3 down-regulates the basal Tshb expression in female pituitary cells. D, The lack of an effect of 6 hours of application of TRH in different concentrations on Tshb expression in 24-hour-old pituitary static cultures. E, The lack of an effect after continuous application of 10 nM TRH for indicated times on Tshb expression in male and female pituitary cells in 24-hour-old cultures. F, The lack of an effect of a pulsatile 10-nM TRH application (2 × 5 min/h for 6 h of incubation) on Tshb expression in perifused male and female pituitary cells cultured on beads for 24 hours. Data points are means ± SEM values from a single (panels A and B) and from a representative of three similar experiments (panels C–E) (n = 4 per time point). In panels B–F, cells were bathed in 0.1% BSA-containing medium 199. Asterisks indicate significant differences (P < .05) between compared groups for both females and males.
Figure 4.
Figure 4.. TRH-induced calcium signaling and hormone secretion in female rat thyrotrophs and lactotrophs.
A and B, Imunocytochemically identified thyrotrophs (A) and lactotrophs (B) in mixed populations of anterior pituitary cells. C–G, Typical patterns of calcium signaling induced via 100 nM TRH and 10 μM dopamine in immunocytochemically identified thyrotrophs (panels C–F) and lactotrophs (panel G). The numbers above the traces indicate the percentage of cells responding to TRH with particular patterns of calcium signaling from 26 immunopositive thyrotrophs derived from four different cell preparations and 18 immunopositive lactotrophs from two different cell preparations. H and I, TRH-induced TSH secretion (H) and PRL secretion (I) in perifused pituitary cells. Traces shown are representative from two (H) and 10 (I) independent experiments. All experiments were performed 24 hours after cell dispersion.
Figure 5.
Figure 5.. Comparison of effects of TRH and T3 on Tshb expression in pituitary fragments and freshly dispersed cells incubated under identical experimental conditions.
A–D, The up- and down-regulation of Tshb in rat pituitary fragments. A, Rapid up-regulation of Tshb expression by 10 nM TRH. B, A transient nature of TRH (100 nM)-induced Tshb expression in pituitary tissues. C, Additive effects of 10 nM T3 on the down-regulation of Tshb expression. D, Modulation of Tshb expression in pituitary fragments by TRH (100 nM) and T3 (10 nM) applied for 6 hours. Data points are means ± SEM (n = 4) in one from two experiments. *, P < .05. E and F, The lack of TRH effect on Tshb expression in freshly dispersed cells from female (E) and male (F) rats. G, Inhibitory effect of 10 nM T3 on Tshb expression. Data points are mean ± SEM values from three independent experiments (panels E and F) and a single experiment (panel G).
Figure 6.
Figure 6.. Immunohistochemical labeling of TSHB in male and female pituitary sections.
No apparent differences were observed in the size, shape, or number of TSHB-positive cells between sexes. Most of the thyrotrophs were located in the middle central and middle lateral portions of the gland near the capillaries (upper panel). Although most of the TSHB-positive cells were solitary, small clusters of cells near each other could also be seen (lower panel). Scale bar, upper panel, 50 μm; lower panel, 20 μm.
Figure 7.
Figure 7.. Double-immunofluorescent labeling for TSHB (red fluorescence) and S100, GH, or PRL (green fluorescence) in anterior pituitary sections of postpubertal female rats.
Left panel, Organization of S100-positive cells and their relationship with thyrotrophs. Middle panel, Dominance of GH-positive cells in anterior pituitary tissue and their interactions with thyrotrophs. Right panel, Interconnections between PRL-positive cells and their physical closeness to thyrotrophs. Scale bar, upper panel, 50 μm; lower panel, 10 μm.

References

    1. Stojilkovic SS, Tabak J, Bertram R. Ion channels and signaling in the pituitary gland. Endocr Rev. 2010;31(6):845–915. - PMC - PubMed
    1. Fauquier T, Guerineau NC, McKinney RA, Bauer K, Mollard P. Folliculostellate cell network: a route for long-distance communication in the anterior pituitary. Proc Natl Acad Sci USA. 2001;98(15):8891–8896. - PMC - PubMed
    1. Hodson DJ, Romano N, Schaeffer M, et al. Coordination of calcium signals by pituitary endocrine cells in situ. Cell Calcium. 2012;51(3–4):222–230. - PubMed
    1. Le Tissier PR, Hodson DJ, Lafont C, Fontanaud P, Schaeffer M, Mollard P. Anterior pituitary cell networks. Front Neuroendocrinol. 2012;33(3):252–266. - PubMed
    1. Mollard P, Hodson DJ, Lafont C, Rizzoti K, Drouin J. A tridimensional view of pituitary development and function. Trends Endocrinol Metab. 2012;23(6):261–269. - PubMed

Publication types