. 2014 Oct 30;10(10):e1004716.
doi: 10.1371/journal.pgen.1004716. eCollection 2014 Oct.

Genome-wide distribution of RNA-DNA hybrids identifies RNase H targets in tRNA genes, retrotransposons and mitochondria

Affiliations

Genome-wide distribution of RNA-DNA hybrids identifies RNase H targets in tRNA genes, retrotransposons and mitochondria

Aziz El Hage et al. PLoS Genet. .

Abstract

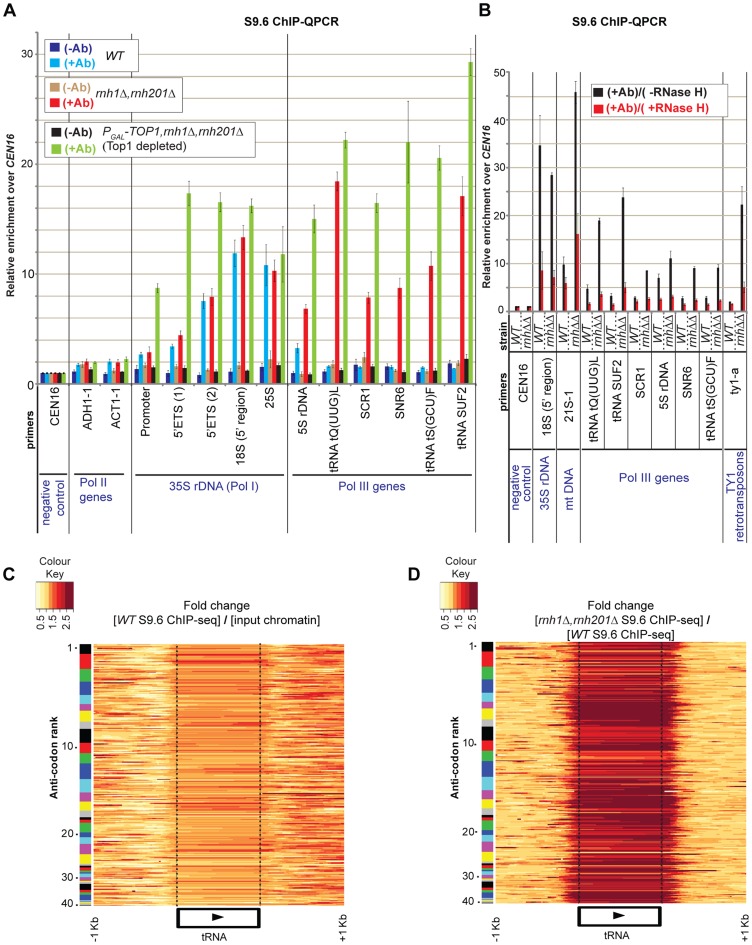
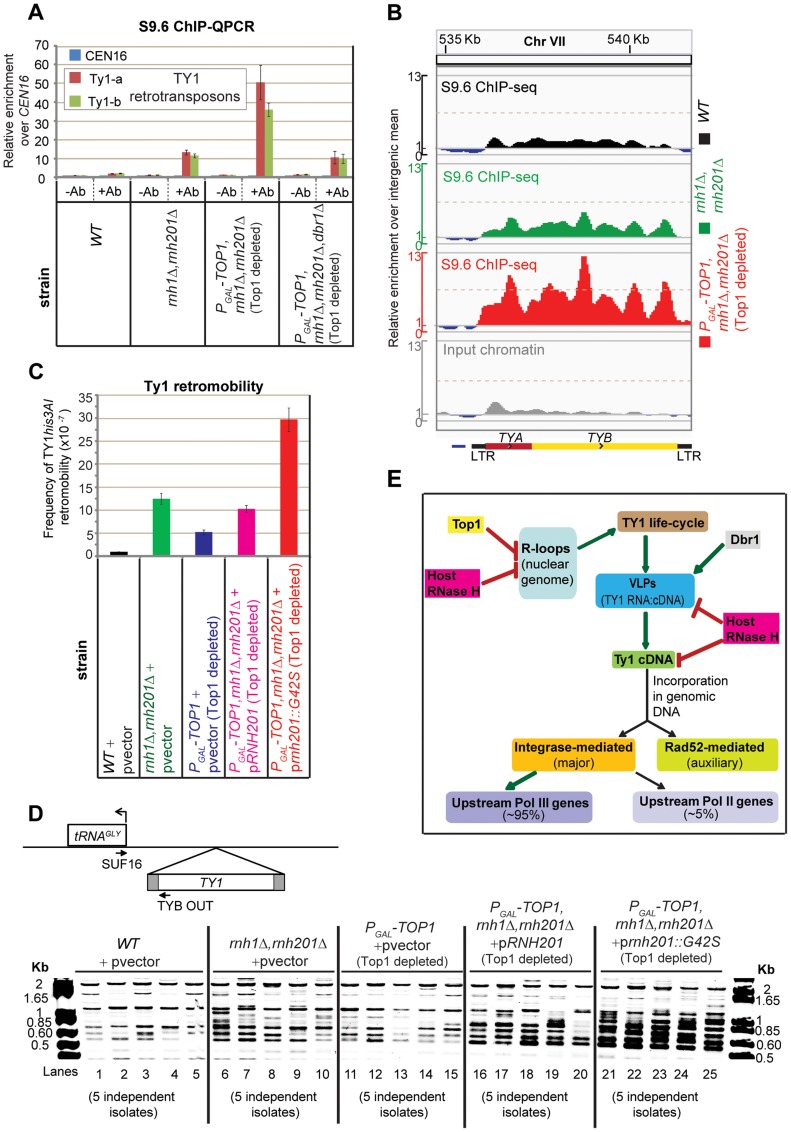
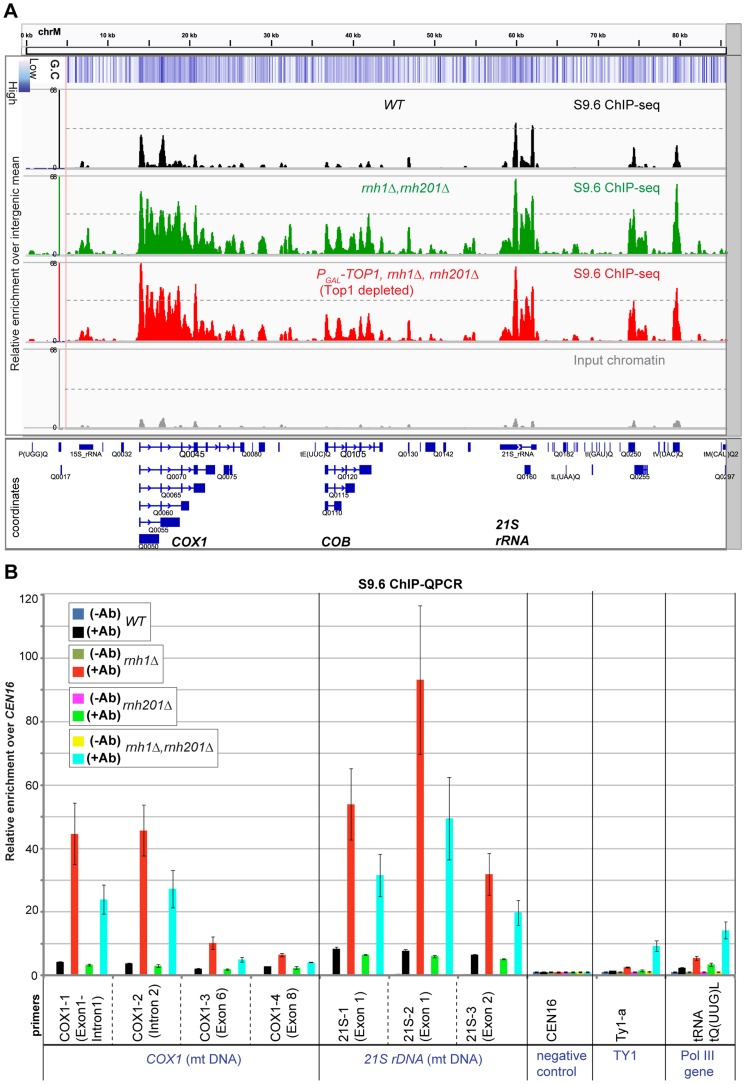
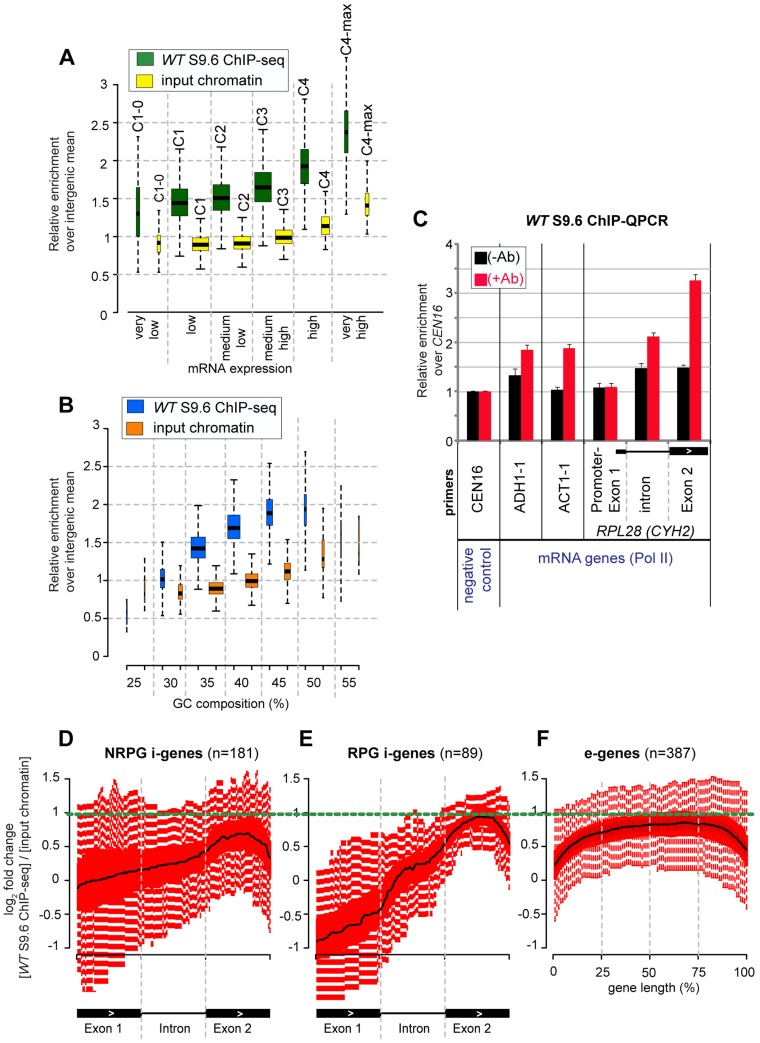
During transcription, the nascent RNA can invade the DNA template, forming extended RNA-DNA duplexes (R-loops). Here we employ ChIP-seq in strains expressing or lacking RNase H to map targets of RNase H activity throughout the budding yeast genome. In wild-type strains, R-loops were readily detected over the 35S rDNA region, transcribed by Pol I, and over the 5S rDNA, transcribed by Pol III. In strains lacking RNase H activity, R-loops were elevated over other Pol III genes, notably tRNAs, SCR1 and U6 snRNA, and were also associated with the cDNAs of endogenous TY1 retrotransposons, which showed increased rates of mobility to the 5'-flanking regions of tRNA genes. Unexpectedly, R-loops were also associated with mitochondrial genes in the absence of RNase H1, but not of RNase H2. Finally, R-loops were detected on actively transcribed protein-coding genes in the wild-type, particularly over the second exon of spliced ribosomal protein genes.


Conflict of interest statement

The authors have declared that no competing interests exist.

Figures

Figure 1
Figure 1. R-loops generated by RNA Polymerase III are substrates for cellular RNase H.
A: Analysis of R-loops by ChIP-QPCR using antibody S9.6 in wild-type strain BY4741 (WT) and double mutant rnh1Δ rnh201Δ, and in triple mutant PGAL-TOP1 rnh1Δ rnh201Δ depleted of Top1 for 6h at 30°C. CEN16, the Pol II genes ADH1 and ACT1, the Pol I transcribed 35S rRNA gene, and the Pol III genes (5S rDNA, tRNA tQ(UUG)L, SCR1, SNR6, tRNA tS(GCU)F and tRNA SUF2) were analyzed by Q-PCR. Values for no-antibody (−Ab) and antibody S9.6 (+Ab) were calculated as described in Materials and Methods and normalized to CEN16, which was set arbitrarily to 1 in order to compensate for differences in immunoprecipitation efficiencies. CEN16 is not expected to be transcribed and should therefore give rise only to background signal after immunoprecipitation. The mean of three independent experiments is shown with standard error. B: S9.6-ChIP samples of strains WT (BY4741) and double mutant rnh1Δ rnh201Δ, grown at 30°C in YEPD (glucose 2%), were treated or not with recombinant RNase H ‘on-beads’ for 2.5 h at 37°C. CEN16, 18S rDNA, mitochondrial 21S rDNA, Pol III genes [same as in (A)] and Ty1 retrotransposons, were analyzed by Q-PCR as described above. rnhΔΔ = double mutant rnh1Δ rnh201Δ. C–D: Heatmaps of R-loop distribution across 274 tRNA genes assigned to 41 families of distinct codon specificity in the WT (C) and double mutant rnh1Δ rnh201Δ (D). Genes are ordered by their anticodon rank (Y-axis) based on the sum of codons in the genome for which it can be used, with a value of 1 representing the anticodon with the highest number of codons in the genome. Anticodons were grouped into 41 families (see [99]), and the codon frequencies were calculated from all protein coding genes in the Saccer3 genome assembly. The X-axis shows the position of the tRNA genes with 1 kb of 5′- and 3′- flanking sequences. Each point on the graph is a colored tile representing the fold change of: “[WT S9.6 ChIP-seq] relative to [input chromatin]” panel (C); and “[rnh1Δ rnh201Δ S9.6 ChIP-seq] relative to [WT S9.6 ChIP-seq]” panel (D). 5′ and 3′ endpoints of mature tRNAs are delineated by vertical dotted lines across the heatmaps.
Figure 2
Figure 2. R-loops at tRNA genes affect pre-tRNA synthesis in strains lacking topoisomerase and RNase H activities.
A–E: Wild-type strain BY4741 (WT) and isogenic mutant strains single PGAL-TOP1, triple PGAL-TOP1 rnh1Δ rnh201Δ, double PGAL-TOP1/TOP2 and quadruple PGAL-TOP1/TOP2 rnh1Δ rnh201Δ, were grown at 30°C and harvested at 0 h (galactose- and sucrose- containing medium) and at 6–9 h post-shift to glucose-containing medium. Total RNAs were extracted and analyzed by northern hybridization. The membrane was hybridized separately with probes tRNAi MET (A), tRNA3 LEU (B), tRNA2 LYS (C) and tRNATRP (D). Ethidium bromide staining of 5S rRNA is in (E). Precursor and mature tRNA species are in subpanels I and II, respectively. Exon and intron sequences are represented by filled boxes and horizontal lines, respectively, and probe locations are indicated as lines under the schematics of the pre-tRNA species. Short (IMT1+IMT4) and long (IMT2+IMT3) forms of tRNAi MET are indicated. F–I: Quantification of tRNA precursors (pre-tRNAs) from northern analysis data in panels A–D. Pre-tRNA ratios at each time point were generated by normalising the pre-tRNA species (subpanels I) to the loading control (5S rRNA) and by expressing all the values relative to the 0 h sample of the wild-type strain, which was set to 1.
Figure 3
Figure 3. Cellular RNase H suppresses the mobility of Ty1 LTR-retrotransposons.
A: Ty1 elements were analyzed by ChIP-QPCR for distribution of RNA-DNA hybrids in WT (BY4741) and double mutant rnh1Δ rnh201Δ, and in triple mutant PGAL-TOP1 rnh1Δ rnh201Δ and quadruple mutant PGAL-TOP1 rnh1Δ rnh201Δ dbr1Δ depleted of Top1 for 6 h at 30°C. ChIP samples and normalization of Q-PCR values to CEN16 are as in Fig. 1A. The mean of three independent experiments is shown with standard error (two independent experiments for the quadruple mutant). Ab = antibody S9.6. B: S9.6 ChIP-seq profiles over the Ty1 retrotransposon YGRWTY1-1 in the WT (BY4741), double mutant rnh1Δ rnh201Δ, and triple mutant PGAL-TOP1 rnh1Δ rnh201Δ depleted of Top1 for 61h at 30°C. Input chromatin is shown for the WT. Shown below is a graphical representation of a Ty1 element, which is comprised of TYA and TYB open reading frames flanked by long terminal repeats (LTR). The direction of Pol II transcription is indicated by arrowheads. The y-axis represents the relative enrichment of reads where values>1 are above the background level of sequencing (i.e. general intergenic mean, see Materials and Methods). Profiles were generated using the Integrative Genomics Viewer . C: Bar diagrams showing the frequencies of Ty1his3AI mobility after complementation of the wild-type JC3212 (BY4741 TY1his3AI-[Δ1]-3114, [41]) and the mutants double rnh1Δ rnh201Δ and single PGAL-TOP1 with a vector control, and the triple mutant PGAL-TOP1 rnh1Δ rnh201Δ with a vector expressing either wild-type Rnh201 or AGS-related mutant Rnh201G42S . Strains were grown until saturation at 18°C (for growth conditions see Materials and Methods). The frequency of Ty1his3AI mobility is the number of His+ prototrophs divided by the total number of cells plated (see Materials and Methods). The mean of two independent experiments of five independent isolates for each of the strains is shown with standard error. D: PCR analyses showing the integration of Ty1 at the 16 tRNAGLY genes. Upper panel. Graphical representation of the integrated Ty1 element at 5′-flanks of tRNAGLY loci. Primers TYBOUT and SUF16 complementary to Ty1 element and tRNAGLY respectively were used for PCR amplification. Lower panel. Example of SYBR-stained gel showing integration of Ty1 cDNA upstream of any of the 16 tRNAGLY gene loci. Five independent isolates were tested for each strain. Flanking lanes show DNA ladders with lengths in base-pairs (bp). The same yeast cultures served for both analyses in (C) and (D). E: Model for the role of co-transcriptional R-loops in activation of Ty1 retrotransposition (see Discussion). VLP = viral-like particle. Red thick arrow = negative regulation. Green thick arrow = positive regulation. For a detailed review on the mechanisms of TY1 retrotransposition see , . See also model in Fig. S7.
Figure 4
Figure 4. RNase H1 suppresses accumulation of R-loops at mitochondrial DNA.
A: Profiles of RNA-DNA hybrids over the mitochondrial chromosome (Chr M) in the WT (BY4741), the double mutant rnh1Δ rnh201Δ, and the triple mutant PGAL-TOP1 rnh1Δ rnh201Δ depleted of Top1 for 6 h at 30°C. Input chromatin is shown for the WT. A schematic of the mitochondrial transcription units is presented underneath the profiles with the direction of transcription indicated by arrowheads. COX1 gene ( = Q0045) is comprised of 8 exons and 7 introns, COB gene ( = Q0105) of 6 exons and 5 introns, and 21S rDNA of 2 exons and 1 intron. Exon and intron sequences are represented by filled boxes and horizontal lines, respectively. The y-axis represents the relative enrichment of reads where values>1 are above the background level of sequencing (i.e. general intergenic mean, see Materials and Methods). G+C content of the DNA sequence was calculated for 100 bp windows and is depicted as a blue intensity. Profiles were generated using the Integrative Genomics Viewer . B: ChIP-QPCR analysis of R-loops over mitochondrial genes COX1 and 21S rDNA in WT (BY4741) and isogenic single rnh1Δ, single rnh201Δ and double rnh1Δ rnh201Δ mutants, grown at 30°C in YEPD medium (glucose 2%). Ty1 retrotransposons and tRNA tQ(UUG)L are also shown. Q-PCR values were calculated and normalized to CEN16 as in Fig. 1A. The mean of three independent experiments is shown with standard error. Ab = antibody S9.6.
Figure 5
Figure 5. R-loops are enriched over the second exon of intron-containing genes.
A–B: Box plots of mean sequence read distribution per gene across all yeast protein-coding genes (n = 5864, see Fig. S10A) in samples “input chromatin” and “S9.6 ChIP-seq” from the wild-type strain (BY4741) grown at 30°C in YEPD medium (glucose 2%). The y-axis represents the relative enrichment of sequencing reads where values >1 are above the background level of sequencing (i.e. general intergenic mean, see Materials and Methods). (A) Genes were clustered arbitrarily in 6 main categories based on the strength of their mRNA expression (X-axis): C1-0 (very low), C1 (low), C2 (medium-low), C3 (medium-high), C4 (high) and C4-max (very high) (see Fig. S10A and [101]). We used a Kolmogorov-Smirnov test to determine whether levels of mean sequence distribution differ significantly between the input chromatin and ChIP-seq data within each mRNA expression group: C1-0 (D = 0.5, p-value = 1.85E-008), C1 (D = 0.8109685, p-value = 0), C2 (D = 0.8624161, p-value = 0), C3 (D = 0.8607383, p-value = 0), C4 (D = 0.8439024, p-value = 0) and C4-max (D = 0.7888889, p-value = 4.440892E-16). (B) Genes were clustered based on their GC composition across the entire length of the gene (X-axis). Box-plots show median values (black line) +/−25% quartiles in the box and minimum/maximum distribution of the values (excluding outliers) in the whiskers. The width of the boxes reflects the number of genes in each group. C: ChIP-QPCR analysis of R-loops over control CEN16 and mRNA genes ADH1, ACT1 and intron-gene RPL28 (CYH2) in strain wild-type (BY4741), grown at 30°C in YEPD medium (glucose 2%). Q-PCR values were calculated and normalized to CEN16 as in Fig. 1A. The mean of three independent experiments is shown with standard error. Ab = antibody S9.6. Exon1 and intron regions of RPL28 are represented with a filled box and a horizontal line, respectively. D–F: Box plots of S9.6 ChIP-seq profiles of R-loops over mRNA genes in the wild-type (BY4741) (same samples as in panel A). (D) Intron-containing, non-ribosomal protein genes (NRPG i-genes). (E) Intron-containing, ribosomal protein genes (RPG i-genes). (F) Top 387 highly expressed intronless genes (e-genes). Each box plot represents the log2 fold-change of S9.6 ChIP-seq relative to input chromatin, so the regions above zero value on the Y-axis are enriched with R-loops (see also Fig. S13). For ease of comparison between panels the horizontal dotted green line points to the position of the top R-loop signal on exon 2 in panel E. For i-genes in panels D-E, R-loop profiles are plotted across the Exon1-Intron-Exon2 region. The 5′ end of Exon 1 is defined either as the AUG start codon, or 100 bp upstream of the 5′ splice site for genes with Exon 1 <100 pb (see also Protocol S1). For e-genes in panel F (top 387 highly expressed, see Fig. S10A), R-loop profiles are plotted across the entire length of the gene.

References

    1. Liu LF, Wang JC (1987) Supercoiling of the DNA template during transcription. Proc Natl Acad Sci U S A 84: 7024–7027. - PMC - PubMed
    1. Aguilera A, Garcia-Muse T (2012) R loops: from transcription byproducts to threats to genome stability. Mol Cell 46: 115–124. - PubMed
    1. Belotserkovskii BP, Mirkin SM, Hanawalt PC (2013) DNA Sequences That Interfere with Transcription: Implications for Genome Function and Stability. Chem Rev 113: 8620–8637. - PubMed
    1. Drolet M (2006) Growth inhibition mediated by excess negative supercoiling: the interplay between transcription elongation, R-loop formation and DNA topology. Mol Microbiol 59: 723–730. - PubMed
    1. Hamperl S, Cimprich KA (2014) The contribution of co-transcriptional RNA:DNA hybrid structures to DNA damage and genome instability. DNA Repair (Amst) 19: 84–94. - PMC - PubMed

Publication types

MeSH terms