. 2014 Oct 30:3:e04418.
doi: 10.7554/eLife.04418.

Real-time observation of signal recognition particle binding to actively translating ribosomes

Affiliations

Real-time observation of signal recognition particle binding to actively translating ribosomes

Thomas R Noriega et al. Elife. .

Abstract

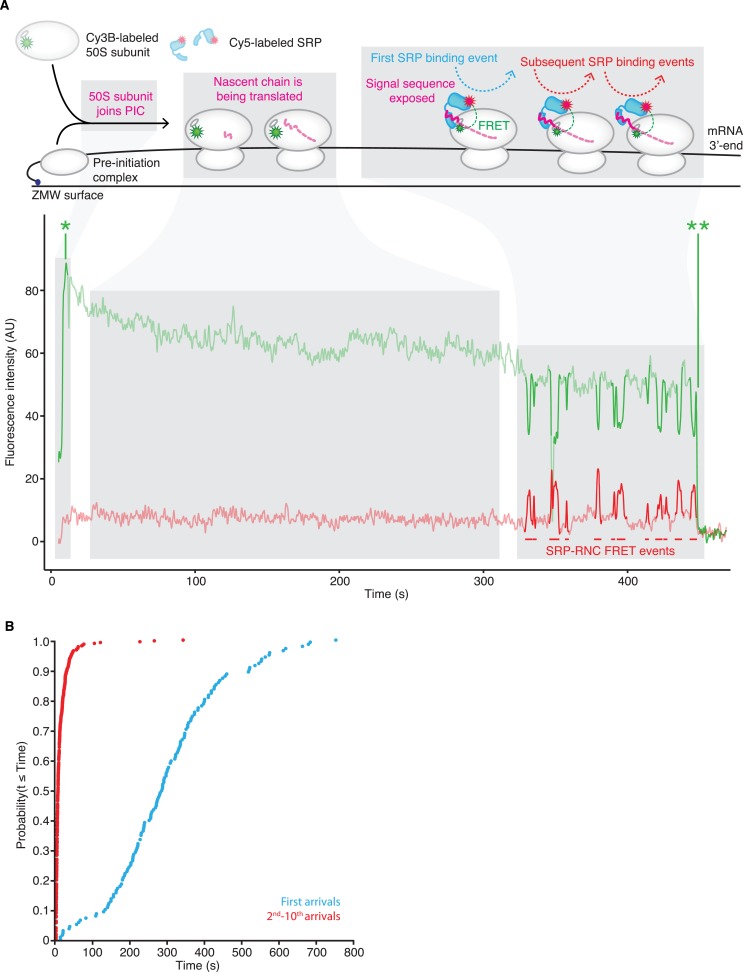
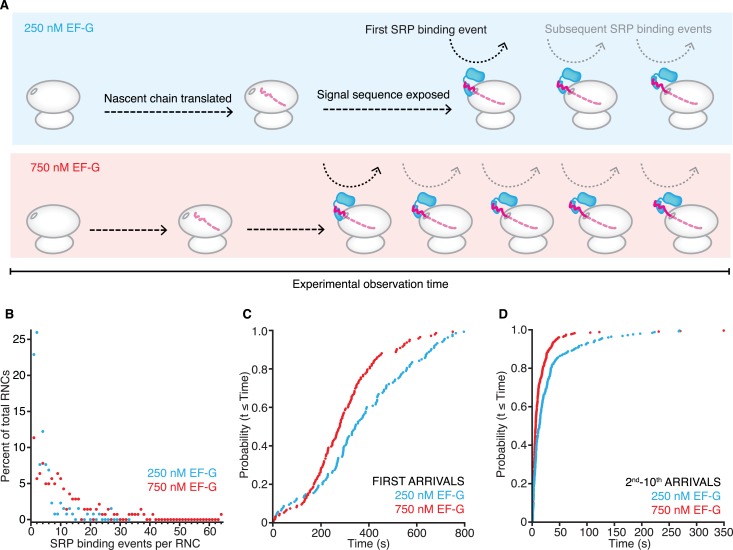
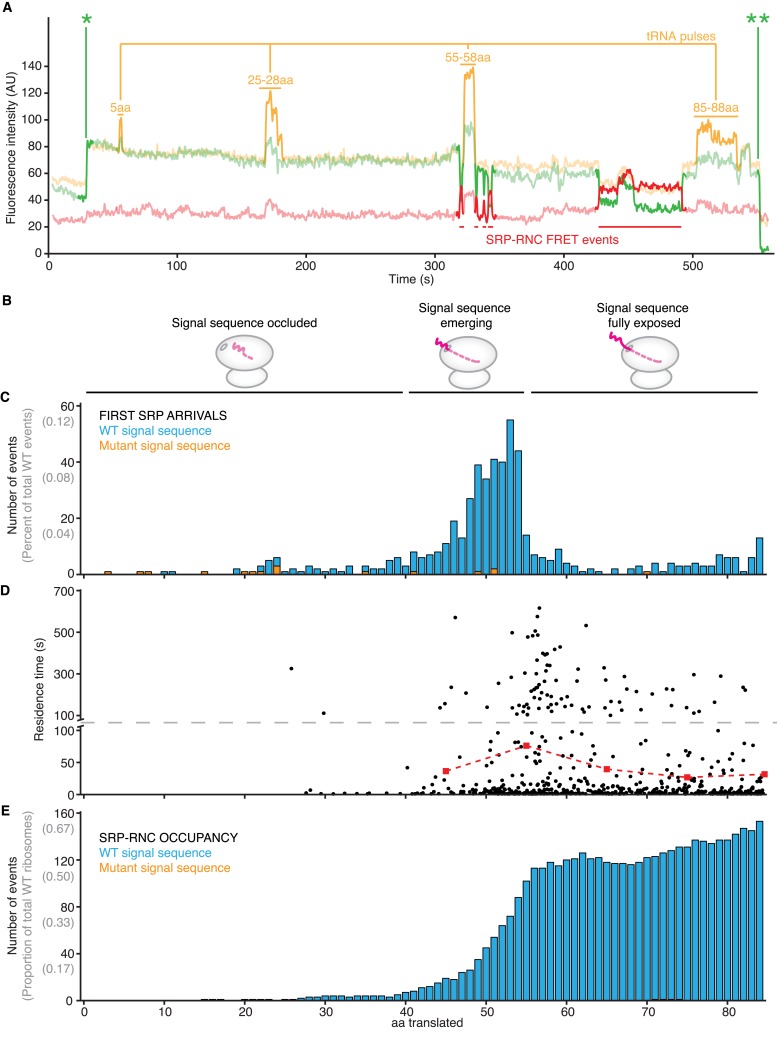
The signal recognition particle (SRP) directs translating ribosome-nascent chain complexes (RNCs) that display a signal sequence to protein translocation channels in target membranes. All previous work on the initial step of the targeting reaction, when SRP binds to RNCs, used stalled and non-translating RNCs. This meant that an important dimension of the co-translational process remained unstudied. We apply single-molecule fluorescence measurements to observe directly and in real-time E. coli SRP binding to actively translating RNCs. We show at physiologically relevant SRP concentrations that SRP-RNC association and dissociation rates depend on nascent chain length and the exposure of a functional signal sequence outside the ribosome. Our results resolve a long-standing question: how can a limited, sub-stoichiometric pool of cellular SRP effectively distinguish RNCs displaying a signal sequence from those that are not? The answer is strikingly simple: as originally proposed, SRP only stably engages translating RNCs exposing a functional signal sequence.

Keywords: E. coli; biophysics; cell biology; protein targeting; ribosome translation; signal recognition particle; single molecule fluorescence; structural biology.


Conflict of interest statement

The authors declare that no competing interests exist.

Figures

Figure 1.
Figure 1.. SRP-binding to actively translating RNCs.
(A) Example smFRET trace of Cy5-labeled SRP, Cy3B-labeled 50S subunits, and unlabeled translation mix delivered at time = 0 to PICs pre-assembled on a truncated lepB mRNA (encoding the first 155 amino acids) and immobilized on ZMWs. To reduce non-specific interactions of SRP with the ZMWs, we pre-incubated the ZMWs with BSA, Blocking oligo, and unlabeled SRP, all of which were then thoroughly washed away (Figure 1—figure supplement 2). The top panel shows a schematic representation of the molecular events throughout the trace. The bottom panel shows the fluorescence intensity of the Cy3B (green) and Cy5 (red) signal upon 532 nm excitation. ‘AU’ indicates ‘arbitrary units’. * denotes the initial 50S ribosomal subunit joining. ** denotes photobleaching of the Cy3B dye on the 50S ribosomal subunit. (B) Cumulative distributions of SRP first arrival times (blue) and 2nd–10th arrival times (red) to RNCs from the experiment described in (A). (n ≥ 141 binding events). DOI: http://dx.doi.org/10.7554/eLife.04418.003
Figure 1—figure supplement 1.
Figure 1—figure supplement 1.. EFRET validation.
Histograms of the average EFRET values of SRP-RNC binding events when Cy5-labeled SRP was delivered to Cy3B-labeled RNCs stalled with a lepB mRNA (encoding the first 75 amino acids) and immobilized on ZMWs (left panel, 100 nM SRP, n = 787 binding events) or TIRFM slides (right panel, 20 nM SRP, n = 186 binding events). Lines indicate the normal fits of low EFRET events (blue), and high EFRET events (orange). The percentage of total events and mean (± one standard deviation) EFRET value for each are indicated. Please see ‘Materials and methods’ ‘smFRET assay characterization’ for further discussion of the figure. DOI: http://dx.doi.org/10.7554/eLife.04418.005
Figure 1—figure supplement 2.
Figure 1—figure supplement 2.. ZMW blocking to reduce non-specific SRP interactions.
Example traces of 100 nM Cy5-labeled SRP delivered to ZMWs in the presence of BSA, and Blocking oligo in the absence (top panel) or presence of a dark SRP pre-incubation and wash-out (bottom panel). Fluorescence intensity of the Cy5 (red) signal upon 532 nm excitation is shown. ‘AU’ indicates ‘arbitrary units’. DOI: http://dx.doi.org/10.7554/eLife.04418.006
Figure 1—figure supplement 3.
Figure 1—figure supplement 3.. Wide variance in SRP arrival and residence times when RNCs are stalled in translation.
Comparison of individual RNCs with more than five SRP binding events when 100 nM Cy5-labeled SRP was delivered to Cy3B-labeled RNCs stalled on a lepB mRNA (encoding the first 55 amino acids) and immobilized on ZMWs. Each column is an individual RNC with the grey dots indicating the arrival times (top panel, n = 162 RNCs) or residence times (bottom panel, n = 162 RNCs) of SRP-binding events. Red dots indicate median of binding events to each RNC, red line indicates variance of arrival or residence times. RNCs are arranged along the x-axis by decreasing variance. Data on the far-right labeled ‘total’ reflects all of the binding events analyzed together, with the blue dot and line indicating mean and variance, respectively. Note that the y-axis is in log10 scale. DOI: http://dx.doi.org/10.7554/eLife.04418.007
Figure 2.
Figure 2.. SRP-binding to RNCs translating at different rates.
(A) Schematic representation of the effect on the number of SRP-RNC binding events and their first and subsequent arrival times when performing the experiment described in Figure 1 at 250 nM (blue) and 750 nM (red) EF-G concentrations. (B) Comparison of SRP-binding events per RNC distributions for the experiment described in A. Colors as in (A) (n ≥ 621 binding events) (CD) Cumulative distributions of SRP first arrival times (C) and 2nd–10th arrival times (D) at 750 nM (red) and 250 nM (blue) (n ≥ 131 binding events). DOI: http://dx.doi.org/10.7554/eLife.04418.008
Figure 3.
Figure 3.. SRP binding to translation-calibrated RNCs.
(A) Representative smFRET trace of Cy5-labeled SRP, Cy3B-labeled 50S subunits, Cy3.5-labeled F-tRNA and unlabeled translation mix delivered at time = 0 to PICs pre-assembled on a lepB cWT mRNA (encoding the first 95 amino acids) and immobilized on ZMWs (see text and Figure 3—figure supplement 1). Fluorescence intensity of the Cy3B (green), Cy3.5 (orange), and Cy5 (red) signal under 532 nm excitation are shown. ‘AU’ indicates ‘arbitrary units’. * denotes the initial 50S ribosomal subunit joining. ** denotes photobleaching of the Cy3B dye on the 50S ribosomal subunit. (B) Schematic showing when, relative to the x-axis shared by panels CE, the signal sequence is exposed from RNCs. (C) Histogram showing how many amino acids have been polymerized when SRP first arrives to RNCs actively translating the lepB cWT mRNA (blue) or cMT mRNA (orange). Y-axis shows both total events, and percent of total for RNCs translating cWT mRNA. Note x-axis is shared by (CE). (D) Scatter plot of SRP-RNC binding residence times relative to the number of amino acids polymerized when the event starts (black dots), and average lifetimes of the residence times between the tick-marks (red squares and dashed red line, with associated error bars that are too small to be seen). mRNA translated is lepB cWT. Note that for clarity the y-axis is split at 100 s, as indicated by the dashed grey line. Only traces in which four tRNA pulses were detected were included in the analysis in this panel and panel (E). (E) Histogram showing how many RNCs are occupied by SRP relative to the number of amino acids translated when RNCs are actively translating a lepB cWT mRNA (blue) or cMT mRNA (orange—with so few events that, at this y-axis scale, they are not visible). Y-axis shows both total events, and percent of total for RNCs translating cWT mRNA. DOI: http://dx.doi.org/10.7554/eLife.04418.010
Figure 3—figure supplement 1.
Figure 3—figure supplement 1.. Translation-calibration lepB mRNA constructs.
Amino acid sequences of lepB WT, cWT (for ‘calibrated WT’), or cMT (for ‘calibrated mutant signal sequence’) mRNA translation products. Blue box marks amino acids in N-terminal signal sequence. Orange boxes show expected F-tRNA pulses in calibration sequences. Red residues have been mutated relative to WT sequence. DOI: http://dx.doi.org/10.7554/eLife.04418.013
Figure 3—figure supplement 2.
Figure 3—figure supplement 2.. tRNA pulse characterization.
(Upper left panel) Histogram of observed tRNA pulses per RNC with SRP-RNC binding events. (Upper right panel) Average tRNA pulse lifetimes, derived from single exponential fits to the pulse lifetimes. Error bars indicate 95% confidence of fits (n ≥ 269). (Lower left panel) Cumulative distributions of tRNA inter-pulse times (as determined from the beginning of one to the beginning to the next). (Lower right panel) Half-times of tRNA inter-pulse times (as shown in lower-left panel, normalized to the shortest half-time (0–5 amino acids). Colored bars indicate observed values and hatched, grey bars indicate expected values based on relative number of amino acids translated. DOI: http://dx.doi.org/10.7554/eLife.04418.014
Figure 3—figure supplement 3.
Figure 3—figure supplement 3.. Translation-calibrated SRP arrivals to RNCs.
Histograms showing how many amino acids have been translated when SRP arrives for the first (top panel), second (middle panel), or third (bottom panel) time to RNCs actively translating a lepB cWT mRNA. DOI: http://dx.doi.org/10.7554/eLife.04418.015
Figure 3—figure supplement 4.
Figure 3—figure supplement 4.. SRP binding before and after each tRNA pulse.
Heat plot showing the number of SRP-RNC binding events 60 s before or after the start of each tRNA pulse. DOI: http://dx.doi.org/10.7554/eLife.04418.016

References

    1. Berndt U, Oellerer S, Zhang Y, Johnson AE, Rospert S. 2009. A signal-anchor sequence stimulates signal recognition particle binding to ribosomes from inside the exit tunnel. Proceedings of the National Academy of Sciences of USA 106:1398–1403. doi: 10.1073/pnas.0808584106 - DOI - PMC - PubMed
    1. Bernstein HD, Zopf D, Freymann DM, Walter P. 1993. Functional substitution of the signal recognition particle 54-kDa subunit by its Escherichia coli homolog. Proceedings of the National Academy of Sciences of USA 90:5229–5233. doi: 10.1073/pnas.90.11.5229 - DOI - PMC - PubMed
    1. Bornemann T, Holtkamp W, Wintermeyer W. 2014. Interplay between trigger factor and other protein biogenesis factors on the ribosome. Nature Communications 5:4180. doi: 10.1038/ncomms5180 - DOI - PubMed
    1. Bornemann T, Jöckel J, Rodnina MV, Wintermeyer W. 2008. Signal sequence–independent membrane targeting of ribosomes containing short nascent peptides within the exit tunnel. Nature Structural & Molecular Biology 15:494–499. doi: 10.1038/nsmb.1402 - DOI - PubMed
    1. Chen J, Dalal RV, Petrov AN, Tsai A, O'Leary SE, Chapin K, Cheng J, Ewan M, Hsiung P-L, Lundquist P, Turner SW, Hsu DR, Puglisi JD. 2014a. High-throughput platform for real-time monitoring of biological processes by multicolor single-molecule fluorescence. Proceedings of the National Academy of Sciences of USA 111:664–669. doi: 10.1073/pnas.1315735111 - DOI - PMC - PubMed

Publication types

Substances

LinkOut - more resources