

Ultrasensitive proteome analysis using paramagnetic bead technology
- PMID: 25358341
- PMCID: PMC4299378
- DOI: 10.15252/msb.20145625
Ultrasensitive proteome analysis using paramagnetic bead technology
Abstract
In order to obtain a systems-level understanding of a complex biological system, detailed proteome information is essential. Despite great progress in proteomics technologies, thorough interrogation of the proteome from quantity-limited biological samples is hampered by inefficiencies during processing. To address these challenges, here we introduce a novel protocol using paramagnetic beads, termed Single-Pot Solid-Phase-enhanced Sample Preparation (SP3). SP3 provides a rapid and unbiased means of proteomic sample preparation in a single tube that facilitates ultrasensitive analysis by outperforming existing protocols in terms of efficiency, scalability, speed, throughput, and flexibility. To illustrate these benefits, characterization of 1,000 HeLa cells and single Drosophila embryos is used to establish that SP3 provides an enhanced platform for profiling proteomes derived from sub-microgram amounts of material. These data present a first view of developmental stage-specific proteome dynamics in Drosophila at a single-embryo resolution, permitting characterization of inter-individual expression variation. Together, the findings of this work position SP3 as a superior protocol that facilitates exciting new directions in multiple areas of proteomics ranging from developmental biology to clinical applications.
Keywords: mass spectrometry; paramagnetic beads; proteomics; quantification; sample preparation.
© 2014 The Authors. Published under the terms of the CC BY 4.0 license.
Figures
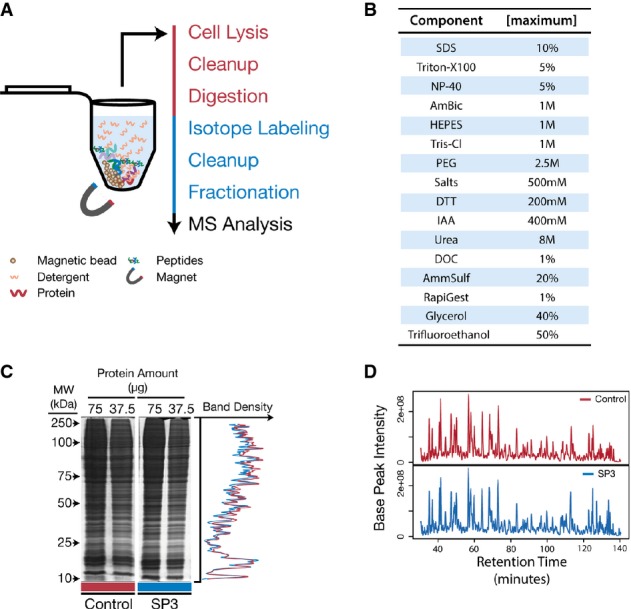
Schematic of the SP3 workflow in a single tube. Protein and peptide mixtures are bound to carboxylate-coated paramagnetic beads through the addition of acetonitrile in a manner similar to HILIC and ERLIC. Immobilization on the bead surface permits rinsing and removal of contaminating substances prior to proteolysis or MS analysis. Elution is performed directly into aqueous solution. Red text indicates steps carried out at the protein level, and blue are performed on peptides.
SP3 is compatible with a variety of commonly used reagents. Table of common reagents used in proteomics studies that we have tested and determined to be compatible with SP3. Listed values are the maximum concentrations tested. Reagents that do not appear in this table have not been tested and may be compatible with SP3.
SP3 demonstrates high recovery for both proteins and peptides. SDS–PAGE analysis of a yeast whole-cell lysate left untreated (Control) or treated with SP3. Numerical values at the top of each lane indicate the amount of starting material (μg of protein). Plot on the right displays overlaid densitometry data from the 37.5 μg lanes.
Base-peak chromatograms of equivalent peptide mixtures analyzed by MS after treatment with StageTips (Control) or with SP3.
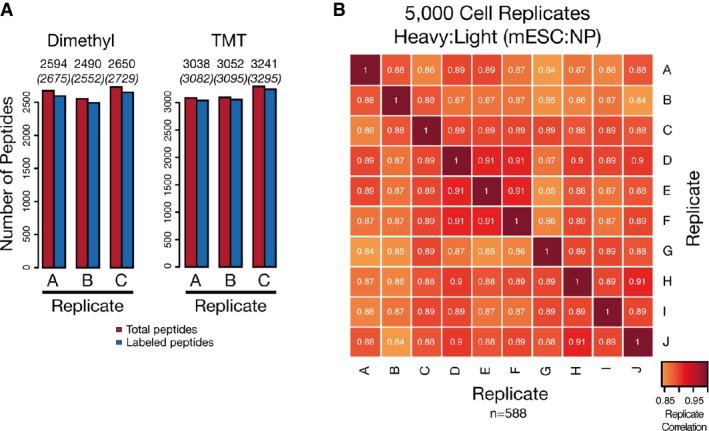
SP3 promotes efficient labeling of peptide mixtures. Labeling efficiency of dimethyl and TMT methods when coupled to SP3 as measured by the number of peptides identified as fully labeled or partially/not labeled with the expected tag in triplicate measurements. Values above columns indicate numbers of identified (in brackets) and labeled peptides.
SP3 enhances quantification reproducibility in quantity-limited samples. Replicates of 5,000 cell populations of mESC and NP cells were prepared using SP3 and analyzed with single-shot injections and a dimethyl tagging approach for quantification. A total of 10 individual biological replicates for each cell type (20 total samples) were prepared and analyzed. Intensity of each box represents the Pearson correlation between the heavy:light transformed (VSN) peptide areas translated into protein ratios (n = 588), with values displayed as text. Peptides were required to be quantified as heavy:light pairs in a minimum of 9 biological replicates.
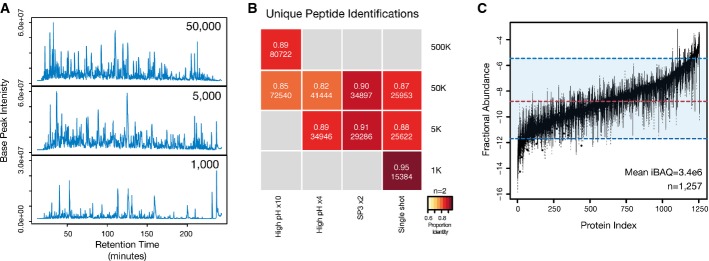
SP3 facilitates enhanced depth of coverage in quantity-limited samples. Base-peak chromatograms from single-shot injections of peptide mixtures prepared using a single-tube SP3 protocol from 50,000, 5,000, and 1,000 HeLa cells. In the cases of the 5,000 and 1,000 samples, the entire recovered peptide amount was injected. For the 50,000 cell sample, 25% of the recovered amount was injected to avoid overloading of the chromatography column.
Number and reproducibility of unique peptides (by sequence) identified in each analysis. The intensity of color in each block denotes the percentage overlap in peptides between replicate samples (n = 2 for all samples). Values in each block denote the fraction overlap and the total number of unique identifications from combined biological duplicates. The number following the × in each method indicates the number of fractions analyzed.
SP3 enables proteome profiling across a wide range of proteome abundance in quantity-limited samples. Box plot of fractional protein abundance values estimated from iBAQ values from the 50,000, 5,000, and 1,000 single-shot injections. Values for each protein represent mean iBAQ values from combined biological duplicates. Only proteins identified in all three combined single-shot samples are used in the analysis (n = 1,257). Dashed red and blue lines indicate the median and a range spanning 5–95% of log (iBAQ) values.
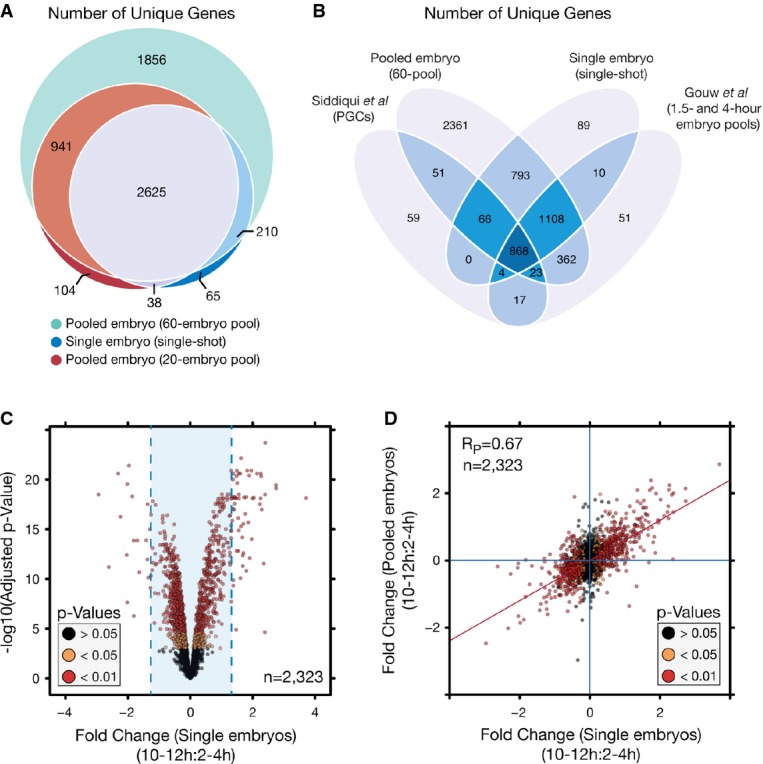
In-depth proteome coverage can be obtained across a wide range of pool sizes down to the single-embryo level with SP3. Venn diagram depicting the number of unique gene products (FlyBase accession) identified between different starting pools of embryos (60-embryo pool, n = 1, 20-embryo pool, n = 2, single embryos, n = 11). All samples are combined identifications from 2–4 to 10–12 h samples.
Number of unique gene products identified between single-embryo samples and published datasets focused on staged developmental proteome analysis.
SP3 permits quantitative analysis at the single-embryo level. Volcano plot depicting protein variance between 2- to 4-h and 10- to 12-h developmental time points in single-embryo samples. Fold changes were determined as a trimmed mean of VSN transformed peptide values. P-values were determined using limma with Benjamini–Hochberg correction for multiple testing. Values were calculated across a total of 11 biological replicates. Blue lines indicated the mean fold change, 0.014 ± 2.5 times the standard deviation.
Scatter plot of protein fold-change values between pooled and single-embryo samples illustrating the limited variation between fold-change values determined between the two study designs. Colorization is based on P-values determined through comparison of 2- to 4-h and 10- to 12-h stages in single-embryo samples. Blue lines indicate zero-fold-change values, and the red line is a linear fit to the data.
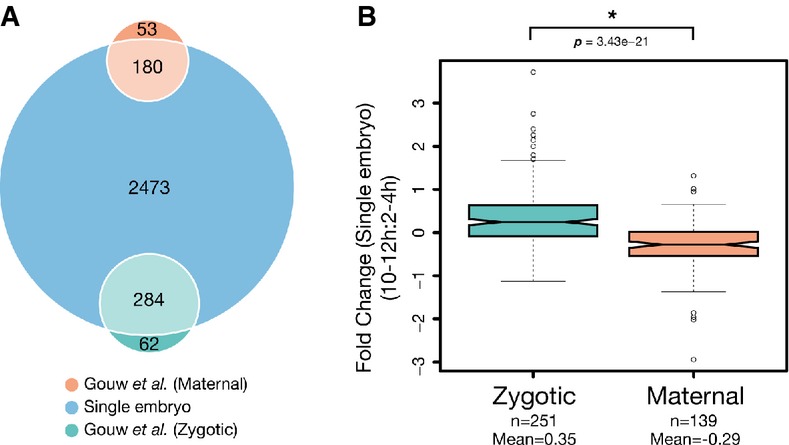
Venn diagram depicting the number of identified maternal and zygote-associated gene products in this study. Single-embryo data were annotated and compared with previously determined maternal-to-zygotic expression data (Gouw et al, 2009). Comparisons were made based on FlyBase gene accessions from both datasets.
Notched box plot of fold-change values from maternal and zygote-associated gene products between 2- to 4-h and 10- to 12-h samples. Whiskers indicate 1.5× the interquartile range, plus or minus the values for the third or first quartiles, respectively. P-values were determined using a Mann–Whitney U-test.
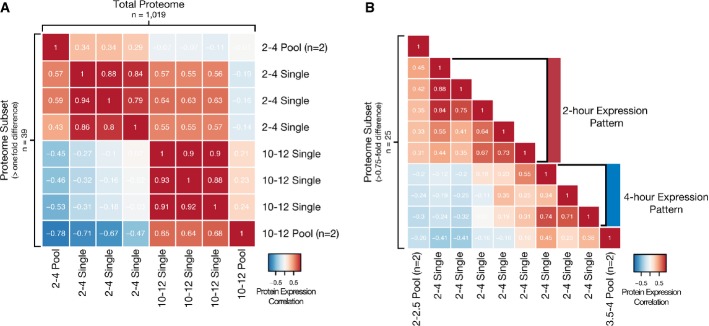
Single embryos can be mapped between time points with large divergence in protein expression. Low-resolution expression mapping based on 2- to 4-h and 10- to 12-h developmental stages. Heat map depicts the correlation between fold-change values relative to an internal standard for all proteins quantified (n = 1,019, upper triangular) or those with a difference in fold-change value > 1 (n = 39, lower triangular) between pooled (20 embryos each, n = 2 for each stage) and single embryos (n = 3 for each stage).
Single embryos can be mapped between time points with minimal divergence in protein expression. High-resolution expression mapping based on 2- to 2.5-h and 3.5- to 4-h developmental stages. Heat map depicts the correlation between fold-change values relative to an internal standard for proteins quantified with a difference in fold-change value > 0.75 (n = 25) between pooled (20 embryos each, n = 2 for each stage) and single embryos (n = 8).
Comment in
-
Efficient sample processing for proteomics applications--are we there yet?Mol Syst Biol. 2014 Oct 30;10(10):758. doi: 10.15252/msb.20145760. Mol Syst Biol. 2014. PMID: 25358342 Free PMC article.
References
-
- Alpert A. Hydrophilic-interaction chromatography for the separation of peptides, nucleic acids and other polar compounds. J Chromatogr A. 1990;499:177–196. - PubMed
-
- Alpert A. Electrostatic repulsion hydrophilic interaction chromatography for isocratic separation of charged solutes and selective isolation of phosphopeptides. Anal Chem. 2008;80:62–76. - PubMed
-
- Altelaar AFM, Heck AJR. Trends in ultrasensitive proteomics. Curr Opin Chem Biol. 2012;16:206–213. - PubMed
-
- Arbeitman MN, Furlong EEM, Imam F, Johnson E, Null BH, Baker BS, Krasnow MA, Scott MP, Davis RW, White KP. Gene expression during the life cycle of Drosophila melanogaster. Science. 2002;297:2270–2275. - PubMed
MeSH terms
Substances
LinkOut - more resources
Full Text Sources
Other Literature Sources
Molecular Biology Databases
