

Molecular profiling of single circulating tumor cells with diagnostic intention
- PMID: 25358515
- PMCID: PMC4237466
- DOI: 10.15252/emmm.201404033
Molecular profiling of single circulating tumor cells with diagnostic intention
Abstract
Several hundred clinical trials currently explore the role of circulating tumor cell (CTC) analysis for therapy decisions, but assays are lacking for comprehensive molecular characterization of CTCs with diagnostic precision. We therefore combined a workflow for enrichment and isolation of pure CTCs with a non-random whole genome amplification method for single cells and applied it to 510 single CTCs and 189 leukocytes of 66 CTC-positive breast cancer patients. We defined a genome integrity index (GII) to identify single cells suited for molecular characterization by different molecular assays, such as diagnostic profiling of point mutations, gene amplifications and whole genomes of single cells. The reliability of > 90% for successful molecular analysis of high-quality clinical samples selected by the GII enabled assessing the molecular heterogeneity of single CTCs of metastatic breast cancer patients. We readily identified genomic disparity of potentially high relevance between primary tumors and CTCs. Microheterogeneity analysis among individual CTCs uncovered pre-existing cells resistant to ERBB2-targeted therapies suggesting ongoing microevolution at late-stage disease whose exploration may provide essential information for personalized treatment decisions and shed light into mechanisms of acquired drug resistance.
Keywords: breast cancer; circulating tumor cells; metastasis; single cell analysis.
© 2014 The Authors. Published under the terms of the CC BY 4.0 license.
Figures
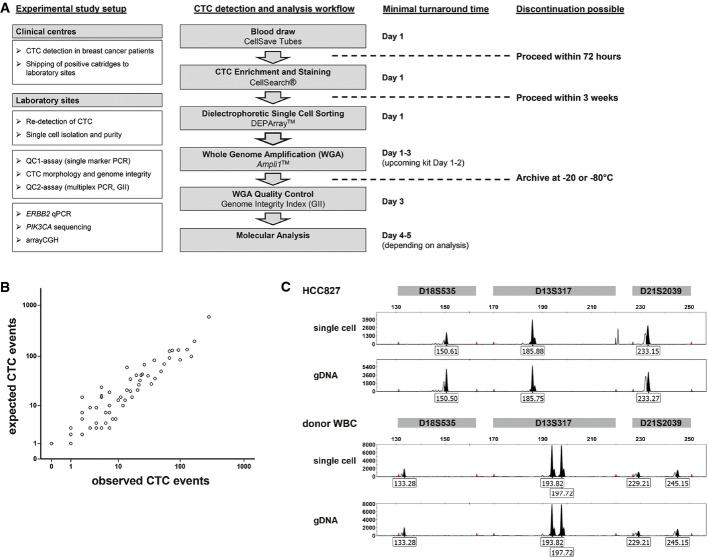
Flowchart summarizing the workflow for single CTC detection and molecular analysis. The boxes on the left depict analyses performed and methods developed during the course of the study. The final workflow is shown in the middle column, and minimal turnaround time for the complete workflow is shown on the right (assuming the blood drawn in the morning of day 1). Dashed lines indicate possible points of discontinuation during the workflow protocol.
Correlation between expected (as calculated from CellSearch® CTC count) and observed (as per DEPArray™ system) number of CTCs from 79 samples of 66 breast cancer patients (Spearman's rho correlation coefficient r = 0.94, P < 0.001).
Genomic fingerprint analysis of DEPArray™ isolated HCC827 cell line spiked in healthy donor blood. Allelic variants for three distinct genomic markers (D18S535, D13S317 and D21S2039) included in Ampli1™ STR kit are shown for HCC827 single cell, HCC827 genomic DNA, donor WBC single cell and donor WBC genomic DNA.
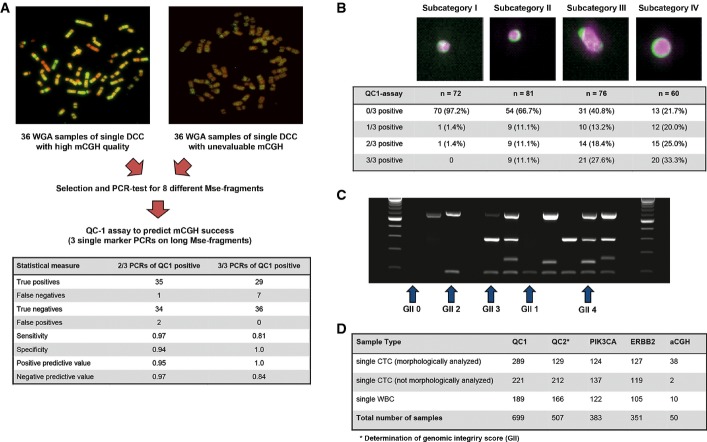
Representative metaphase CGH experiments for successful (left panel) and failing hybridizations (right panel), which were used to identify the three discriminating amplicons. Table summarizes assay performance for the selected primers.
CTC subcategories according to size and morphology (examples for subcategory I-IV from left to right) are associated with the detection of the QC1 assay amplicons (n = 289, chi-square, P < 0.00001).
Gel picture of the multiplex PCR assay (QC2 assay). Lanes are loaded (left to right): size marker, MU01 CTC04 (GII 0), MU22 CTC01 (GII 2), MU32 CTC01 (GII 2), TB 04 (GII 0), MU28 CTC04 (GII 3), MU35 CTC04 (GII 4), MU12 CTC05 (GII 1), MU28 CTC03 (GII 3), MU35 CTC01 (GII 2), MU28 CTC02 (GII 4), PCR positive control, PCR negative control, size marker.
Summary of sample numbers tested for the different molecular assays.
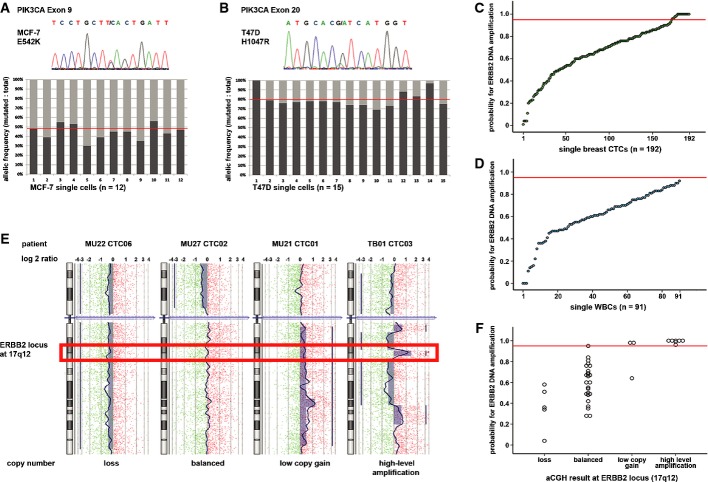
Exon 9 mutation E545K was detected in all single MCF-7 cells. The mutant allele is representing 45% of detected sequences averaged over all analyzed single cells and 48% in genomic DNA of MCF7 (right). The horizontal red line indicates the allelic ratio of non-amplified genomic DNA.
Exon 20 mutation H1047R was detected in all single T47D cells. The mutant allele is representing 80% of detected sequences averaged over all analyzed single cells, as well as in genomic DNA. Cell 01 shows an allelic loss of the wild-type sequence. The horizontal red line indicates the allelic ratio of non-amplified genomic DNA.
ERBB2 copy numbers were assessed by qPCR in 192 CTCs from breast cancer patients. Twenty-one single cells of 7 of 42 patients displayed an amplification probability above 95% (indicated by the red horizontal line).
ERBB2 amplification qPCR determined all single WBCs (n = 91) to be negative for ERBB2 amplification (below the red horizontal line).
High-resolution aCGH profiles of four individual cells showing DNA loss (left), balanced aCGH profile (second from left), low copy number gain (second from right) and high-level amplification (right) at ERBB2 locus (hybridization ratio for single probes shown on a log2 scale).
ERBB2 copy number by aCGH correlates with amplification probability score by qPCR. A qPCR amplification probability score ≥ 0.95 (red horizontal line) indicates ERBB2 amplification. Two samples dropped out of analysis due to failed amplification of qPCR fragments.
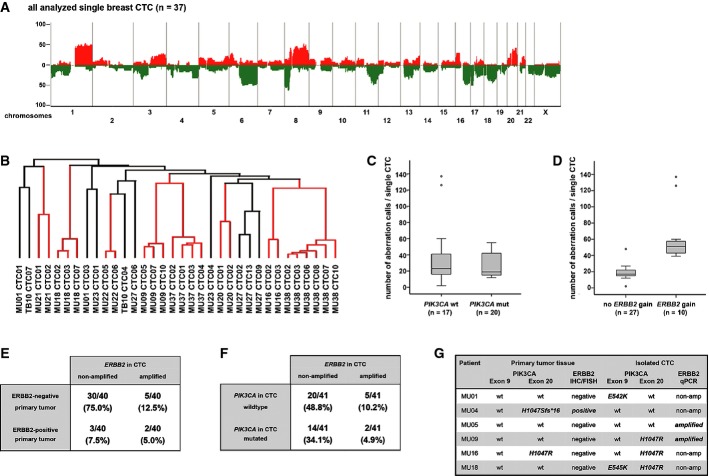
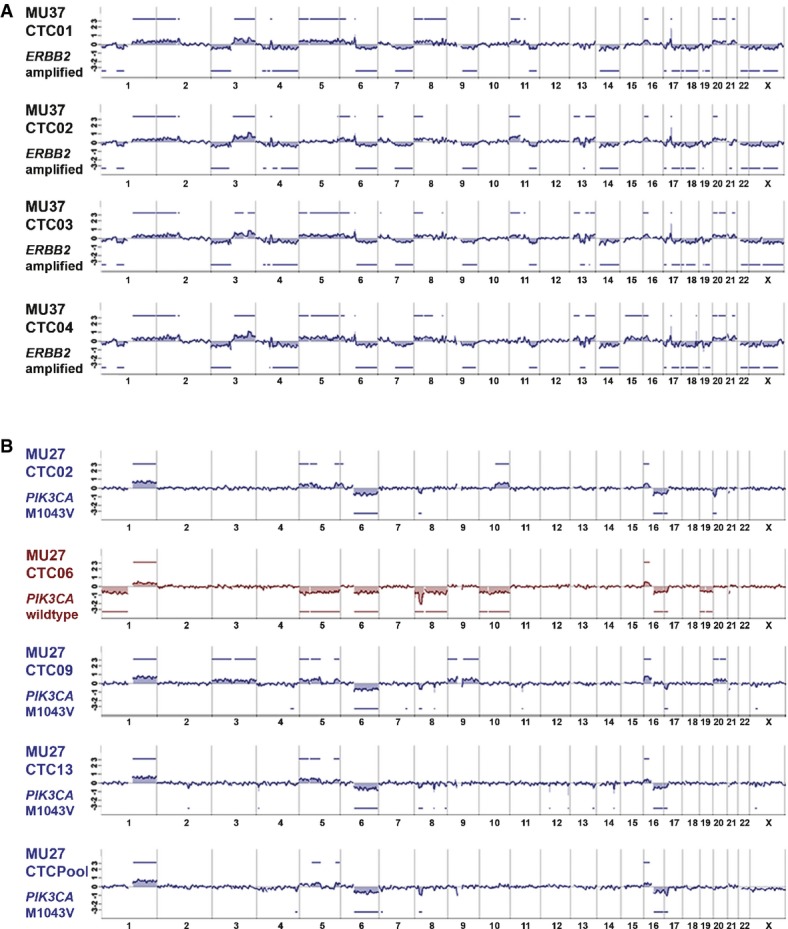
Genomic overview over four isolated single breast CTCs with ERBB2 amplification (patient MU37). All CTCs of patient MU37 show high number of chromosomal aberrations and high clonality in their genomic profile. ERBB2 high-level amplification for all CTCs was validated by qPCR assay (aberration calls depicted on y-axis in log-2 scale).
Genomic overview over four isolated single breast CTCs and a CTC pool from patient MU27. Three of four CTCs show highly similar genomes and M1043V mutations in exon 20 of PIK3CA as the analyzed CTC pool (blue profiles). However, one CTC (CTC06, red profile) displays several different chromosomal aberrations (aberration calls depicted on y-axis in log-2 scale) and lacks the M1043V mutation.
References
-
- Allard WJ, Matera J, Miller MC, Repollet M, Connelly MC, Rao C, Tibbe AG, Uhr JW, Terstappen LW. Tumor cells circulate in the peripheral blood of all major carcinomas but not in healthy subjects or patients with nonmalignant diseases. Clin Cancer Res. 2004;10:6897–6904. - PubMed
-
- Berns K, Horlings HM, Hennessy BT, Madiredjo M, Hijmans EM, Beelen K, Linn SC, Gonzalez-Angulo AM, Stemke-Hale K, Hauptmann M, et al. A functional genetic approach identifies the PI3K pathway as a major determinant of trastuzumab resistance in breast cancer. Cancer Cell. 2007;12:395–402. - PubMed
-
- Bidard FC, Peeters DJ, Fehm T, Nole F, Gisbert-Criado R, Mavroudis D, Grisanti S, Generali D, Garcia-Saenz JA, Stebbing J, et al. Clinical validity of circulating tumour cells in patients with metastatic breast cancer: a pooled analysis of individual patient data. Lancet Oncol. 2014;15:406–414. - PubMed
-
- de Bono JS, Scher HI, Montgomery RB, Parker C, Miller MC, Tissing H, Doyle GV, Terstappen LW, Pienta KJ, Raghavan D. Circulating tumor cells predict survival benefit from treatment in metastatic castration-resistant prostate cancer. Clin Cancer Res. 2008;14:6302–6309. - PubMed
Publication types
MeSH terms
LinkOut - more resources
Full Text Sources
Other Literature Sources
Medical
Molecular Biology Databases
Research Materials
Miscellaneous
