. 2014 Oct 31:5:5302.
doi: 10.1038/ncomms6302.

Coordinated regulation of photosynthesis in rice increases yield and tolerance to environmental stress

Affiliations

Coordinated regulation of photosynthesis in rice increases yield and tolerance to environmental stress

Madana M R Ambavaram et al. Nat Commun. .

Abstract

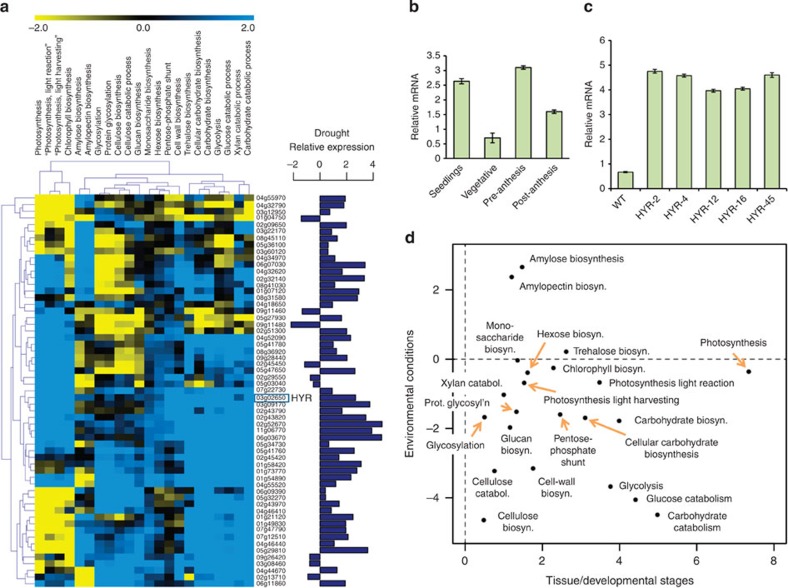
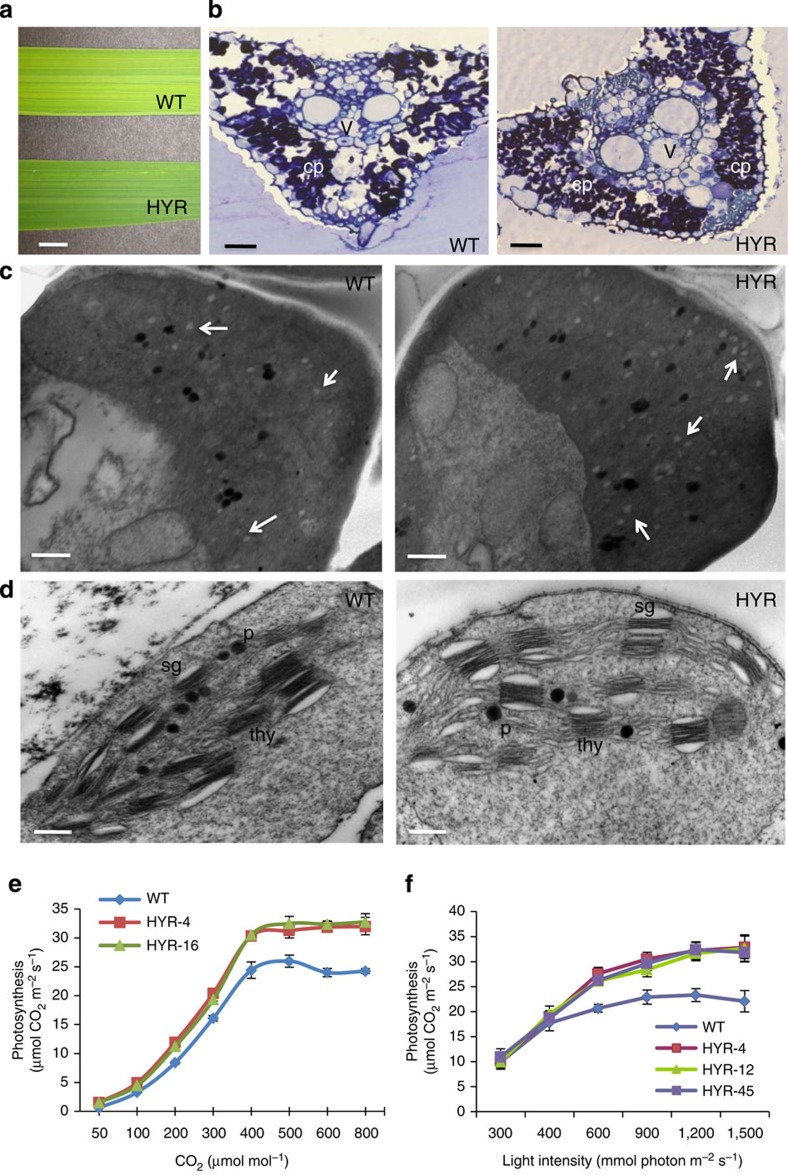
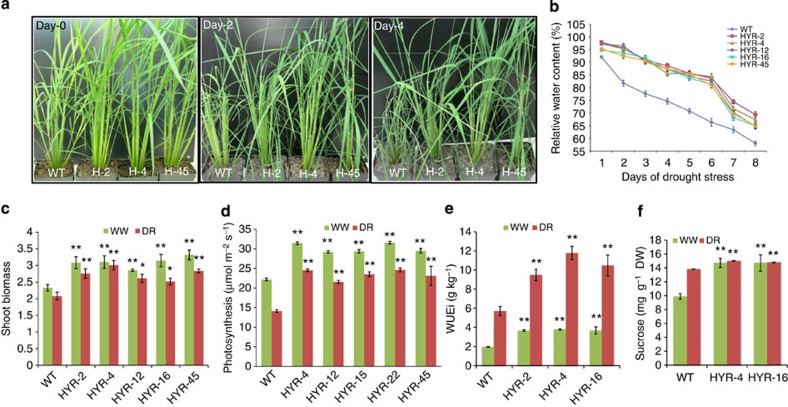
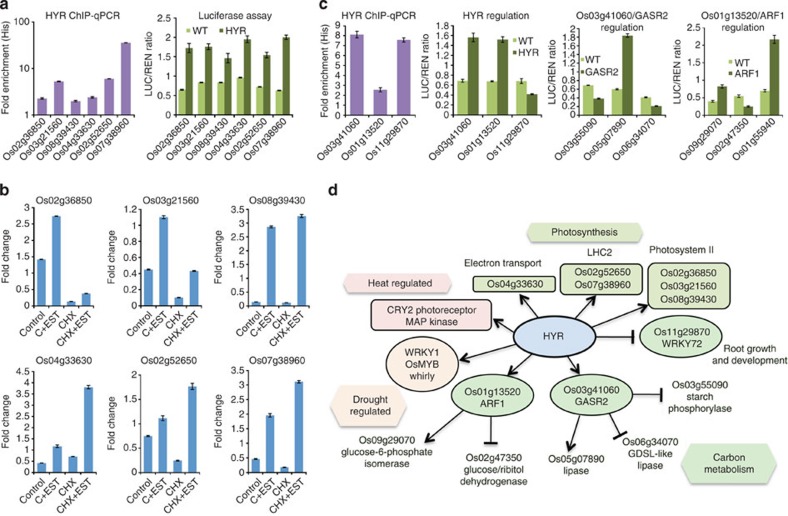
Plants capture solar energy and atmospheric carbon dioxide (CO2) through photosynthesis, which is the primary component of crop yield, and needs to be increased considerably to meet the growing global demand for food. Environmental stresses, which are increasing with climate change, adversely affect photosynthetic carbon metabolism (PCM) and limit yield of cereals such as rice (Oryza sativa) that feeds half the world. To study the regulation of photosynthesis, we developed a rice gene regulatory network and identified a transcription factor HYR (HIGHER YIELD RICE) associated with PCM, which on expression in rice enhances photosynthesis under multiple environmental conditions, determining a morpho-physiological programme leading to higher grain yield under normal, drought and high-temperature stress conditions. We show HYR is a master regulator, directly activating photosynthesis genes, cascades of transcription factors and other downstream genes involved in PCM and yield stability under drought and high-temperature environmental stress conditions.


Figures

Figure 1
Figure 1. Analysis of HYR gene expression and association to photosynthetic carbon metabolism (PCM) processes.
(a) Rice ‘conditional’ regulatory association network, represented by the heatmap showing specific associations of ‘carbohydrate metabolism’ (C) and ‘photosynthesis’-related (P) GO BP gene sets (along the columns) to AP2/ERF transcription factors (TFs; along the rows) under ‘control’ conditions. Blue indicates positive association and yellow indicates negative association, with HYR (Os03g02650) showing consistent positive association with PCM processes. The horizontal bar-plot next to the TFs represents the level of differential expression (log ratio) of these genes under drought. (b) Expression analysis of HYR in different growth stages by quantitative real-time qRT-PCR showing mean log-ratio of expression of HYR under drought compared with control, with error bars denoting the s.e.m.; n=3. (c) Expression of HYR in transgenic Nipponbare plants bearing the 35S-HYR gene shown by qRT-PCR, showing mean and s.e.m. (n=3). (d) Scatterplot showing the association scores of the PCM gene sets (‘C’ and ‘P’; Fig. 1a above) with HYR in two different conditional correlation networks, one built to emulate ‘control’ conditions (x axis) and the other to emulate ‘stress’ conditions (y axis). Thus, the x- and y coordinates of each point correspond to the association of a PCM gene set (for example, ‘photosynthesis’) to HYR under control (about 7.5) and stress (about −0.25) conditions. When the x and y values of a particular function, for example, ‘photosynthesis’, are very different, it signifies that the function’s associations with HYR is significantly altered by stress.
Figure 2
Figure 2. Morpho-physiological features of rice HYR lines showing enhanced photosynthesis parameters.
(a) Leaf blade phenotype of WT (upper) and a HYR line showing the darker-green leaf surface in HYR plants; scale bar, 1 cm. (b) Increased number of dark-staining chloroplasts (labelled ‘cp’) in HYR compared with WT, images taken by confocal microscopy of leaf sections stained with 1% Toluidine blue and photographed ( × 40) under identical settings, vascular bundles labelled ‘v’; scale bar, 50 μm. (c) Flag leaf parenchyma cells of WT and HYR plants visualized by transmission electron microscopy showing increased number of white starch granules (arrows) in HYR cells; scale bar, 4 μm. (d) Transmission electron micrographs of WT and HYR leaves, showing thylakoid ultrastructure of mesophyll chloroplasts after drought treatment; labels are sg, starch grain; p, plastoglobulus; thy, thylakoid; scale bar, 250 nm. (e) Assimilation rate as a function of increasing CO2 concentration at saturated light intensity of 1,500 mmol m−2 s−1 in WT and HYR lines, measured by portable photosynthesis system LI-6400XT, values are means±s.e. (n=6). (f) Assimilation rate as a function of increasing light intensity at CO2 concentration of 370 μmol mol−1 in WT and HYR lines measured by LI-6400XT system, values are means±s.e. (n=6).
Figure 3
Figure 3. Drought physiological response phenotypes of rice HYR lines at the vegetative stage.
(a) Effect of progressive drought (dry down) on rice WT and HYR lines at the vegetative stage: drought stress initiated at 6 weeks after germination, phenotype shown at Day 0, 2 and 4 after stress initiation. (b) Relative water content (RWC%) of WT and HYR lines measured at different days of stress, WT showing 75% and HYR lines maintain 85% RWC at day 4; RWC values are means±s.e. (n=6). (cf) Controlled drought-stress treatment (75% field capacity) response of HYR lines, well-watered shown in green bars and drought treatments in red, values are means±s.e. (n=6 for cf) and significance using t-test (*P≤0.05; **P≤0.01). (c) Comparison of shoot biomass; (d) gas-exchange analysis using portable photosynthesis system LI-6400XT showing photosynthetic rate; (e) instantaneous water-use efficiency WUEi; (f) total sucrose content of two HYR lines with values as mean±s.e. (n=4).
Figure 4
Figure 4. Root phenotype and response of HYR lines.
(a) Adventitious root phenotype of HYR (HYR-4) line and WT grown on nutrient-free medium for 7 days; scale bar, 1.5 mm. (b) Root morphology of WT and five HYR lines grown for 30 days in sand supplemented with Hoagland’s solution; scale bar, 2 cm. (c) HYR line (HYR-4) showing thicker roots compared with WT, photographed under light microscope; scale bar, 2 mm. (d) Quantification of HYR and WT root phenotypes shown in b, with the number of adventitious roots and the root length (cm), represented by mean±s.e. (n=6). (e) Root biomass analysis of WT and HYR lines under well-watered and drought-stress conditions in soil. Values are means±s.e. of (n=6 of each genotype), with significance shown (t-test; *P≤0.05; **P≤0.01). (f,g) Root ultrastructure of HYR lines shown by sections (1 cm above tip) of WT (f) and HYR (g), at low ( × 20) and high ( × 40, inset) magnification under light microscope; scale bar, 150 μm. The prominent structure of enlarged cortex (co), stele (st) and epidermis (ep) are seen in HYR root sections (g).
Figure 5
Figure 5. Grain yield (GY) components under normal and reproductive stage stress conditions.
(a) Maturing spikelets of WT and a HYR line showing higher grain filling under drought stress. (b) GY components of HYR compared with WT grown under well-watered control and reproductive stage drought-stress conditions. In this plot each data point represents a percentage of the mean values (n=10), with that of WT controls set at 100% as reference. Abbreviations for the components represent: NP (number of panicles per plant), PL (panicle length), NSP (number of spikelets per panicle); NFG (number of filled grain per plant); NGP (number of grains per panicle); GY (grain yield). Values are the mean±s.e. (n>6) and `**' indicates significant difference from wild-type, t-test at P<0.01. (c) Reproductive stage high-temperature stress of WT and HYR lines, the HYR lines showing increased GY under high-temperature (red) and normal (green) conditions. (d) Reduced chalkiness of harvested HYR line under high nighttime temperature given during the seed development stage, signifying better grain quality. Plants at the early-boot stage were exposed to high day/night temperature of 36/26 °C until physiological maturity. (e) Chalkiness of HYR and WT under high nighttime temperature expressed as % of mature grain with ≥50% chalkiness. Values are the mean±s.e. (n>6) and ‘*’ indicates significant difference from wild type, t-test at P<0.05.
Figure 6
Figure 6. HYR is a transcriptional regulator of photosynthesis and related morpho-physiological processes.
Three experimental methods (see Methods) to describe HYR function are denoted in graphs with different colours: ChIP-qPCR (purple) of HYR TAP-tagged plants assayed for HYR protein binding to promoters in planta (comparing, dual firefly-Renilla (LUC/REN) luciferase transactivation assays (light/dark green) with effector (TF expression) and reporter (promoter) constructs co-transformed in rice protoplasts, and steroid estradiol (EST)-inducible estrogen receptor (HER) assays (blue) with cycloheximide (CHX) treatment to prove direct transactivation of target gene promoter–reporter constructs (see Methods). All data presented are means of three biological replicates tested for significance using the t-test (P≤0.01), with significant treatments shown compared with relevant controls. (a,b) HYR binds to photosynthesis gene promoters and directly activates their transcription; the genes are involved in PSII (Os02g36850, Os03g21560 and Os08g39430), electron transport (Os04g33630) and LHC2 (Os02g52650 and Os07g38960). (c) HYR directly transcriptionally activates the PCM-regulating TFs GASR2 and ARF1, and represses OsWRKY72 shown by ChIP-qPCR and luciferase transactivation. Expression of the TFs GASR2 and ARF1 in luciferase transactivation assays show regulation of downstream genes (activation/repression), additional evidence direct regulation using HER fusions in EST/CHX assays (see Methods). (d) Model of HYR transcriptional regulatory network with direct transactivation shown by lines ending in arrows or repression by lines ending in bars. Gene directly regulated by HYR are shown as ovals (TFs) or rounded rectangles (other genes), and indirectly regulated by HYR are shown open. Hexagons designate pathways/processes regulated by HYR with the individual genes or functions highlighted in same colour as function names.

References

    1. Century K., Reuber T. L. & Ratcliffe O. J. Regulating the regulators: The future prospects for transcription-factor-based agricultural biotechnology products. Plant Physiol. 147, 20–29 (2008). - PMC - PubMed
    1. Gibson K. et al. Exploiting leaf starch synthesis as a transient sink to elevate photosynthesis, plant productivity and yields. Plant Sci. 181, 275–281 (2011). - PubMed
    1. Zhu X. G., Long S. P. & Ort D. R. Improving photosynthetic efficiency for greater yield. Annu. Rev. Plant Biol. 61, 235–261 (2010). - PubMed
    1. Karaba A. et al. Improvement of water use efficiency in rice by expression of HARDY, an Arabidopsis drought and salt tolerance gene. Proc. Natl Acad. Sci. USA 104, 15270–15275 (2007). - PMC - PubMed
    1. Jeong J. S. et al. Root-specific expression of OsNAC10 improves drought tolerance and grain yield in rice under field drought conditions. Plant Physiol. 153, 185–197 (2010). - PMC - PubMed

Publication types

MeSH terms

Associated data