. 2014 Dec;141(23):4618-27.
doi: 10.1242/dev.110544. Epub 2014 Oct 30.

The lncRNA Neat1 is required for corpus luteum formation and the establishment of pregnancy in a subpopulation of mice

Affiliations

The lncRNA Neat1 is required for corpus luteum formation and the establishment of pregnancy in a subpopulation of mice

Shinichi Nakagawa et al. Development. 2014 Dec.

Abstract

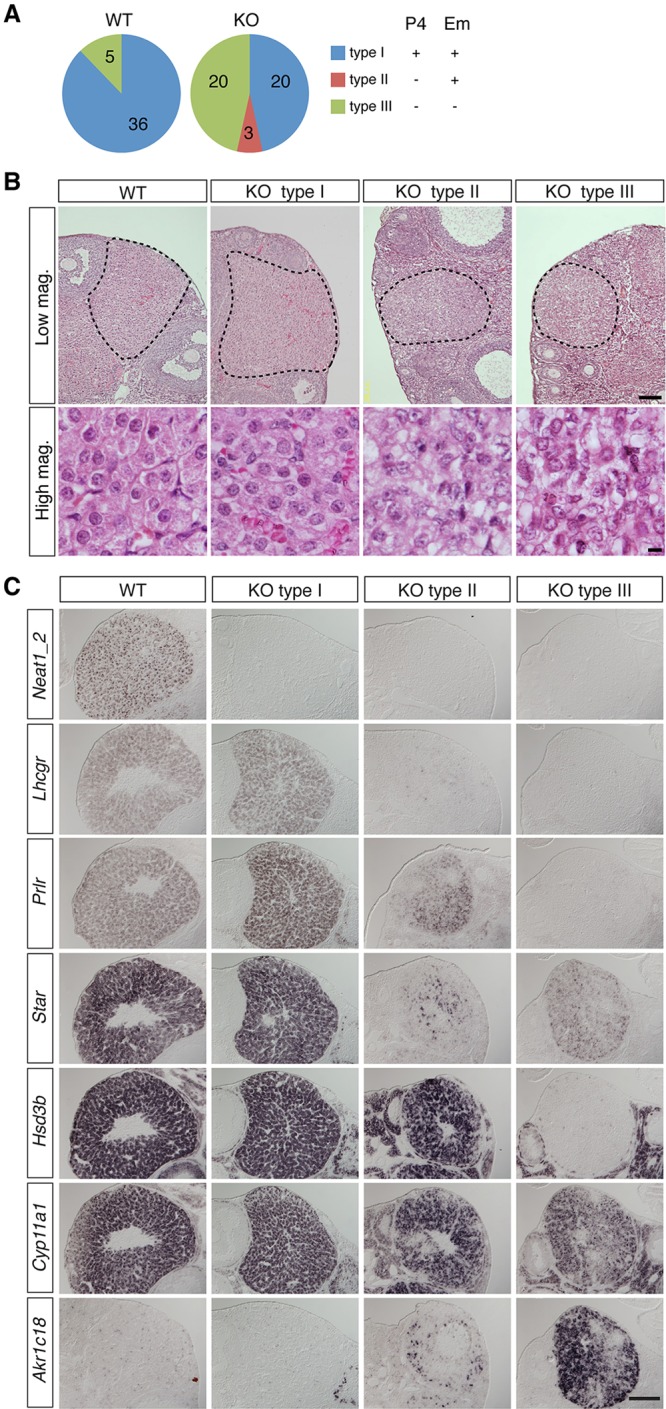
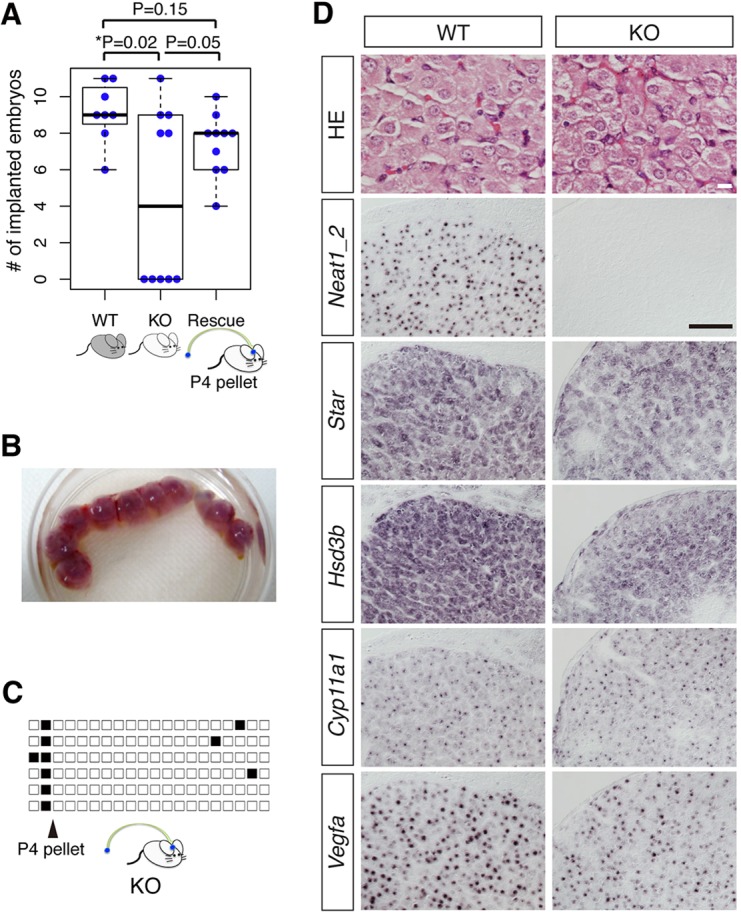
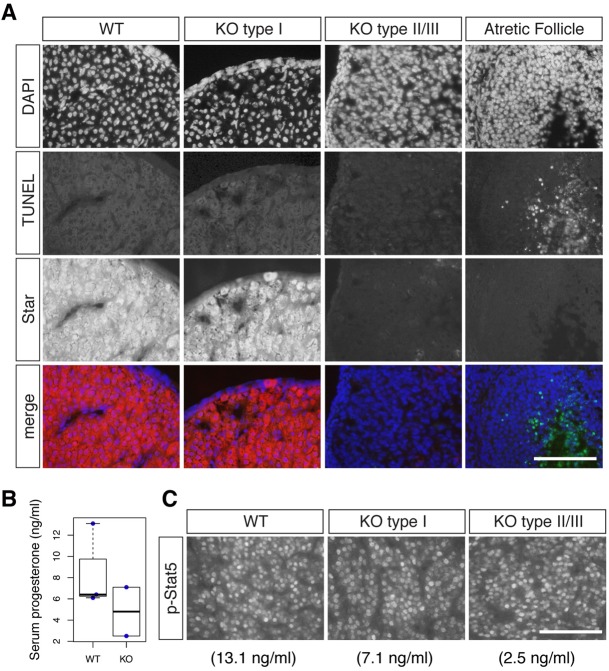
Neat1 is a non-protein-coding RNA that serves as an architectural component of the nuclear bodies known as paraspeckles. Although cell-based studies indicate that Neat1 is a crucial regulator of gene expression, its physiological relevance remains unclear. Here, we find that Neat1 knockout (KO) mice stochastically fail to become pregnant despite normal ovulation. Unilateral transplantation of wild-type ovaries or the administration of progesterone partially rescued the phenotype, suggesting that corpus luteum dysfunction and concomitant low progesterone were the primary causes of the decreased fertility. In contrast to the faint expression observed in most of the adult tissues, Neat1 was highly expressed in the corpus luteum, and the formation of luteal tissue was severely impaired in nearly half of the Neat1 KO mice. These observations suggest that Neat1 is essential for the formation of the corpus luteum and for the subsequent establishment of pregnancy under a suboptimal condition that has not yet been identified.

Keywords: Corpus luteum; Neat1; Paraspeckles; Progesterone; Sfpq; Stochastic failure.


Figures

Fig. 1.
Fig. 1.
Neat1 KO mice show decreased fertility. (A) Plot of the cumulative number of parturition events for Neat1 KO (magenta, n=10), heterozygous (black, n=10) and WT (blue, n=9) littermates. (B) Beeswarm boxplot of the number of parturition events by each individual. Each blue dot represents an individual mouse. (C) Plot of the cumulative number of pups delivered at parturition. (D) Beeswarm boxplot of the number of offspring delivered at parturition. Each blue dot represents an individual parturition event. (E) Beeswarm boxplot of the number of superovulated eggs. Each blue dot represents an individual mouse injected with hCG. (F) Beeswarm boxplot of the number of implanted embryos in a surrogate mother 14 days after transfer of in vitro fertilized eggs. The eggs were obtained from WT or Neat1 KO mice and in vitro fertilized with sperm from C57BL/6 mice. A total of 30 fertilized eggs were transplanted. Each blue dot represents an individual surrogate. (G) External appearance of embryos developed from eggs obtained from WT or Neat1 KO mice. Scale bar: 1 mm. (H) Beeswarm boxplot of the number of implanted embryos 5.5 days after natural mating. Each blue dot represents an individual. (I) Beeswarm boxplot of the number of implanted embryos recovered from plug-checked C57BL6 female mice mated with WT or Neat1 KO male mice. The embryos were counted at 7.5-14.5 dpc. (J) Daily record of copulation of WT, Neat1 KO and Neat1 KO with transplanted ovary (Rescue) mice. Female mice were mated with vasoligated males, and copulation was checked by the formation of a plug in the morning. Each black box represents the day at which plug formation was observed. Each row represents an individual animal. (K) Beeswarm boxplot of the number of implanted embryos at 7.5-14.5 dpc in sham-operated WT, sham-operated Neat1 KO and Neat1 KO transplanted with WT ovary (Rescue) mice. Ovarian transplantation increased the number of successful pregnancies. Each blue dot represents an individual animal. (L) Beeswarm boxplot of serum progesterone levels. Approximately half of the Neat1 KO mice failed to produce progesterone at high levels. Each blue dot represents an individual mouse. For all boxplots, the box represents the mean, 25th and 75th percentiles; whiskers show the maximum and minimum. All P values were calculated using a two-tailed, nonequal variance t-test.
Fig. 2.
Fig. 2.
Neat1_2 is strongly expressed in the corpus luteum and induces the formation of paraspeckles in luteal cells. (A) In situ hybridization analysis of the timecourse of Neat1_2 expression during corpus luteum development. The estrous cycle was synchronized with hCG, and the expression of Neat1_2 and corpus luteum markers were examined in adjacent sections using in situ hybridization at the indicated times after hCG injection. The right column (5.5 dpc) shows the expression in the pregnant ovary. (B,C) Formation of paraspeckles during corpus luteum development. The fluorescent in situ hybridization signals of Neat1_2 and immunostaining signals of the paraspeckle marker Sfpq were simultaneously detected in the cycling (B) and pregnant (C) corpus luteum. Arrowheads show accumulations of Neat1 and Sfpq. Paraspeckle formation was not observed in the corpus luteum of pregnant Neat1 KO mice (C). Scale bars: 100 µm (A), 10 µm (B,C). (D,E) Beeswarm boxplot of the qPCR analyses of Neat1_2 expression in cycling (D) and pregnant (E) corpus luteum. For all boxplots, the box represents the mean, 25th and 75th percentiles; whiskers show the maximum and minimum.
Fig. 3.
Fig. 3.
Corpus luteum formation is impaired in Neat1 KO mice. (A) Pie chart of the number of WT and Neat1 KO mice in each group (type I, II, III) categorized by the level of progesterone [P4; +, high (>10 ng/ml); −, low (<5 ng/ml)] and the presence (+) or absence (−) of implanted embryos (Em). The numbers indicate the number of animals in each group. (B) HE staining of 5.5 dpc ovaries from WT, type I, type II and type III Neat1 KO mice. The black outlines show the corpus luteum and corpus luteum-like tissues. Note the shrunken cytoplasm of the luteal cells in the type II and type III mice. High mag., higher magnification; Low mag., lower magnification. (C) In situ hybridization of 5.5 dpc WT and Neat1 KO mouse ovaries (type I, II, III) for various corpus luteum markers and Neat1_2. Adjacent sections were stained for each luteal gene. Scale bars: 100 μm (B, Low mag.), 10 µm (B, High mag., C).
Fig. 4.
Fig. 4.
Expression of luteal genes during the early development of the corpus luteum in Neat1 KO mice. (A) In situ hybridization of 0.5, 1.5 and 3.5 dpc WT and Neat1 KO mouse ovaries for various corpus luteum markers and Neat1_2. Note that type II and type III are indistinguishable at these preimplantation stages. Star was not upregulated in the presumptive type II and type III Neat1 KO mice at 1.5 and 3.5 dpc. (B) A summary of the timecourse of gene expression changes during corpus luteum development in WT and Neat1 KO mice. The first phenotype of Neat1 KO mice was characterized by the lack of uniform induction of Star in the luteal cells. Scale bar: 10 µm.
Fig. 5.
Fig. 5.
Decreased fertility of Neat1 KO mice is rescued by progesterone administration. (A) Beeswarm boxplot of the number of implanted embryos in WT, Neat1 KO and progesterone-administered Neat1 KO (Rescue) mice at 14.5 dpc. All of the mice given progesterone became pregnant. Each blue dot represents an individual mouse. Boxes represent the mean, 25th and 75th percentiles; whiskers show the maximum and minimum. (B) The uterus of a Neat1 KO mouse implanted with progesterone pellets at 14.5 dpc. (C) Daily record of copulation of Neat1 KO mice transplanted with progesterone pellets. The arrowhead indicates the day of transplantation. Each black box represents the day at which plug formation was observed. Each row represents an individual animal. (D) Histological and in situ hybridization analysis of the corpus luteum of WT and Neat1 KO mice transplanted with progesterone pellets. Note the slightly shrunken cytoplasm of the Neat1 KO luteal cells. The expression of Star, Hsd3b and Vegfa was slightly decreased in the Neat1 KO mice, whereas the expression of Cyp11a1 was not affected. Scale bars: 10 µm (HE staining), 100 µm (other panels). P values were calculated using a two-tailed, nonequal variance t-test.
Fig. 6.
Fig. 6.
Apoptotic cell death is not responsible for the reduction of Star expression. (A) Simultaneous detection of apoptotic cell death (using TUNEL, green) and of Star (red) in the corpus luteum of WT and Neat1 KO mice at 3.5 dpc. Note that TUNEL-positive cells are clearly found in the atretic follicles but not in the corpus luteum. DNA was counterstained with DAPI and pseudocolored in blue. (B) Beeswarm boxplot of serum progesterone levels at 1.5 dpc in WT and Neat1 KO mice. Boxes represent the mean, 25th and 75th percentiles; whiskers show the maximum and minimum. (C) Immunohistochemical analyses of phosphorylated Stat5 in the corpus luteum. The values below indicate the serum concentration of progesterone of each individual used for the immunostaining analyses. The mice used in this study are the same as those shown in Fig. 4 (1.5 dpc). Scale bars: 100 µm.
Fig. 7.
Fig. 7.
Nucleoplasmic Sfpq was increased in the luteal cells of type I Neat1 KO mice, but luteal gene expression was not greatly affected. (A) Immunohistochemical detection of Sfpq in the corpus luteum of WT and Neat1 KO mice. Scale bars: 100 µm [low magnification (Low mag.)], 10 µm [high magnification (High mag.)]. (B) Beeswarm boxplot of the quantified Sfpq signals in the nuclei of luteal cells in WT and Neat1 KO mice. WT (PS-) indicates the Sfpq signals in the nucleoplasm outside of the paraspeckles. Paraspeckles were identified by the expression of Neat1, and examples of the quantified areas are shown in blue. Each dot represents an individual luteal cell that was quantified. Boxes represent the mean, 25th and 75th percentiles; whiskers show the maximum and minimum. Three pairs of WT and KO ovaries were used to perform the quantification. (C) Beeswarm boxplot of the expression of luteal genes relative to Gapdh, as quantified by qPCR, in WT and type I Neat1 KO (KO) mice. Each blue dot represents an individual mouse. P values were calculated using a two-tailed, nonequal variance t-test.

References

    1. Barkley M. S., Bradford G. E. and Geschwind I. I. (1978). The pattern of plasma prolactin concentration during the first half of mouse gestation. Biol. Reprod. 19, 291-296 10.1095/biolreprod19.2.291 - DOI - PubMed
    1. Batista P. J. and Chang H. Y. (2013). Long noncoding RNAs: cellular address codes in development and disease. Cell 152, 1298-1307 10.1016/j.cell.2013.02.012 - DOI - PMC - PubMed
    1. Bond C. S. and Fox A. H. (2009). Paraspeckles: nuclear bodies built on long noncoding RNA. J. Cell Biol. 186, 637-644 10.1083/jcb.200906113 - DOI - PMC - PubMed
    1. Chen L.-L. and Carmichael G. G. (2009). Altered nuclear retention of mRNAs containing inverted repeats in human embryonic stem cells: functional role of a nuclear noncoding RNA. Mol. Cell 35, 467-478 10.1016/j.molcel.2009.06.027 - DOI - PMC - PubMed
    1. Chen L.-L. and Carmichael G. G. (2010). Decoding the function of nuclear long non-coding RNAs. Curr. Opin. Cell Biol. 22, 357-364 10.1016/j.ceb.2010.03.003 - DOI - PMC - PubMed

Publication types

MeSH terms