. 2014 Oct 16:8:111.
doi: 10.3389/fnana.2014.00111. eCollection 2014.

Enhancement of median nerve regeneration by mesenchymal stem cells engraftment in an absorbable conduit: improvement of peripheral nerve morphology with enlargement of somatosensory cortical representation

Affiliations

Enhancement of median nerve regeneration by mesenchymal stem cells engraftment in an absorbable conduit: improvement of peripheral nerve morphology with enlargement of somatosensory cortical representation

Julia T Oliveira et al. Front Neuroanat. .

Abstract

We studied the morphology and the cortical representation of the median nerve (MN), 10 weeks after a transection immediately followed by treatment with tubulization using a polycaprolactone (PCL) conduit with or without bone marrow-derived mesenchymal stem cell (MSC) transplant. In order to characterize the cutaneous representation of MN inputs in primary somatosensory cortex (S1), electrophysiological cortical mapping of the somatosensory representation of the forepaw and adjacent body parts was performed after acute lesion of all brachial plexus nerves, except for the MN. This was performed in ten adult male Wistar rats randomly assigned in three groups: MN Intact (n = 4), PCL-Only (n = 3), and PCL+MSC (n = 3). Ten weeks before mapping procedures in animals from PCL-Only and PCL+MSC groups, animal were subjected to MN transection with removal of a 4-mm-long segment, immediately followed by suturing a PCL conduit to the nerve stumps with (PCL+MSC group) or without (PCL-Only group) injection of MSC into the conduit. After mapping the representation of the MN in S1, animals had a segment of the regenerated nerve processed for light and transmission electron microscopy. For histomorphometric analysis of the nerve segment, sample size was increased to five animals per experimental group. The PCL+MSC group presented a higher number of myelinated fibers and a larger cortical representation of MN inputs in S1 (3,383 ± 390 fibers; 2.3 mm(2), respectively) than the PCL-Only group (2,226 ± 575 fibers; 1.6 mm(2)). In conclusion, MSC-based therapy associated with PCL conduits can improve MN regeneration. This treatment seems to rescue the nerve representation in S1, thus minimizing the stabilization of new representations of adjacent body parts in regions previously responsive to the MN.

Keywords: cortical plasticity; median nerve lesion; nerve regeneration; polycaprolactone conduits; rat; stem-cell therapy.


Figures

FIGURE 1
FIGURE 1
Morphological analysis of the regenerated MN. (A,B) Low-magnification micrographs of toluidine blue stained semi-thin cross sections of the MN regenerated through the PCL tube in PCL-Only (A) and PCL+MSC (B) groups. Scale bar: 50 μm. (C,D) Higher magnifications of (A,B), exhibiting clusters of regenerating fibers (fascicles). Scale bar: 20 μm. (E,F) Electron micrographs of ultrathin cross sections of the MN, displaying myelinated (asterisks) and non-myelinated (arrows) nerve fibers. Scale bar: 2 μm. (G–K) Histomorphometric analysis of the regenerated MN. Values described for the normal nerve by Muratori et al. (2012) for each parameter analyzed are depicted in the bottom left corner and at the left of the graphs (in G,K) as horizontal lines representing the mean (continuous line) ±standard deviation (dashed lines). (G) The total number of myelinated fibers (MFs) in the PCL+MSC group (gray bar) is higher than in the PCL-Only group (black bar; p < 0.001). (H) Percentage of MFs in different ranges of axon diameters. (I) Percentage of MFs in different fiber diameter ranges. Fiber diameter corresponds to the diameter of the axon plus the thickness of the myelin sheath. In the PCL-Only group, there was a higher percentage of MFs in the 3.00–3.99 m range than in the PCL+MSC group (p < 0.01). (J) G-ratio analysis showed a higher percentage of MFs in the PCL-Only group than in the PCL+MSC group in the 0.70–0.79 range (p < 0.05), which is similar to values found in the normal rat MN (Muratori et al., 2012). (K) The thickness of the myelin sheath is equivalent when all fibers of the two groups are compared. p < 0.05, ∗∗ p < 0.01, ∗∗∗p < 0.001.
FIGURE 2
FIGURE 2
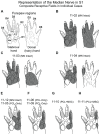
Composite receptive fields (shaded area) in nine different mapping experiments from the three experimental groups. These composite receptive fields can be interpreted as the part of the skin innervated by the isolated MN. (Cortical maps from these experiments are illustrated in Figures 4–7). (A) Schematics showing the different regions of the rat forepaw: D1–D5 and palmar pads, including the Th and HTh pads, and the pads close to the digits (P1, P2, P3). (BH) Composite receptive fields varied in individual cases. Cases presenting the same composite RF were illustrated together (E,F). In cases from the MN intact group (in B–E), the RMN always included the representation of Th, P1, and P2, plus the glabrous skin of D1 and D2. In PCL-Only (E,F) and PCL+MSC (G,H) experiments, composite RFs mapped in the RMN were restricted to smaller areas of the glabrous skin of the forepaw located close to and including D1 and D2. Quantitative data for each experiment (except for cases 11-05 and 11-06) are shown in Figure 3.
FIGURE 3
FIGURE 3
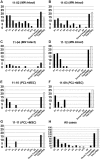
Quantification of the representation of different parts of the forepaw in the RMN. The number of recording sites with neurons responsive to cutaneous stimulation of different forepaw regions is illustrated in seven experiments (y-axis in A–G). The summation of all seven experiments is shown in (H). The forepaw was subdivided in the 11 regions depicted in Figure 2A: D1–D5; Th, HTh, P1, P2, and P3; plus dorsal forepaw. Only sites containing neurons responsive to superficial cutaneous stimulation of the forepaw (thus part of the RMN) were quantified (black bars). For comparison, the number of sites inside the FBS, whether containing neurons responsive to cutaneous stimulation or not, was also illustrated (white bars). “Total (RMN)” refers to the number of sites inside the RMN. Note that a single multiunit receptive field mapped in a given recording site could encompass more than one forepaw region. Thus, this site would be represented in more than one bar in the graph, since each bar corresponds to a single forepaw region. RMN mapped in the MN Intact group seemed to encompass broader regions of the forepaw than in the PCL+MSC group. D1 was the most represented parts of the forepaw in all experiments, being closely followed by Th. Composite receptive fields of these experiments are represented in Figure 2. Respective electrophysiological maps are represented in Figures 47.
FIGURE 4
FIGURE 4
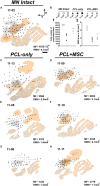
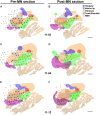
Examples of the region covered by the RMN (gray zone) mapped in individual experiments from different experimental groups and respective quantitative data. The RMN corresponded to the region of S1 containing neurons responsive to superficial cutaneous stimulation of the forepaw after all brachial plexus nerves were cut, except for the MN. The cortical region mapped comprised the FBS and its surroundings. (A) Case 11-02 from the MN Intact group. In this experiment, the RMN occupies 5.1 mm2 (as depicted in the inferior right corner). MF in the normal (not previously cut) MN was obtained by Ronchi et al. (2009). (B) Quantitative data from individual experiments of the MN Intact (white labels), PCL-Only (black labels), and PCL+MSC (gray labels) groups. Top: labels used in the graphs below representing individual experiments. Left: number of MFs in the MNs that regrew through a PCL tube. For reference, MF in the normal nerve obtained by Ronchi et al. (2009) is represented as horizontal lines on the left of the graph (continuous line: mean; dashed lines: standard deviations). Right: size of the area of the RMN in nine experiments. (C,E,G) Individual experiments from the PCL-Only experimental group. Ten weeks before mapping procedures, animals in this group underwent resection of a 4-mm long segment of the MN, followed by immediate repair with microsurgical implantation of a PCL tube through which the MN could regrow from the proximal to the distal stump, and then reinnervate the forepaw. After mapping procedures, the repaired MN was transversally cut at the level of the PCL tube, submitted to conventional histological processing, and MF was counted in semi-thin sections under light microscopy. MF and the area occupied by the RMN are both depicted in the lower right corner of each experiment. (D,F,H) PCL+MSC group. This group underwent the same procedures adopted in the PCL-Only group plus the injection of MSC into the PCL tube before suturing the distal stump of the MN to the tube. RMN area in MN Intact group showed higher values compared with MN repaired groups (11-03: 4.0 mm2; 11-12: 4.5 mm2; and 11-02: 5.1 mm2). PCL+MSC group presented larger RMN areas and higher MFs (1.7 mm2, 3779; 2.1 mm2, 3245; 3.1 mm2, 2806; in D,F,H, respectively) than the PCL-Only group (1.2 mm2, 1243; 1.6 mm2, 2332; 2.0 mm2, 2568; in C,E,G, respectively). Although both MF and RMN size were higher in the PCL+MSC group than in the PCL-Only group, a higher number of MF does not necessarily explain a larger RMN. For example, when cases of the PCL+MSC group are compared with each other. In A,C–H, beige contours represent individual barrels (continuous contours) or regions of intense cytochrome oxidase reactivity in which individual barrels were not clear or not detected (dashed contours). The forepaw barrel subfield (FBS) corresponds to the dashed beige contour in which most of the recording sites (dots) are located. Note that, except for cases 11-05 (E) and 11-06 (G), most of the FBS was activated by MN inputs. Filled dots: recording sites with clear responses to light cutaneous stimulation (Filled dots outside the grey area correspond to sites where neurons were responsive to superficial cutaneous stimulation of other body parts not including the forepaw). Empty dots: sites responsive to deep stimulation and/or weakly responsive to superficial stimulation. X: sites not responsive to somatosensory stimulation.
FIGURE 5
FIGURE 5
RMN and barrel fields in case 11-12 (MN Intact group).(A) Schematic representation of the barrel cortex as evidenced by cytochrome oxidase histochemistry obtained in this case and the location of mapping sites. Conventions for representing somatosensory maps and barrel fields are the same as adopted in Figure 4. (B) Somatosensory map illustrating the representation of different body parts with different colors, as depicted by the legend on the right. Two rows of sites (“1” to “11” and “a” to “f”) provide examples of progressions along the antero-to-posterior and medial-to-lateral axis, respectively. The corresponding multiunit receptive fields of each of these sites are depicted in (C) with the same numbers or letters.
FIGURE 6
FIGURE 6
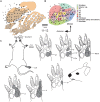
Neuronal responses relayed by the MN to individual barrels of the FBS. Case 11-03 (MN Intact). (A) Composite photomicrograph of two adjacent tangential sections processed for cytochrome oxidase and location of some of the recording sites studied in this experiment. In this preparation, one can identify individual barrels located in the FBS, in the superior and inferior lip barrel fields, and in part of the E-row vibrissae representation of the postero medial barrel subfield (large barrels at the right side of the figure, pointed by an arrow in B). Arrows point to FBS barrel rows. (B) Schematic drawing corresponding to the photomicrograph in (A). Dashed lines contour three different barrel fields. The top contour corresponds to the FBS. Individual barrels are in gray. The representation of D2–D5 in normal (non-deafferented) rats (as demonstrated by Waters et al., 1995) corresponds to the different barrel rows indicated by arrows. (C) Receptive fields of neurons recorded in the sites numbered in (A,B). The complete map of this experiment is represented in Figure 7A.
FIGURE 7
FIGURE 7
Cutaneous representation in sites surrounding the RMN, and the immediate modification of neuronal responses following MN transection, in three cases of the MN Intact group: 11-03 (A,B), 11-04 (C,D), and 11-12 (E,F). (A,C,E) Same conventions as in Figure 4 are adopted here. Note that the RMN (transparent gray zone) and the FBS (in beige) correspond grossly to the same cortical region. Colored splotches are regions containing neurons activated by stimulation of the inferior lip (purple), vibrissae (green), hind paw (blue), or the shoulder/neck region (red). (B,D,F) After mapping the RMN, the MN was then transected and the same cortical region was then remapped (red circles and “X”s). In the absence of inputs from the forepaw, most of the neurons in the RMN became unresponsive (red “X”s); but in a few sites neurons that were previously responsive to forepaw stimulation became activated by light cutaneous stimuli delivered to the face, shoulder, trunk, and/or hindpaw, depending on the location of the recording site (colored splotches “invading” the gray zone). Scale bar = 1 mm.

References

    1. Anomal R. F., Rocha-Rego V., Franca J. G. (2011). Topographic organization and corticocortical connections of the forepaw representation in areas S1 and SC of the opossum: evidence for a possible role of area SC in multimodal processing. Front. Neuroanat. 5:56. 10.3389/fnana.2011.00056 - DOI - PMC - PubMed
    1. Brooke G., Cook M., Blair C., Han R., Heazlewood C., Jones B., et al. (2007). Therapeutic applications of mesenchymal stromal cells. Semin. Cell Dev. Biol. 18 846–858. 10.1016/j.semcdb.2007.09.012 - DOI - PubMed
    1. Calford M. B. (2002). Dynamic representational plasticity in sensory cortex. Neuroscience 111 709–738. 10.1016/S0306-4522(02)00022-2 - DOI - PubMed
    1. Chang C. J. (2009). The effect of pulse-released nerve growth factor from genipin-crosslinked gelatin in Schwann cell-seeded polycaprolactone conduits on large-gap peripheral nerve regeneration. Tissue Eng. Part A 15 547–557. 10.1089/ten.tea.2007.0342 - DOI - PubMed
    1. Chapin J. K., Lin C. S. (1984). Mapping the body representation in the SI cortex of anesthetized and awake rats. J. Comp. Neurol. 229 199–213. 10.1002/cne.902290206 - DOI - PubMed

LinkOut - more resources