. 2014 Oct 16:8:115.
doi: 10.3389/fnana.2014.00115. eCollection 2014.

Homeostatic structural plasticity can account for topology changes following deafferentation and focal stroke

Affiliations

Homeostatic structural plasticity can account for topology changes following deafferentation and focal stroke

Markus Butz et al. Front Neuroanat. .

Abstract

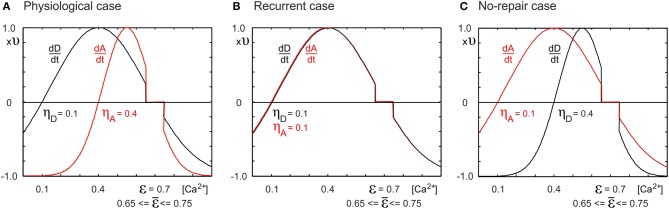
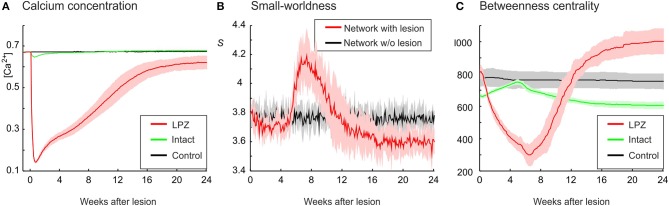
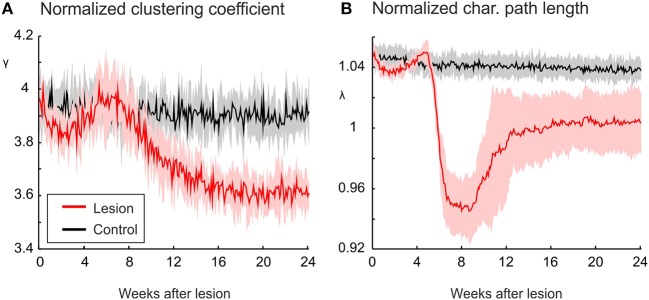
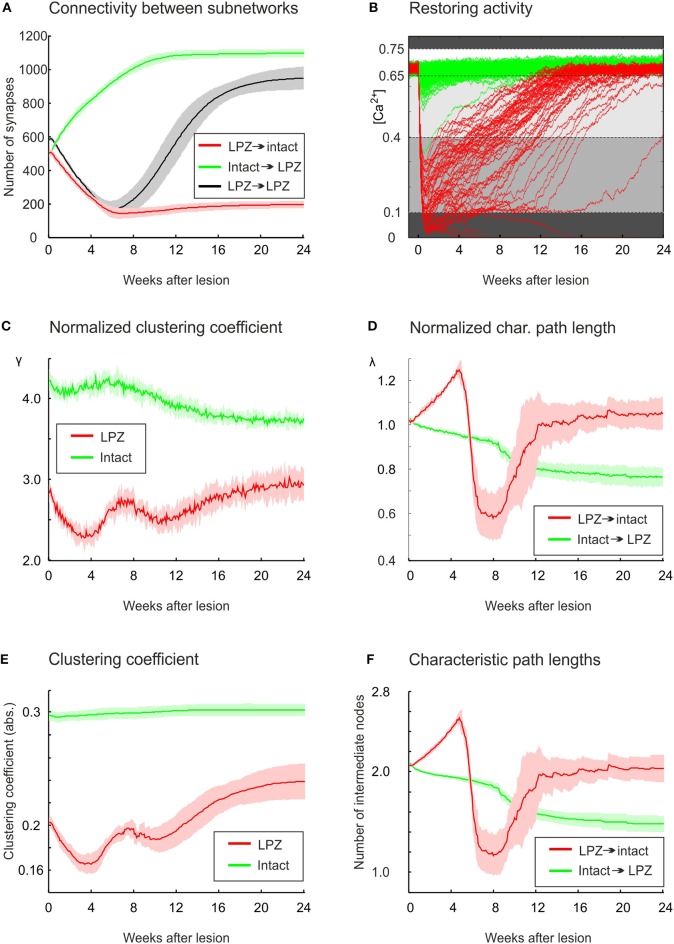
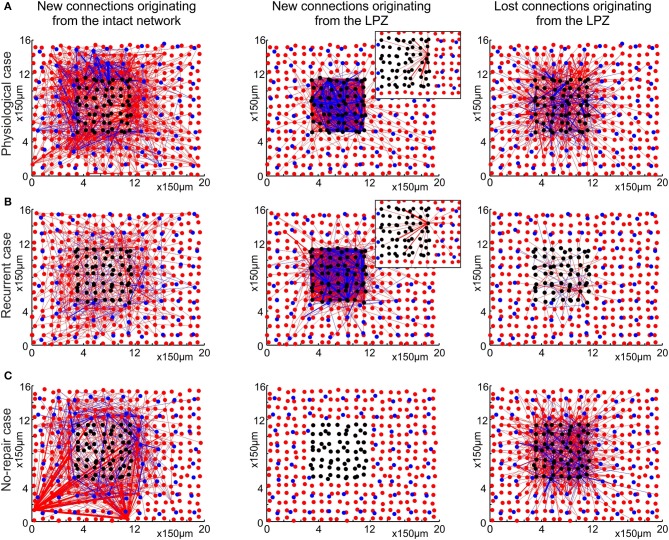
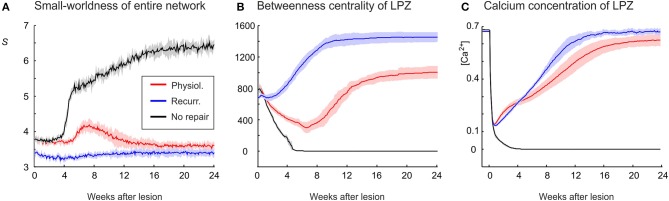
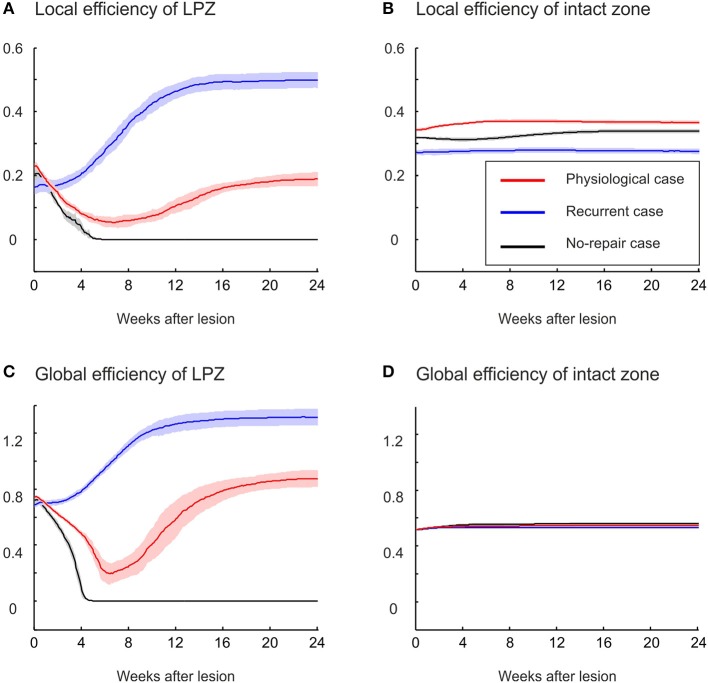
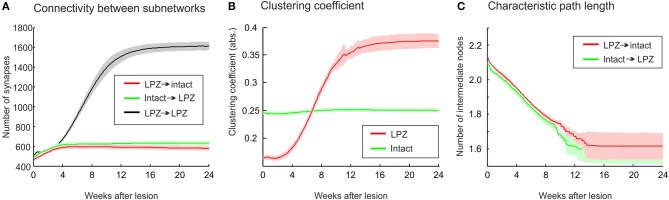
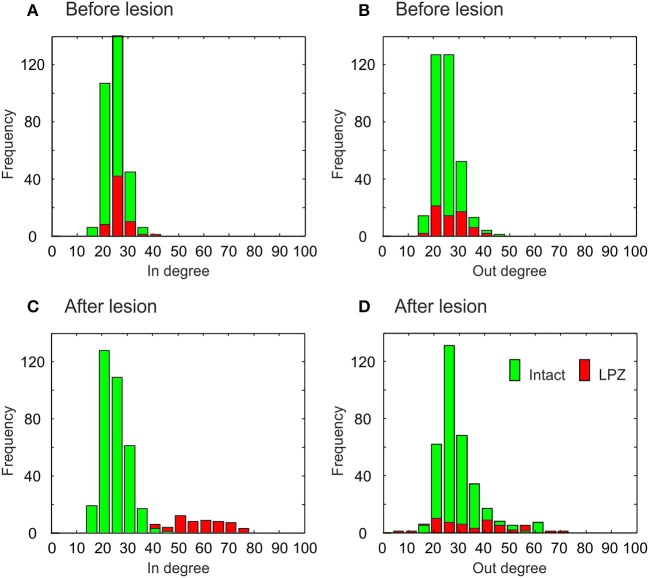
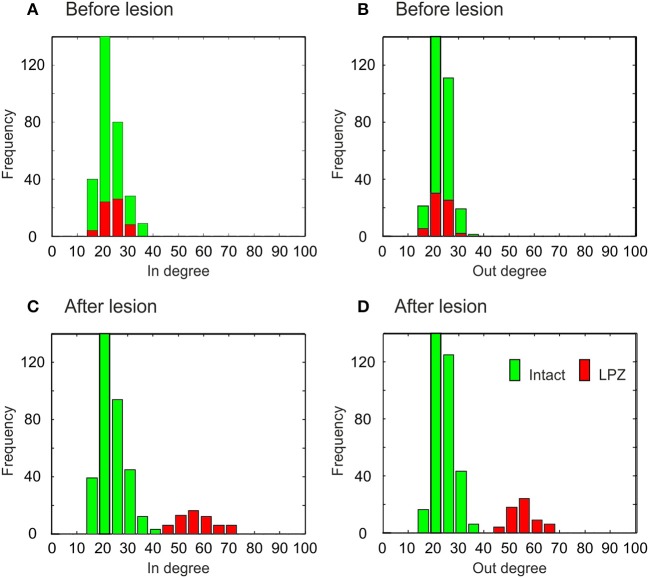
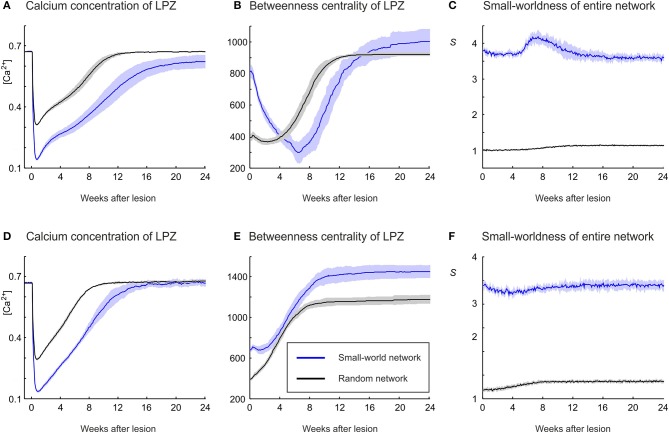
After brain lesions caused by tumors or stroke, or after lasting loss of input (deafferentation), inter- and intra-regional brain networks respond with complex changes in topology. Not only areas directly affected by the lesion but also regions remote from the lesion may alter their connectivity-a phenomenon known as diaschisis. Changes in network topology after brain lesions can lead to cognitive decline and increasing functional disability. However, the principles governing changes in network topology are poorly understood. Here, we investigated whether homeostatic structural plasticity can account for changes in network topology after deafferentation and brain lesions. Homeostatic structural plasticity postulates that neurons aim to maintain a desired level of electrical activity by deleting synapses when neuronal activity is too high and by providing new synaptic contacts when activity is too low. Using our Model of Structural Plasticity, we explored how local changes in connectivity induced by a focal loss of input affected global network topology. In accordance with experimental and clinical data, we found that after partial deafferentation, the network as a whole became more random, although it maintained its small-world topology, while deafferentated neurons increased their betweenness centrality as they rewired and returned to the homeostatic range of activity. Furthermore, deafferentated neurons increased their global but decreased their local efficiency and got longer tailed degree distributions, indicating the emergence of hub neurons. Together, our results suggest that homeostatic structural plasticity may be an important driving force for lesion-induced network reorganization and that the increase in betweenness centrality of deafferentated areas may hold as a biomarker for brain repair.

Keywords: deafferentation; epileptogenesis; focal retinal lesion; homeostatic plasticity; neuronal network model; stroke; structural plasticity; topology.


Figures

Figure 1
Figure 1
Depending on the neuronal growth curves for the change dD/dt in number of dendritic elements and the change dA/dt in number of axonal elements, network reorganization after lesions leads to different network topologies. Changes in the number of elements are dependent on the time-averaged neuronal electrical activity as measured by the cell's intracellular calcium concentration [Ca2+]. (A) If the minimal activity for dendritic element formation is lower than that for axonal element formation (ηD = 0.1, ηA = 0.4, respectively), networks reorganize in a physiological manner, with axonal and dendritic element dynamics (Butz and van Ooyen, 2013) resembling experimental observations (Keck et al., 2008). (B) If dendritic and axonal elements can already grow at low activity levels (ηD = ηA = 0.1), we obtain strongly recurrently connected networks after a lesion. (C) If dendritic elements need high levels of activity (ηD = 0.4, ηA = 0.1), no network repair takes place, i.e., no restoration of activity levels. We replaced the homeostatic set-point ϵ = 0.7 by a homeostatic range of 0.65 ≤ ϵ ≤ 0.75, in which no change in number of axonal or dendritic elements takes place. We chose ν = 10−4 ms−1.
Figure 2
Figure 2
Physiological case. Compensatory network rewiring renders neuronal networks more random and increases their betweenness centrality. (A) Average electrical activities, as measured by the mean calcium concentration of the respective area, are restored to the homeostatic range for neurons in the LPZ (red) and the intact zone (green). Neurons corresponding to the LPZ in a non-lesioned network do not alter their calcium concentration (control, black). (B) Networks become more random after deafferentation, as indicated by a decrease in small-world parameter S (red) measured over the entire network, whereas control networks show no change in small-worldness (black). (C) At the same time, betweenness centrality increases in the LPZ (red) but decreases in the intact zone (green). Betweenness centrality of neurons corresponding to the LPZ in a non-lesioned network remains stable (control, black). Means over five simulations per scenario. Shadings of the curves indicate standard deviations.
Figure 3
Figure 3
The increasing randomness of networks after deafferentation is due to a marked decrease in clustering, as shown by a decrease in the normalized clustering coefficient γ (A). The average of shortest paths, as measured by the normalized characteristic path length λ (Equation 11), shows only very little change in absolute terms (B). Means over five simulations per scenario. Shadings of the curves indicate standard deviations.
Figure 4
Figure 4
In the physiological case, compensatory network rewiring relies on the formation of new synapses from the intact zone to the LPZ. (A) Synapse numbers from the intact zone to the LPZ increase (green), while synapses numbers from the LPZ to the intact zone decrease (red). (B) All neurons in the intact zone (green) and most neurons in the LPZ (red) return to the homeostatic range following deafferentation. Neurons lose axonal and dendritic elements if their calcium concentration is lower than 0.1 or higher than 0.75 (dark gray background). Neurons form only dendritic elements if their calcium concentration is greater than 0.1 but lower than 0.4 (gray), and form both axonal and dendritic elements if their calcium concentration is greater 0.4 but lower than 0.65 (light gray). The homeostatic range, in which synaptic element numbers do not change, spans from 0.65 to 0.75. The diagram helps to match changes in topology with the current level of electrical activity. (C) The normalized average clustering coefficient γ of neurons in the LPZ (including connections with the entire network) decreases while neuronal activities are very low (<0.1) and increases as soon as activities of LPZ neurons are greater than 0.1. The first bump in clustering is brought about by ingrowing synapses from the intact zone into the LPZ, whereas the second rise in clustering is caused predominantly by new synapses within the LPZ, which are formed when calcium concentrations of LPZ neurons exceed 0.4. The γ of neurons in the intact zone (considering all their connections to any neuron in the entire network) decreases continuously after a temporary rise. (D) Average shortest paths from neurons in the intact zone to neurons in the LPZ show a steady decrease (green), while average path lengths from LPZ to intact zone neurons return to initial levels after a tri-phasic increase and decrease. (E) The clustering coefficient with no normalization (Equation 10) does not show a decrease for intact zone neurons as the normalized clustering coefficient γ does. (F) No differences were found between the characteristic path length and the normalized characteristic path length λ. Green curve indicates changes in clustering coefficient of intact zone neurons with the entire network. Means over five simulations per scenario. Shadings of the curves in (A,C–F) indicate standard deviations.
Figure 5
Figure 5
The physiological case (A) is characterized by a pronounced replacement of synapses, whereas the recurrent case (B) predominantly adds new synapses and keeps pre-existing ones. The no-repair case (C) does not form sufficient additional synapses to the LPZ. The figures show the two-dimensional layout of the network, with excitatory neurons (red dots), excitatory synaptic connections (red lines), inhibitory neurons (blue dots) and inhibitory synaptic connections (blue lines). Black dots indicate deafferentated neurons. The left column shows new synapses originating from anywhere in the intact zone. Whereas the preferred target of new synapses in the physiological case is the LPZ, only few new synapses from the intact zone to the LPZ are formed in the recurrent case. Middle column shows that most of the new synapses originating from the LPZ terminate in the LPZ in both the physiological and the recurrent case. Insets in the middle column illustrate the axonal projection pattern of an individual neuron in the LPZ. In the physiological case, neurons at the border of the LPZ connect to neurons more central in the LPZ, whereas in the recurrent case neurons have less preferrence for particular targets. The right column shows that many synapses originating from the LPZ are deleted in the physiological case but not in the recurrent case. All measurements are based on the difference between the number of synapses present before (T0 = 7950) and after the lesion (T1 = 20000 updates in connectivity, corresponding to 24 weeks after lesion), separately for excitatory and inhibitory synapses. Only excitatory neurons and excitatory to excitatory connections were used in the topological assessments.
Figure 6
Figure 6
An increasing randomness of the whole network in association with an increasing betweenness centrality of LPZ neurons after deafferentation emerges only in the physiological case. (A) Whereas the no-repair case (black) shows an increase in small-world parameter S and the recurrent case (blue) shows little change in S, the physiological case shows a clear decrease in S (red). (B) The recurrent case shows the strongest increase in betweenness centrality. (C) The average calcium concentrations of the LPZ and intact zone return quickest to the homeostatic range in the recurrent case. Means over five simulations per scenario. Shadings of the curves indicate standard deviations.
Figure 7
Figure 7
Local and global efficiencies of LPZ neurons, but not of intact zone neurons, change as a consequence of network rewiring. (A) The local efficiency of neurons in the LPZ increases strongest after deafferentation in the recurrent case. In the physiological case, local efficiency of LPZ neurons first decreases and later increases but remains lower than its initial value. If networks do not recover, local efficiency decreases and remains low. (C) Global efficiency increases in the physiological case (after a transient decrease) and in the recurrent case (without a transient decrease). The no-repair case shows a decrease in global efficiency. No changes were observed in either local (B) or global efficiency of neurons in the intact zone (D).
Figure 8
Figure 8
The growth rules in the recurrent case, whereby axonal and dendritic elements can already form at low neuronal activity, have a considerable impact on network topology after the lesion. (A) A strong increase in synapse numbers within the LPZ (black) is seen after the lesion. (B) The surplus of recurrent synapses in the LPZ gives rise to an increasing clustering coefficient of LPZ neurons (red) that even exceeds the clustering of the intact zone (green). In computing the average clustering coefficients over the excitatory neurons of the intact zone and the LPZ, we considered all excitatory connections from the entire network. (C) Average path lengths from neurons in the intact zone to neurons in the LPZ (green) and vice versa (red) show a steady decrease after deafferentation. Means over five simulations per scenario. Shadings of the curves indicate standard deviations.
Figure 9
Figure 9
Degree distributions of intact zone (green) and LPZ neurons (red) before and after the lesion in the physiological case. In the bar charts, the larger amount is always placed in the background and the minor amount in the foreground. Before the lesion, the in-degree (A) and out-degree distributions (B) are not tailed. After the lesion, the distributions of in-degree (C) and out-degree (D) become more tailed. The diagram shows data from one simulation at T = 7950 and T = 20000 updates in connectivity, the latter corresponding to 24 weeks after lesion.
Figure 10
Figure 10
Degree distributions of intact zone (green) and LPZ neurons (red) before and after the lesion in the recurrent case. In the bar charts, the larger amount is always placed in the background and the minor amount in the foreground. Before the lesion, the in-degree (A) and out-degree distributions (B) are not tailed. After the lesion, the shapes of in-degree (C) and out-degree (D) distributions do not change markedly, but the centers of the in- and out-degree distributions of the LPZ neurons are shifted to the right. The diagram shows data from one simulation at T = 7950 and T = 20000 updates in connectivity, the latter corresponding to 24 weeks after lesion.
Figure 11
Figure 11
The strong increase in betweenness centrality of LPZ neurons during network repair in the physiological case (A–C) and the recurrent case (D–F) is also obtained if the initial network topology is random. (A) In the physiological case, random networks (black) restore activity levels after the lesion in a comparable manner to small-world networks (blue), but because levels do not drop as far as in small-world networks, random networks restore activity earlier than small-world networks. (B) The increase in betweennes centrality is obtained for random as well as small-world network topologies. (C) Random networks become slightly more structured after the lesion, as indicated by a small increase in small-world parameter S. (D) In the recurrent case, random networks restore activity levels after the lesion in a comparable manner to small-world networks, but because levels do not drop as far as in small-world networks, random networks restore activity earlier than small-world networks. (E) Betweenness centrality markedly increases in random networks, but to lower values than in small-world networks. (F) A small increase in small-world parameter S is also seen in the recurrent case with initial random topology. Means over five simulations per scenario. Shadings of the curves indicate standard deviations.

Similar articles

Cited by

References

    1. Achard S., Bullmore E. (2007). Efficiency and cost of economical brain functional networks. PLoS Comput. Biol. 3:e17. 10.1371/journal.pcbi.0030017 - DOI - PMC - PubMed
    1. Alstott J., Breakspear M., Hagmann P., Cammoun L., Sporns O. (2009). Modeling the impact of lesions in the human brain. PLoS Comput. Biol. 5:e1000408. 10.1371/journal.pcbi.1000408 - DOI - PMC - PubMed
    1. Andrews R. J. (1991). Transhemispheric diaschisis. A review and comment. Stroke 22, 943–949. 10.1161/01.STR.22.7.943 - DOI - PubMed
    1. Avramescu S., Nita D. A., Timofeev I. (2009). Neocortical post-traumatic epileptogenesis is associated with loss of GABAergic neurons. J. Neurotrauma 26, 799–812. 10.1089/neu.2008.0739 - DOI - PMC - PubMed
    1. Avramescu S., Timofeev I. (2008). Synaptic strength modulation after cortical trauma: a role in epileptogenesis. J. Neurosci. 28, 6760–6772. 10.1523/JNEUROSCI.0643-08.2008 - DOI - PMC - PubMed