. 2014 Oct 11;6(5):439-58.
eCollection 2014.

Melatonin augments apoptotic adipose-derived mesenchymal stem cell treatment against sepsis-induced acute lung injury

Affiliations

Melatonin augments apoptotic adipose-derived mesenchymal stem cell treatment against sepsis-induced acute lung injury

Hong-Hwa Chen et al. Am J Transl Res. .

Abstract

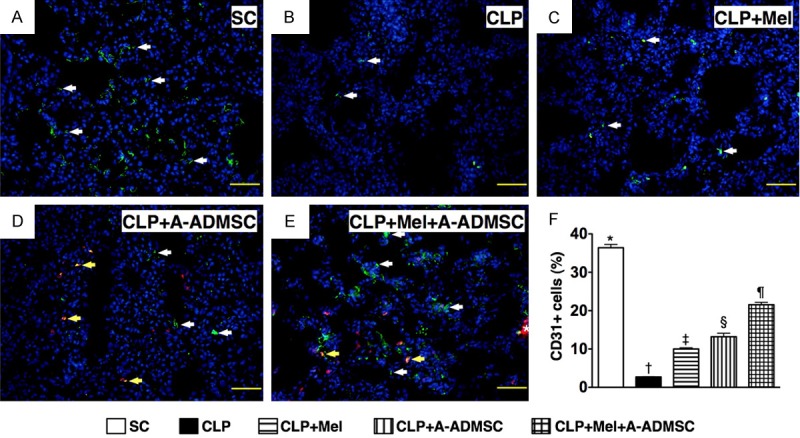
This study investigated whether combining melatonin and apoptotic adipose-derived mesenchymal stem cells (A-ADMSC) was superior to ADMSC alone in ameliorating sepsis-induced acute lung injury. Adult male Sprague-Dawley rats (n=50) were randomized equally into five groups: sham controls (SC), sepsis induced by cecal-ligation and puncture (CLP), CLP-melatonin, CLP-A-ADMSC, and CLP-melatonin-A-ADMSC. Circulating interleukin (IL)-6 at 6, 18, and 72 hrs, were highest in CLP and lowest in SC groups, higher in CLP-melatonin than CLP-A-ADMSC and CLP-melatonin-A-ADMSC groups, higher in CLP-A-ADMSC than CLP-melatonin-A-ADMSC groups (all p<0.001). Immune reactivity (indicated by circulating cytotoxic-, and regulatory-T cells) and WBC count at 72 h exhibited the same pattern as that of circulating IL-6 (all p<0.001). Changes in histological scoring of lung parenchyma and the number of CD68+ and CD14+ cells showed a similar pattern compared to that of IL-6 level in all groups (all p<0.001). Changes in protein expressions of inflammatory (oxidative stress, RANTES, TNF-α, NF-κB, MMP-9, MIP-1, IL-1β), apoptotic (cleaved caspase 3 and PARP, mitochondrial Bax), fibrotic (Smad3, TGF-β) markers and those of reactive-oxygen-species (NOX-1, NOX-2) displayed an identical pattern compared to that of circulating IL-6 in all groups (all p<0.001). Anti-oxidative capacities (GR+, GPx+, HO-1, NQO-1+) and angiogenesis marker (CXCR4+ cells) were lowest in SC group but highest in CLP-melatonin-A-ADMSC group, lower in CLP than CLP-melatonin and CLP-A-ADMSC groups, and lower in CLP-melatonin than CLP-A-ADMSC groups (all p<0.001). In conclusion, combined melatonin and A-ADMSC were superior to A-ADMSC alone in protecting the lung from sepsis-induced injury.

Keywords: Sepsis-induced organ injury; adipose-derived mesenchymal stem cells; and melatonin; inflammation; oxidative stress; reactive oxygen species.


Figures

Figure 1
Figure 1
Microscopic findings for the incidence of A-ADMSC after starvation-hypoxia stress and flow cytomtric Analysis of circulating Immune Cells (n=6). (A and B) Immunofluorescent (IF) microscopic findings (400 x) of cellular apoptosis of apoptotic adipose-derived mesenchymal stem cells (A-ADMSCs). (C) Cellular apoptosis was significantly higher in A-ADMSC than in healthy ADMSC. * vs. normal control, p<0.0001. Blue color indicates DAPI stain for nuclei. (D) Flow cytometric analysis of CD3+/CD4+ cells. * vs. other groups with different symbols (*, †, ‡), p<0.001. (E) Flow cytometric analysis of CD3+/CD8+ cells. * vs. other groups with different symbols (*, †, ‡), p<0.001. (F) Flow cytometric analysis of Treg+ cells. * vs. other groups with different symbols (*, †, ‡), p<0.001. Statistical analysis in (F) using one-way ANOVA, followed by Bonferroni multiple comparison post hoc test. Symbols (*, †, ‡) indicate significance (at 0.05 level). SC=sham control; CLP=cecal-ligation and puncture; Mel=melatonin.
Figure 2
Figure 2
Histopathological findings in lung parenchyma at 72 hours after CLP procedure (n=6). (A to F) Illustrations of microscopic findings (100 x) of H & E stain in lung sections. (G) Analytic results of number of alveolar sacs, * vs. other groups with different symbols (*, †, ‡, §, ¶), p<0.001. (H) Analytic results of crowded score, * vs. other groups with different symbols (*, †, ‡, §, ¶), p<0.0001. The scale bars in right lower corner represent 100 μm. Statistical analysis in (G) and (H) using one-way ANOVA, followed by Bonferroni multiple comparison post hoc test. Symbols (*, †, ‡, §, ¶) indicate significance (at 0.05 level). HPF=high-power field; SC=sham control; CLP=cecal-ligation and puncture; Mel=melatonin; A-ADMSC=apoptotic adipose-derived mesenchymal stem cell.
Figure 3
Figure 3
Inflammatory cells infiltrated in lung parenchyma at 72 hours after CLP procedure (n=6). (A to E) Microscopic findings (200 x) of immunohistochemical (IHC) stain for CD14+ cells (brown color). (F) Analytic results of CD14+ cells, * vs. other groups with different symbols (*, †, ‡, §, ¶), p<0.0001. The scale bars in right lower corner represent 50 μm. (G to K) Microscopic findings (200 x) of immunofluorescent (IF) stain for CD68+ cells (green color of DAPI+ cells). Abundant Dil dye stained A-ADMSCs (white arrows) were found in (J) and (K) indicated that the transplanted A-ADMSCs were trapped in lung parenchyma. (L) Analytic results of CD68+ cells, * vs. other groups with different symbols (*, †, ‡, §, ¶), p<0.0001. The scale bars in right lower corner represent 50 μm. Statistical analysis in (F) and (L) using one-way ANOVA, followed by Bonferroni multiple comparison post hoc test. Symbols (*, †, ‡, §, ¶) indicate significance (at 0.05 level). HPF=high-power field; SC=sham control; CLP=cecal-ligation and puncture; Mel=melatonin; A-ADMSC=apoptotic adipose-derived mesenchymal stem cell.
Figure 4
Figure 4
Expressions of GR and GPx anti-oxidant cells in lung parenchyma 72 hours after CLP procedure (n=6). (A to E) Microscopic findings (200 x) of IHC stain for glutathione reductase (GR)+ cells (brown color) in lung parenchyma. (F) Analytic results of GR+ cells, * vs. other groups with different symbols (*, †, ‡, §, ¶), p<0.0001. The scale bars in right lower corner represent 50 μm. (G to K) Microscopic findings (200 x) of IHC stain for glutathione peroxidase (GPx)+ cells (brown color) in lung parenchyma. (L) Analytic results of GPx+ cells, * vs. other groups with different symbols (*, †, ‡, §, ¶), p<0.0001. The scale bars in right lower corner represent 50 μm. Statistical analysis in (F) and (L) using one-way ANOVA, followed by Bonferroni multiple comparison post hoc test. Symbols (*, †, ‡, §, ¶) indicate significance (at 0.05 level). SC=sham control; CLP=cecal-ligation and puncture; Mel=melatonin; A-ADMSC=apoptotic adipose-derived mesenchymal stem cell.
Figure 5
Figure 5
Expressions of NQO 1 and HO-1 anti-oxidant cells in lung parenchyma 72 hours after CLP procedure (n=6). (A to E) Microscopic findings (200 x) of IHC stain for NAD(P)H quinone oxidoreductase (NQO) 1+ cells (brown color) in lung parenchyma. (F) Analytic results of NQO 1+ cells, * vs. other groups with different symbols (*, †, ‡, §, ¶), p<0.0001. The scale bars in right lower corner represent 50 μm. (G to K) Microscopic findings (200 x) of IF stain for heme oxygenase (HO)-1+ cells (green color of DAPI+ cells) in lung parenchyma. Abundant Dil dye stained A-ADMSCs (white arrows) were found in (J) and (K) indicated that the transplanted A-ADMSCs were trapped in lung parenchyma. Additionally, some transplanted A-ADMSCs showing positive stain for OH-1 (yellow arrows). L) Analytic results of HO-1+ cells, * vs. other groups with different symbols (*, †, ‡, §, ¶), p<0.0001. The scale bars in right lower corner represent 50 μm. Statistical analysis in (F) and (L) using one-way ANOVA, followed by Bonferroni multiple comparison post hoc test. Symbols (*, †, ‡, §, ¶) indicate significance (at 0.05 level). SC=sham control; CLP=cecal-ligation and puncture; Mel=melatonin; A-ADMSC=apoptotic adipose-derived mesenchymal stem cell.
Figure 6
Figure 6
Protein expressions of oxidative stress and ROS in lung parenchyma 72 hours after CLP procedure (n=6). A. Protein expression of NOX-1 in lung parenchyma, * vs. other groups with different symbols (*, †, ‡, §), p<0.001. B. Protein expression of NOX-2 in lung parenchyma, * vs. other groups with different symbols (*, †, ‡, §, ¶), p<0.001. C. Protein expression of oxidative index (protein carbonyls) in lung parenchyma, * vs. other groups with different symbols (*, †, ‡, §, ¶), p<0.0001. (Note: Right lane and left lane shown on the upper panel represent control oxidized molecular protein standard and protein molecular weight marker, respectively). DNP=1-3 dinitrophenylhydrazone. All statistical analyses were with one-way ANOVA followed by Bonferroni multiple comparison post hoc test. Symbols (*, †, ‡, §, ¶) indicate significance (at 0.05 level). SC=sham control; CLP=cecal-ligation and puncture; Mel=melatonin; A-ADMSC=apoptotic adipose-derived mesenchymal stem cell.
Figure 7
Figure 7
Protein expressions of inflammatory biomarkers in lung parenchyma 72 hours after CLP procedure. A. Protein expressions of interleukin (IL)-1 in lung parenchyma, * vs. other groups with different symbols (*, †, ‡, §, ¶), p<0.001. B. Protein expressions of tumor necrosis factor (TNF)-α in lung parenchyma, * vs. other groups with different symbols (*, †, ‡, §, ¶), p<0.001. C. Protein expressions of tumor nuclear factor (NF)-κB in lung parenchyma, * vs. other groups with different symbols (*, †, ‡, §, ¶), p<0.001. D. Protein expressions of matrix metalloproteinase (MMP)-9 in lung parenchyma, * vs. other groups with different symbols (*, †, ‡, §, ¶), p<0.005. E. Protein expressions of macrophage inflammatory protein (MIP)-1α in lung parenchyma, * vs. other groups with different symbols (*, †, ‡, §, ¶), p<0.005. All statistical analyses were with one-way ANOVA followed by Bonferroni multiple comparison post hoc test. Symbols (*, †, ‡, §, ¶) indicate significance (at 0.05 level). SC=sham control; CLP=cecal-ligation and puncture; Mel=melatonin; A-ADMSC=apoptotic adipose-derived mesenchymal stem cell.
Figure 8
Figure 8
Protein expressions of DNA damage, apoptotic and anti-inflammatory biomarkers. A. Protein expression of γ-H2AX in lung parenchyma, * vs. other groups with different symbols (*, †, ‡, §, ¶), p<0.0001. B. Protein expression of mitochondrial Bax in lung parenchyma, * vs. other groups with different symbols (*, †, ‡, §, ¶), p<0.001. C. Protein expression of cleaved caspase (c-Csp) 3 I lung parenchyma, * vs. other groups with different symbols (*, †, ‡, §, ¶), p<0.0001. D. Protein expression of cleaved poly (ADP-ribose) polymerase (PARP) in lung parenchyma, * vs. other groups with different symbols (*, †, ‡, §, ¶), p<0.001. E. Protein expression of Bcl-2 in lung parenchyma, * vs. other groups with different symbols (*, †, ‡, §, ¶), p<0.008. All statistical analyses were with one-way ANOVA followed by Bonferroni multiple comparison post hoc test. Symbols (*, †, ‡, §, ¶) indicate significance (at 0.05 level). SC=sham control; CLP=cecal-ligation and puncture; Mel=melatonin; A-ADMSC=apoptotic adipose-derived mesenchymal stem cell.
Figure 9
Figure 9
Protein expressions of Fibrotic, anti-Fibrotic and anti-oxidant biomarkers. A. Protein expression of phosphorylated (p)-Smad3 in lung parenchyma, * vs. other groups with different symbols (*, †, ‡, §, ¶), p<0.0001. B. Protein expression of transforming growth factor (TGF)-β, * vs. other groups with different symbols (*, †, ‡, §, ¶), p<0.0001. C. Protein expression of p-Smad1/5 in lung parenchyma, * vs. other groups with different symbols (*, †, ‡, §, ¶), p<0.001. D. Protein expression of Bone morphogenic protein (BMP)-2 in lung parenchyma, * vs. other groups with different symbols (*, †, ‡, §, ¶), p<0.001. E. Protein expression of HO-1 in lung parenchyma, * vs. other groups with different symbols (*, †, ‡, §, ¶), p<0.0001. F. rotein expression of NQ0 1 in lung parenchyma, * vs. other groups with different symbols (*, †, ‡, §, ¶), p<0.0001. All statistical analyses were with one-way ANOVA followed by Bonferroni multiple comparison post hoc test. Symbols (*, †, ‡, §, ¶) indicate significance (at 0.05 level). SC=sham control; CLP=cecal-ligation and puncture; Mel=melatonin; A-ADMSC=apoptotic adipose-derived mesenchymal stem cell.
Figure 10
Figure 10
IF stain for identifying surface makers of endothelial cell (EC). (A to E) IF microscopic findings (200 x) for identification of positively-stained CD31 cells (white arrows). (D and E) Abundant transplanted A-ADMSCs with positively Dil-dye stain (red color) were found to be present in the lung parenchyma. Merge of double stain (i.e. Dil dye + CD31 staining) showing some of A-ADMSCs (D, E) exhibited EC surface marker of CD31 (yellow arrows). Some of transfused A-ADMSCs were identified to engraft into lung parenchyma (E) (asterisk marker). (F) Analytic results of CD31+ cells, * vs. other groups with different symbols (*, †, ‡, §), p<0.0001. The scale bars in right lower corner represent 50 μm. Symbols (*, †, ‡, §, ¶) indicate significance (at 0.05 level). SC=sham control; CLP=cecal-ligation and puncture; Mel=melatonin; A-ADMSC=apoptotic adipose-derived mesenchymal stem cell.
Figure 11
Figure 11
IF stain for identifying surface makers of endothelial progenitor cells. (A to E & G to H) IF microscopic findings (400 x) for identification of positively-stained CXCR4 cells (white arrows). (D & E and G & H) Numerous transplanted A-ADMSCs with positively Dil-dye stain (red color) were found to be present in the lung parenchyma. (D & E) Merge of double stain (i.e. Dil dye + CXCR4 staining) showing some of A-ADMSCs exhibited EPC surface marker of CXCR4 (yellow arrows). Some of transfused A-ADMSCs were identified to engraft into the pulmonary arteries (G, H) (pink arrow) and lung parenchyma (E, G) (asterisk marker). (F) Analytic results of CXCR4+ cells, * vs. other groups with different symbols (*, †, ‡, §, ¶), p<0.0001. The scale bars in right lower corner represent 20 μm. All statistical analyses were with one-way ANOVA followed by Bonferroni multiple comparison post hoc test. Symbols (*, †, ‡, §, ¶) indicate significance (at 0.05 level). SC=sham control; CLP=cecal-ligation and puncture; Mel=melatonin; A-ADMSC=apoptotic adipose-derived mesenchymal stem cell.
Figure 12
Figure 12
Proposed mechanisms underlying the effects of melatonin-A-ADMSC therapy on CLP-induced lung parenchymal injury in a rodent model based on findings of the present study. ADMSC=adipose-derived mesenchymal stem cell; BMP=bone morphogenetic protein; GPx=glutathione peroxidase; GR=glutathione reductase; HO=heme oxygense; IL-1β=interleukin (IL)-1β; MMP-9=matrix metalloproteinase-9; MIP=macrophage inflammatory protein; NQO 1=NAD(P)H quinone oxidoreductase; NOX=nicotinamide adenine dinucleotide phosphate (NADPH) oxidase; PARP=poly (ADP-ribose) polymerase; TNF=tumor necrotic factor; TGF=transforming growth factor.

Similar articles

Cited by

References

    1. Cronshaw HL, Daniels R, Bleetman A, Joynes E, Sheils M. Impact of the Surviving Sepsis Campaign on the recognition and management of severe sepsis in the emergency department: are we failing? Emerg Med J. 2011;28:670–675. - PubMed
    1. Dellinger RP, Levy MM, Carlet JM, Bion J, Parker MM, Jaeschke R, Reinhart K, Angus DC, Brun-Buisson C, Beale R, Calandra T, Dhainaut JF, Gerlach H, Harvey M, Marini JJ, Marshall J, Ranieri M, Ramsay G, Sevransky J, Thompson BT, Townsend S, Vender JS, Zimmerman JL, Vincent JL International Surviving Sepsis Campaign Guidelines Committee; American Association of Critical-Care Nurses; American College of Chest Physicians; American College of Emergency Physicians; Canadian Critical Care Society; European Society of Clinical Microbiology and Infectious Diseases; European Society of Intensive Care Medicine; European Respiratory Society; International Sepsis Forum; Japanese Association for Acute Medicine; Japanese Society of Intensive Care Medicine; Society of Critical Care Medicine; Society of Hospital Medicine; Surgical Infection Society; World Federation of Societies of Intensive and Critical Care Medicine. Surviving Sepsis Campaign: international guidelines for management of severe sepsis and septic shock: 2008. Crit Care Med. 2008;36:296–327. - PubMed
    1. Grozdanovski K, Milenkovic Z, Demiri I, Spasovska K. Prediction of outcome from community-acquired severe sepsis and septic shock in tertiary-care university hospital in a developing country. Crit Care Res Pract. 2012;2012:182324. - PMC - PubMed
    1. Tipler PS, Pamplin J, Mysliwiec V, Anderson D, Mount CA. Use of a protocolized approach to the management of sepsis can improve time to first dose of antibiotics. J Crit Care. 2013;28:148–151. - PubMed
    1. Angus DC, Linde-Zwirble WT, Lidicker J, Clermont G, Carcillo J, Pinsky MR. Epidemiology of severe sepsis in the United States: analysis of incidence, outcome, and associated costs of care. Crit Care Med. 2001;29:1303–1310. - PubMed

LinkOut - more resources