. 2014 Sep 3;5(10):3376-90.
doi: 10.1364/BOE.5.003376. eCollection 2014 Oct 1.

Sub-diffusive scattering parameter maps recovered using wide-field high-frequency structured light imaging

Affiliations

Sub-diffusive scattering parameter maps recovered using wide-field high-frequency structured light imaging

Stephen Chad Kanick et al. Biomed Opt Express. .

Abstract

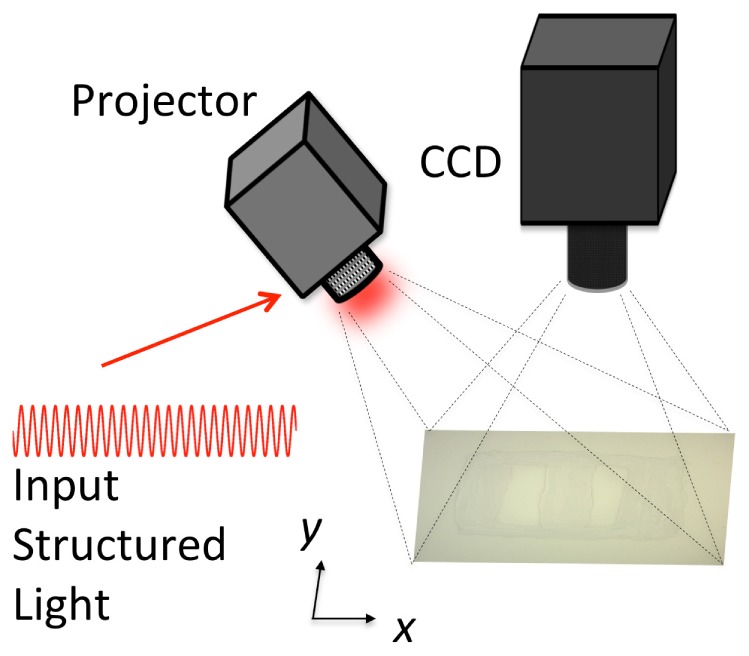
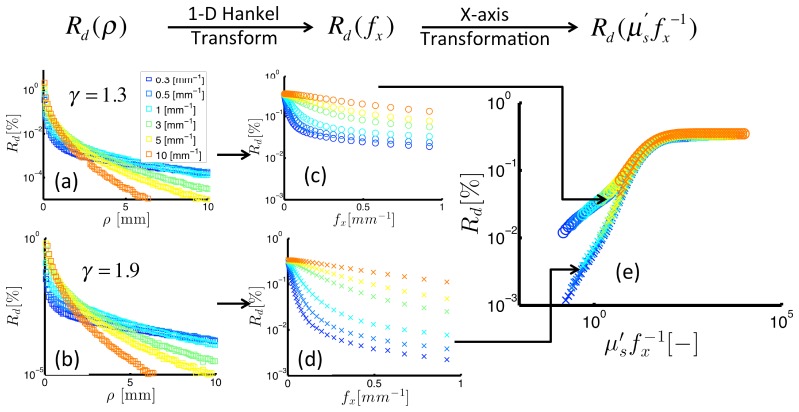
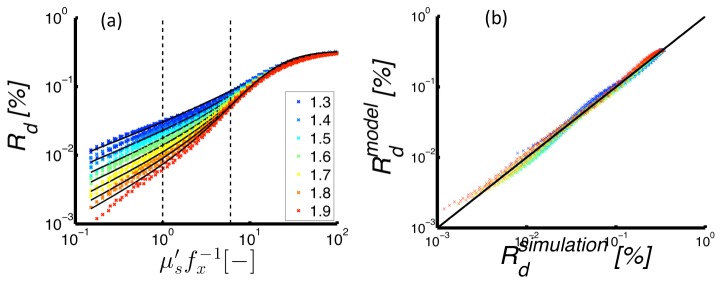
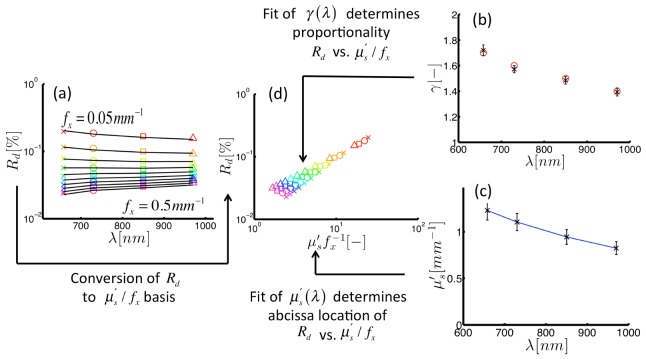
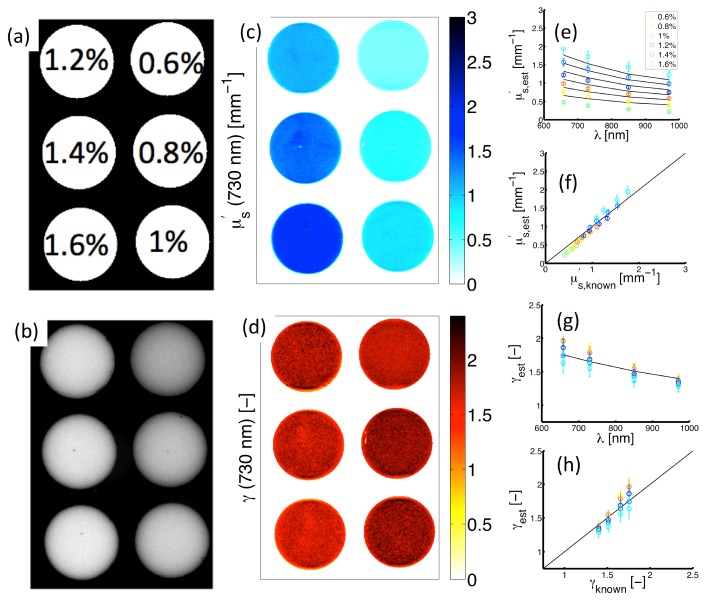
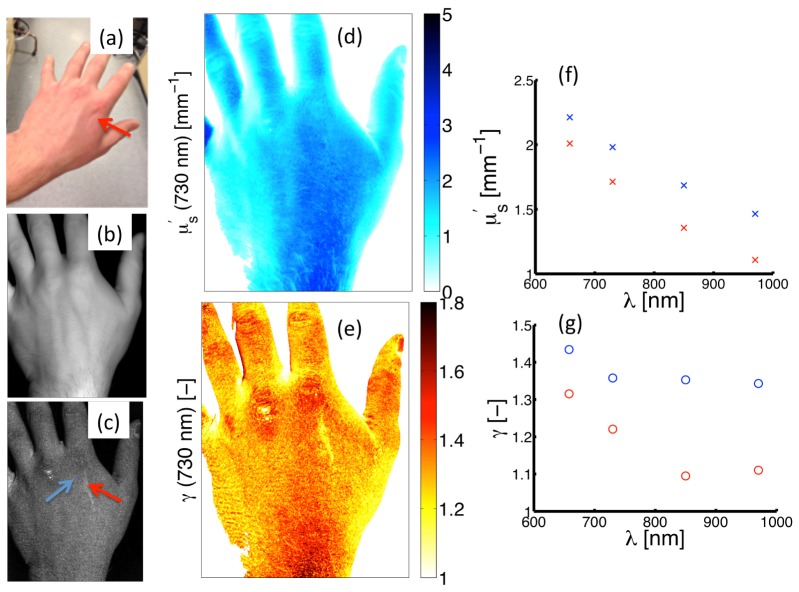
This study investigates the hypothesis that structured light reflectance imaging with high spatial frequency patterns [Formula: see text] can be used to quantitatively map the anisotropic scattering phase function distribution [Formula: see text] in turbid media. Monte Carlo simulations were used in part to establish a semi-empirical model of demodulated reflectance ([Formula: see text]) in terms of dimensionless scattering [Formula: see text] and [Formula: see text], a metric of the first two moments of the [Formula: see text] distribution. Experiments completed in tissue-simulating phantoms showed that simultaneous analysis of [Formula: see text] spectra sampled at multiple [Formula: see text] in the frequency range [0.05-0.5] [Formula: see text] allowed accurate estimation of both [Formula: see text] in the relevant tissue range [0.4-1.8] [Formula: see text], and [Formula: see text] in the range [1.4-1.75]. Pilot measurements of a healthy volunteer exhibited [Formula: see text]-based contrast between scar tissue and surrounding normal skin, which was not as apparent in wide field diffuse imaging. These results represent the first wide-field maps to quantify sub-diffuse scattering parameters, which are sensitive to sub-microscopic tissue structures and composition, and therefore, offer potential for fast diagnostic imaging of ultrastructure on a size scale that is relevant to surgical applications.

Keywords: (170.3660) Light propagation in tissues; (170.3880) Medical and biological imaging; (170.6510) Spectroscopy, tissue diagnostics; (170.7050) Turbid media; (290.0290) Scattering.


Figures

Fig. 1
Fig. 1
Schematic of measurement setup for structured light imaging.
Fig. 2
Fig. 2
Reflectance intensity expressed on various scales: spatial (left), spatial frequency (middle), dimensionless scattering (right). The top and bottom panels show reflectance for different scattering phase functions (as noted by the γ-values). The right panel presents the γ-specific relationship between reflectance and dimensionless scattering.
Fig. 3
Fig. 3
(Left) Reflectance intensity vs. dimensionless scattering as simulated by Monte Carlo models (markers) and predicted by the semi-empirical model (lines). Here, different colors indicate different γ-values of the scattering phase function. (Right) Simulated vs. model-estimated reflectance with the line of unity slope included for visualization of the linearity of the relationship.
Fig. 4
Fig. 4
Inversion of demodulated reflectance model using simulated data. (a) Demodulated reflectance spectra sampled at multiple spatial frequencies (color markers) from a medium with background scattering properties, γ(λ)and μs(λ), specified with the color markers in (b) and (c), respectively. (d) Reflectance from spectra in panel (a) plotted vs. dimensionless scattering clearly showing a γ-specific slope. Here, different symbols indicate wavelength, and colors define spatial frequency. The inversion algorithm returns a fitted estimate of reflectance (shown as black lines in (a)) and estimates optical properties (shown by black markers in (b) and (c)).
Fig. 5
Fig. 5
Experimental measurements of structured light in Intralipid phantoms. (a) Sampled lipid volume fractions. (b) Diffuse intensity map (fx=0.0mm1). (c) and (d) show spatially-resolved estimates of μsand γat 730 nm. (e) Spectrally resolved μs(λ)in each phantom. (f) Corresponding estimates vs. known μsvalues. (g) γ(λ)spectra in each phantom. (h) Corresponding estimates vs. known γvalues.
Fig. 6
Fig. 6
Measurement of the scar on the hand of a healthy volunteer. (a) Color photograph. (b) and (c) shows a reflectance remission intensity maps for low (fx=0.0mm1) and high (fx=0.5mm1) spatial frequencies, respectively. (d) and (e) show spatial maps of μsand γat 730 nm. (f) and (g) showμs(λ)and γ(λ)spectra evaluated at point locations within the scar (red markers) and normal skin (blue markers), with the measurement locations shown by the red and blue arrows in (c).

References

    1. Boustany N. N., Kuo S. C., Thakor N. V., “Optical scatter imaging: subcellular morphometry in situ with Fourier filtering,” Opt. Lett. 26(14), 1063–1065 (2001).10.1364/OL.26.001063 - DOI - PubMed
    1. Wax A., Yang C., Backman V., Badizadegan K., Boone C. W., Dasari R. R., Feld M. S., “Cellular organization and substructure measured using angle-resolved low-coherence interferometry,” Biophys. J. 82(4), 2256–2264 (2002).10.1016/S0006-3495(02)75571-9 - DOI - PMC - PubMed
    1. Schuele G., Vitkin E., Huie P., O’Connell-Rodwell C., Palanker D., Perelman L. T., “Optical spectroscopy noninvasively monitors response of organelles to cellular stress,” J. Biomed. Opt. 10(5), 051404 (2005).10.1117/1.2075207 - DOI - PubMed
    1. Liu Y., Li X., Kim Y. L., Backman V., “Elastic backscattering spectroscopic microscopy,” Opt. Lett. 30(18), 2445–2447 (2005).10.1364/OL.30.002445 - DOI - PubMed
    1. Kim Y. L., Liu Y., Wali R. K., Roy H. K., Backman V., “Low-coherent backscattering spectroscopy for tissue characterization,” Appl. Opt. 44(3), 366–377 (2005).10.1364/AO.44.000366 - DOI - PubMed