

Biochemical characterization of human gingival crevicular fluid during orthodontic tooth movement using Raman spectroscopy
- PMID: 25360368
- PMCID: PMC4206320
- DOI: 10.1364/BOE.5.003508
Biochemical characterization of human gingival crevicular fluid during orthodontic tooth movement using Raman spectroscopy
Abstract
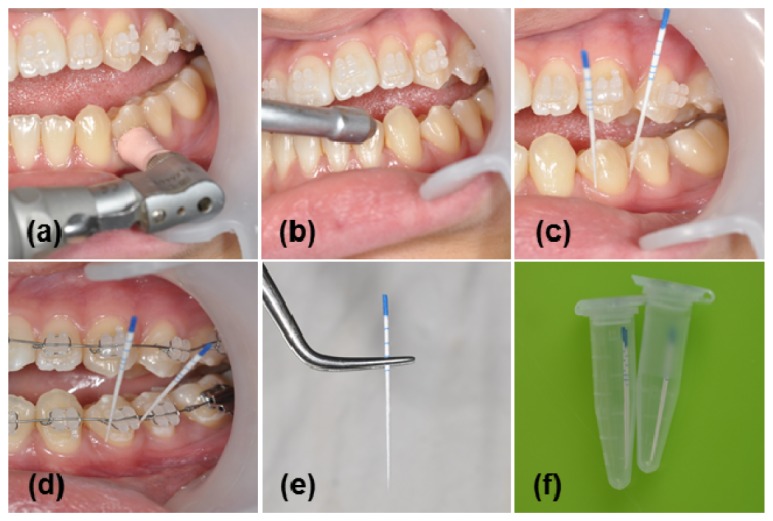
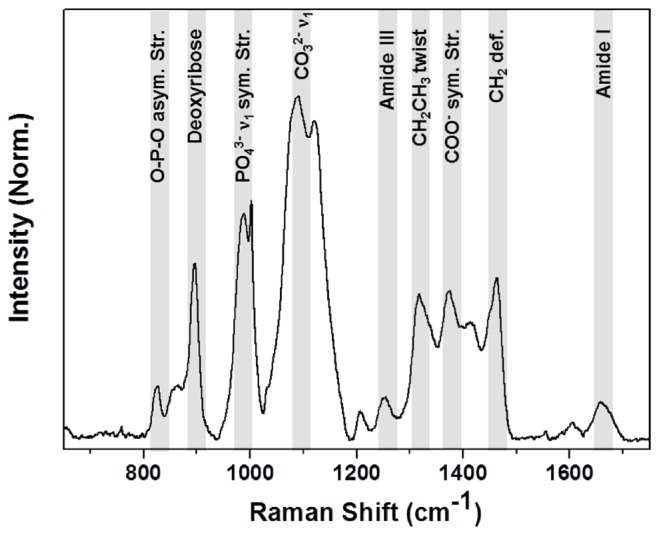
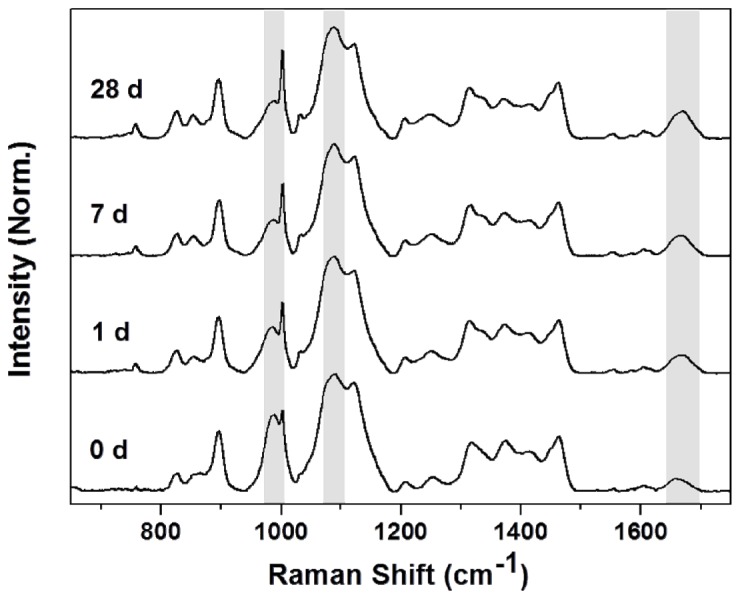
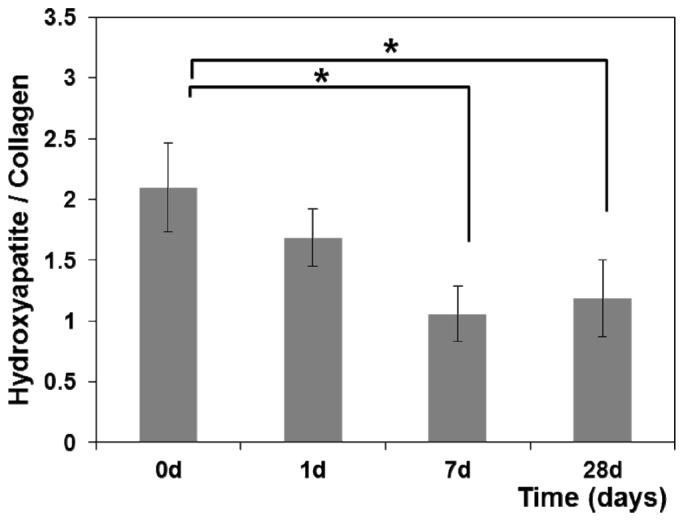
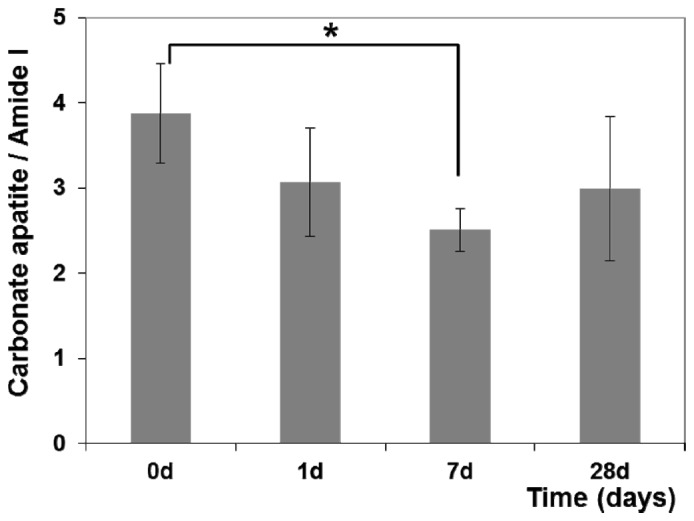
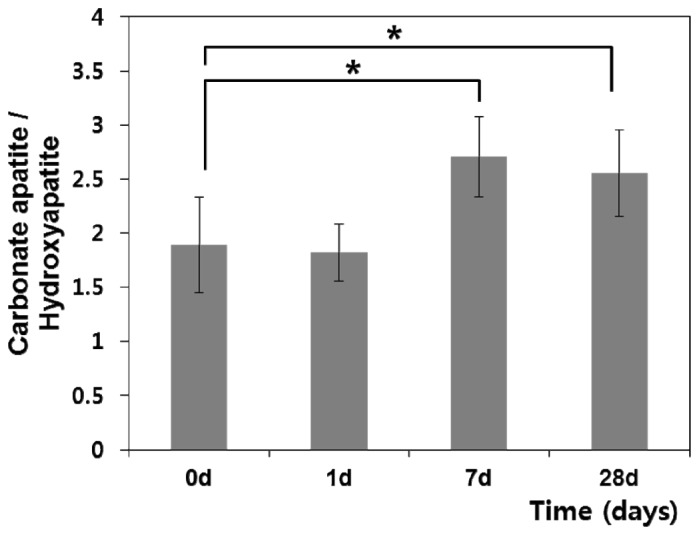
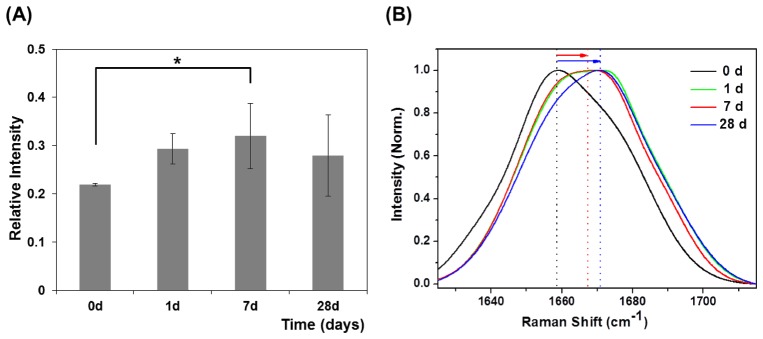
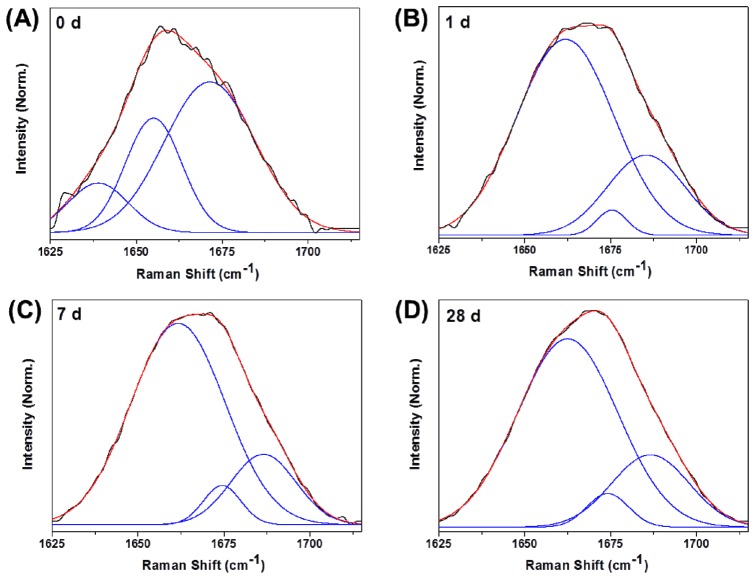
This study used Raman spectroscopy to report the first human gingival crevicular fluid (GCF) biochemical characterization during the early phase of orthodontic tooth movement. This technique allows for label-free and noninvasive biochemical change monitoring in GCF during orthodontic tooth movement. Ten orthodontic patients (20.8 ± 2.5 years) participated in the study. GCF samples were obtained before (baseline, 0 days) and during orthodontic treatment at 1, 7 and 28 days. For Raman spectroscopic measurement, GCF samples (5 µl) were deposited onto a gold-coated substrate, then dried at room temperature. Raman spectra GCF analysis during orthodontic treatment indicated that the hydroxyapatite to primarily collagen-dominated matrix band (phosphate 984 cm(-1)/amide I 1667 cm(-1)) intensity ratio decreased at day 7 (P < 0.05). The carbonate apatite to hydroxyapatite ratio (carbonate 1088 cm(-1)/phosphate 984 cm(-1)) was significantly higher on day 7 compared to day 0 (P < 0.05). These results indicate that demineralization occurs during the alveolar bone remodeling process. We also found notable peak shifts in the amide I range during orthodontic tooth movement. The 1658 cm(-1) in baseline red shifted to 1667 cm(-1) at orthodontic treatment day 7. Curve fitting in the amide I (1615-1725 cm(-1)) range demonstrated that increased random coil conformation was accompanied by a decrease in β-sheet structure during orthodontic tooth movement. Thus, we suggest Raman spectroscopy could be used for label-free, non-invasive GCF quality assessment during orthodontic tooth movement. Furthermore, this method may prove to be a powerful diagnostic and prognostic tool for monitoring orthodontic tooth movement in a clinical setting.
Keywords: (170.0170) Medical optics and biotechnology; (170.1610) Clinical applications; (170.1850) Dentistry; (170.5660) Raman spectroscopy.
Figures
Similar articles
-
Application of Vibrational Spectroscopies in the Qualitative Analysis of Gingival Crevicular Fluid and Periodontal Ligament during Orthodontic Tooth Movement.J Clin Med. 2021 Apr 1;10(7):1405. doi: 10.3390/jcm10071405. J Clin Med. 2021. PMID: 33915746 Free PMC article. Review.
-
Alkaline phosphatase activity in gingival crevicular fluid during human orthodontic tooth movement.Am J Orthod Dentofacial Orthop. 2002 Nov;122(5):548-56. doi: 10.1067/mod.2002.126154. Am J Orthod Dentofacial Orthop. 2002. PMID: 12439484
-
Monitoring early phases of orthodontic treatment by means of Raman spectroscopies.J Biomed Opt. 2017 Nov;22(11):1-10. doi: 10.1117/1.JBO.22.11.115001. J Biomed Opt. 2017. PMID: 29110445
-
μ-FTIR, μ-Raman, and SERS Analysis of Amide I Spectral Region in Oral Biofluid Samples during Orthodontic Treatment.Sensors (Basel). 2022 Oct 17;22(20):7874. doi: 10.3390/s22207874. Sensors (Basel). 2022. PMID: 36298224 Free PMC article.
-
Biomarkers in orthodontic tooth movement.J Pharm Bioallied Sci. 2015 Aug;7(Suppl 2):S325-30. doi: 10.4103/0975-7406.163437. J Pharm Bioallied Sci. 2015. PMID: 26538871 Free PMC article. Review.
Cited by
-
Stabilization Splint Therapy for Patients with Temporomandibular Disorders Improves Opening Movements and Jaw Limitation and Attenuates Pain by Influencing the Levels of IL-7, IL-8, and IL-13 in the Gingival Crevicular Fluid.Medicina (Kaunas). 2025 Feb 21;61(3):375. doi: 10.3390/medicina61030375. Medicina (Kaunas). 2025. PMID: 40142185 Free PMC article.
-
Raman Spectroscopy: A Potential Diagnostic Tool for Oral Diseases.Front Cell Infect Microbiol. 2022 Feb 4;12:775236. doi: 10.3389/fcimb.2022.775236. eCollection 2022. Front Cell Infect Microbiol. 2022. PMID: 35186787 Free PMC article. Review.
-
Application of Vibrational Spectroscopies in the Qualitative Analysis of Gingival Crevicular Fluid and Periodontal Ligament during Orthodontic Tooth Movement.J Clin Med. 2021 Apr 1;10(7):1405. doi: 10.3390/jcm10071405. J Clin Med. 2021. PMID: 33915746 Free PMC article. Review.
-
Monitoring Biochemical and Structural Changes in Human Periodontal Ligaments during Orthodontic Treatment by Means of Micro-Raman Spectroscopy.Sensors (Basel). 2020 Jan 15;20(2):497. doi: 10.3390/s20020497. Sensors (Basel). 2020. PMID: 31952367 Free PMC article.
References
-
- Davidovitch Z., Nicolay O. F., Ngan P. W., Shanfeld J. L., “Neurotransmitters, cytokines, and the control of alveolar bone remodeling in orthodontics,” Dent. Clin. North Am. 32(3), 411–435 (1988). - PubMed
-
- Uematsu S., Mogi M., Deguchi T., “Interleukin (IL)-1 beta, IL-6, tumor necrosis factor-alpha, epidermal growth factor, and beta 2-microglobulin levels are elevated in gingival crevicular fluid during human orthodontic tooth movement,” J. Dent. Res. 75(1), 562–567 (1996).10.1177/00220345960750010801 - DOI - PubMed
LinkOut - more resources
Full Text Sources
Other Literature Sources