. 2014 Sep 10;5(10):3521-40.
doi: 10.1364/BOE.5.003521. eCollection 2014 Oct 1.

Probing the immune and healing response of murine intestinal mucosa by time-lapse 2-photon microscopy of laser-induced lesions with real-time dosimetry

Affiliations

Probing the immune and healing response of murine intestinal mucosa by time-lapse 2-photon microscopy of laser-induced lesions with real-time dosimetry

Regina Orzekowsky-Schroeder et al. Biomed Opt Express. .

Abstract

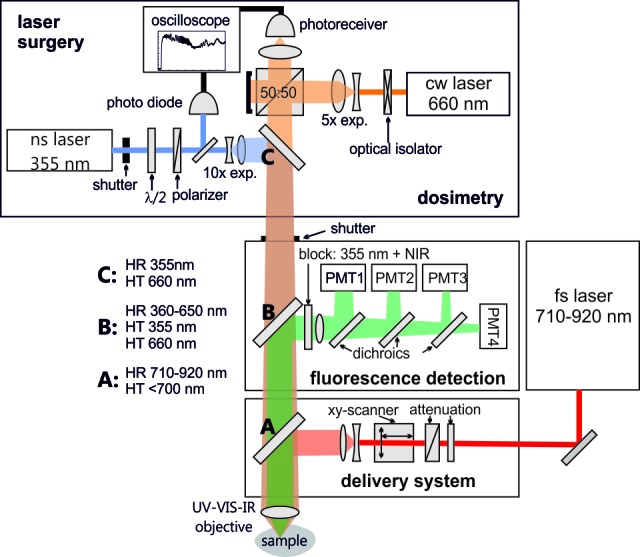
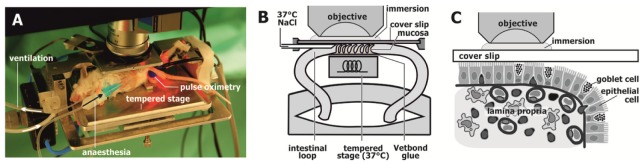
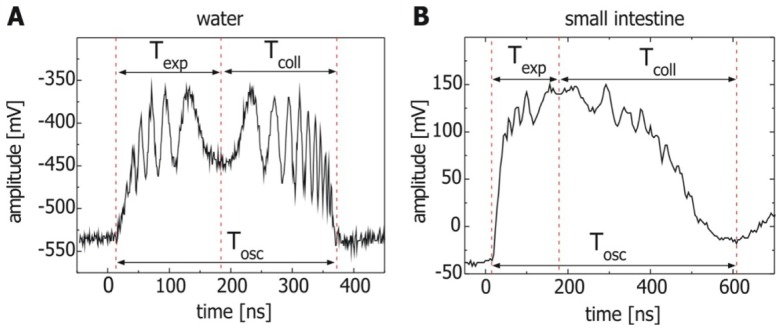
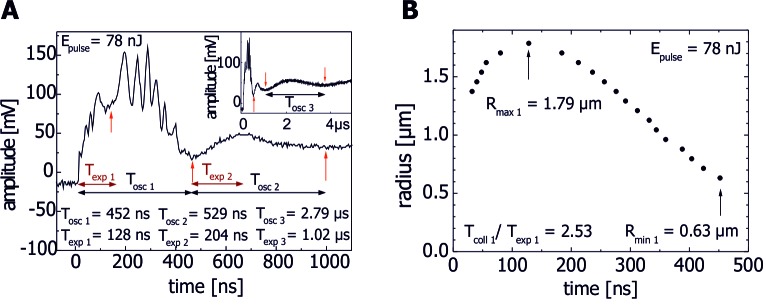
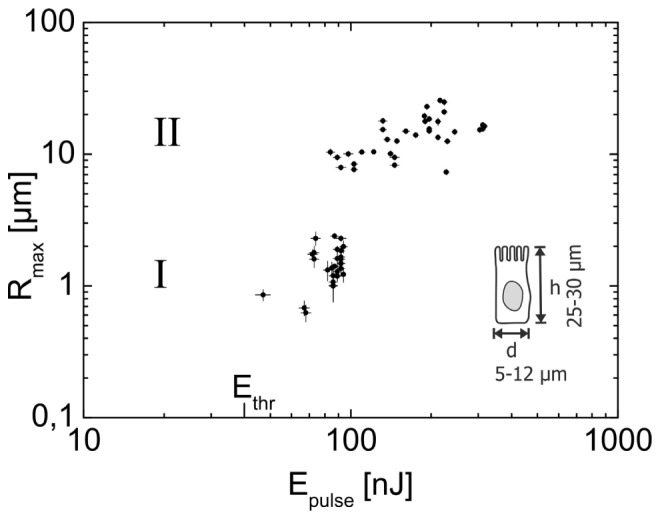
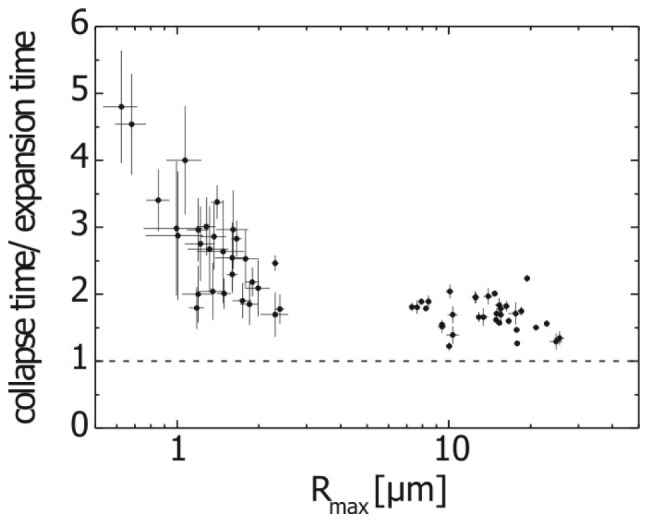
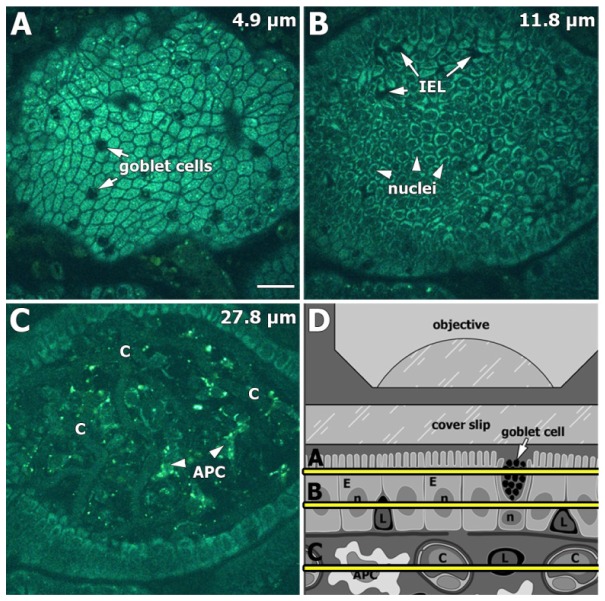
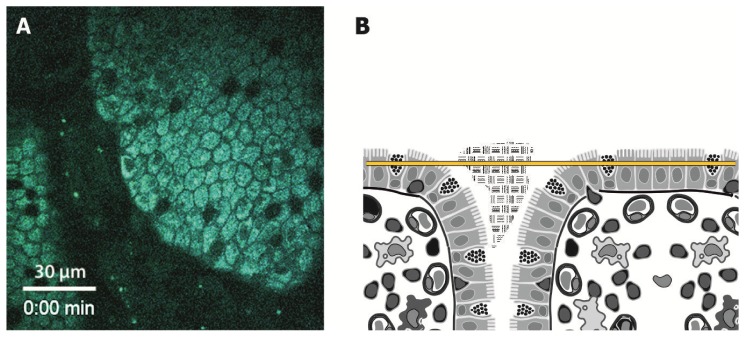
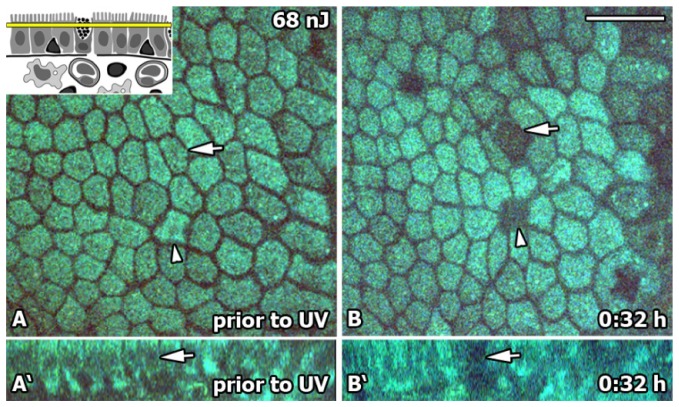
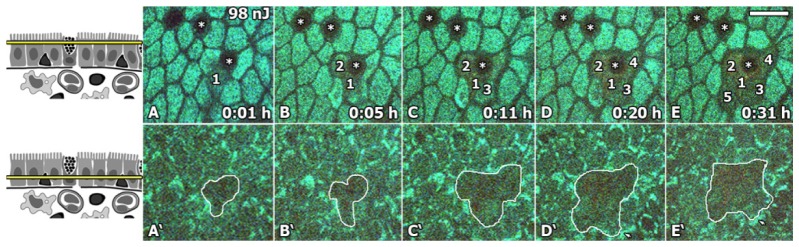
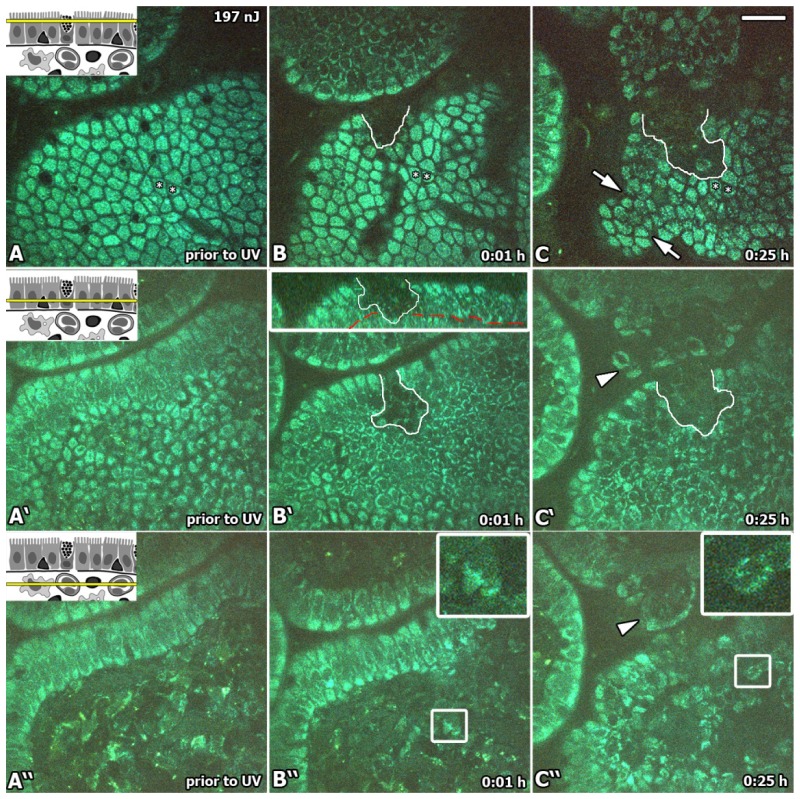
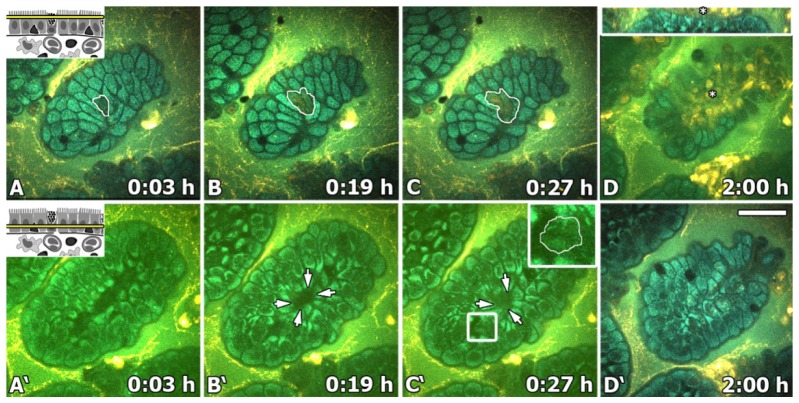
Gut mucosa is an important interface between body and environment. Immune response and healing processes of murine small intestinal mucosa were investigated by intravital time-lapse two-photon excited autofluorescence microscopy of the response to localized laser-induced damage. Epithelial lesions were created by 355-nm, 500-ps pulses from a microchip laser that produced minute cavitation bubbles. Size and dynamics of these bubbles were monitored using a novel interferometric backscattering technique with 80 nm resolution. Small bubbles (< 2.5 µm maximum radius) merely resulted in autofluorescence loss of the target cell. Larger bubbles (7-25 µm) affected several cells and provoked immigration of immune cells (polymorphonuclear leucocytes). Damaged cells were expelled into the lumen, and the epithelium healed within 2 hours by stretching and migration of adjacent epithelial cells.

Keywords: (170.1020) Ablation of tissue; (170.2520) Fluorescence microscopy; (170.2680) Gastrointestinal; (170.3880) Medical and biological imaging; (170.4520) Optical confinement and manipulation; (180.4315) Nonlinear microscopy; (350.3390) Laser materials processing; (350.4855) Optical tweezers or optical manipulation.


Figures

Fig. 1
Fig. 1
Pump-probe setup for UV laser surgery and online dosimetry with spectrally resolved imaging by two-photon fluorescence microscopy. PMT = photomultiplier tube, exp. = beam expander, cw = continuous wave mode, HR = highly reflecting, HT = highly transmitting.
Fig. 2
Fig. 2
Setup for the investigation of murine intestinal mucosa in vivo. (A) Anaesthetised balb/c mouse with ventilation and pulse oximetry on a homeothermic table. (B) Schematic drawing of the topology for accessing the intestinal mucosa with the water immersion microscope objective. (C) Schematic diagram of the intestinal mucosa with epithelium and lamina propria at a villus tip (not true to scale).
Fig. 3
Fig. 3
Scattering signals at the threshold for bubble formation in water (A), and in murine small intestinal epithelium (B). The threshold energies at NA = 1.2 were 103 nJ for water and 33 nJ for intestine, and the bubble oscillation time was Tosc = 29 ns in both cases.
Fig. 4
Fig. 4
Interferometric signal from backscattering at a cavitation bubble in water (A), and in small intestine (B). Oscillation times Tosc as well as expansion and collapse times Texp and Tcoll are marked and amount to: (A) Tosc = 356 ns, Tcoll/Texp = 1.04 (B) Tosc = 596 ns, Tcoll/Texp = 2.47. Laser pulse energies were 210 nJ in (A) and 92 nJ in (B).
Fig. 5
Fig. 5
Scattering signal (A) and radius-time curve (B) of a small cavitation bubble in the epithelium produced with E = 78 nJ. The inset in (A) shows the same signal at a longer time scale. Texp 1 and the endpoints of the first, second and third oscillation are marked with red arrows.
Fig. 6
Fig. 6
Scattering signal in two different time scales (A, B) and radius-time curve (C) of a cavitation bubble in epithelium produced with E = 92 nJ. Texp and Tosc are indicated with arrows. (D) Radius-time curve for a cavitation bubble produced with E = 103 nJ. The inset shows the corresponding scattering signal. (In (C) and (D) only interference maxima were evaluated for the first bubble oscillation, while in the second and third oscillation maxima and minima were used.)
Fig. 7
Fig. 7
Maximum bubble radius Rmax as a function of pulse energy after application of single UV laser pulses (355 nm, 0.5 ns) focussed with NA 1.2 into intestinal epithelium. Error bars reflect the uncertainty in the determination of Texp from the interferometric signal. Two distinct regimes with different bubble sizes are observed: (I) bubbles with Rmax = 0.6 – 2.4 µm and (II) bubbles with Rmax = 7.3 – 25.6 µm. For comparison, the cartoon in the lower right corner shows the dimensions of an epithelial cell in the small intestine.
Fig. 8
Fig. 8
Bubble oscillation asymmetry (collapse time/expansion time) in murine small intestinal mucosa as a function of maximum bubble radius. Error bars for Tcoll/Texp result from the uncertainty in determination of Tosc and Texp from the scattering signals.
Fig. 9
Fig. 9
Small intestinal mucosa. Stack of optical sections through a villus (Media 1) (A) In 4.9 µm depth, the apical cytoplasm with mitochondrial NAD(P)H exhibits a strong fluorescence signal. Mucus in goblet cells appears dark. (B) In 11.8 µm depth, the image predominantly shows the nuclei of enterocytes (arrowheads) and the nuclei of intraepithelial lymphocytes (IEL; arrows). (C) In 27.9 µm depth, the lamina propria beneath the epithelium is visualized with loose connective tissue containing capillaries (C) and antigen-presenting cells (APC). (D) Schematic diagram of the three different focus planes (A-C). Lymphocytes (L), capillaries (C), antigen-presenting cells (APC). Scale bar 15 µm.
Fig. 10
Fig. 10
Still image (A) and time-lapse video (Media 2) of a physiological cell shedding process in murine small intestinal epithelium. The movie covers 11:50 minutes of observation time, and the sequence is repeated 4 times. The yellow line in (B) indicates the location of the imaging plane.
Fig. 11
Fig. 11
Still image (A) and time-lapse video (Media 3) of material transport between two intestinal villi. The time-lapse covers 2 minutes of observation time and the sequence is repeated 5 times in the movie. The yellow line in (B) indicates the location of the imaging plane.
Fig. 12
Fig. 12
Small intestinal mucosa before (A; A’) and 32 min. after (B, B’) application of a UV laser pulse with E = 68 nJ corresponding to maximum bubble radius of 1.9 µm. The drawing in (A) shows the imaging plane for (A) and (B). (A’) and (B’) are sectional side views from the target cell showing the epithelial layer, basement membrane and underlying lamina propria. (B; B’) Within 32 Minutes after UV laser surgery, the target cell (arrow) loses auto-fluorescence and turns dark but remains within the epithelium. (A; B) The arrowhead shows an enterocyte undergoing normal cell shedding. A time-lapse movie covers the first 20 minutes after application of the laser pulse (Media 4). Scale bar 15 µm.
Fig. 13
Fig. 13
Small intestinal mucosa after application of a single UV ns laser pulse with E = 98 nJ, corresponding to a maximum bubble radius of 10.2 µm. The drawings show the image plane of (A-E) and (A’-E’). (A-E) Apical cytoplasm of epithelium showing the target cell (1) and four neighbouring cells turning dark within 31 minutes (Media 5). * goblet cells. (A’-E’) Spreading of the damage in the basal part of the epithelium during the first 31 minutes after laser irradiation. In frame E’, after 31 minutes, neighbouring epithelial cells start moving towards the injured area (arrow). Scale bar 10 µm.
Fig. 14
Fig. 14
Small intestinal mucosa before and after application of a single UV ns laser pulse with E = 197 nJ (Media 6). The drawings show at which depth the focal plane is located in each line of images. (A, A’, A”) Healthy villus. (B, B’, B”) One minute after the UV ns laser pulse several cells beside the target cell have lost autofluorescence. The insert in B’ shows a sectional side view of the affected area, showing that the basement membrane (red) is disrupted. (C, C’, C”) 25 minutes after the UV laser pulse the villus has contracted (arrows) and the damage spread further. Necrotic cell material appears in the lumen (arrowheads). The inserts in B”and C” show magnified images of polymorphonuclear leucocytes in the lamina propria. Two cells are marked with * for orientation and serve as fix points to show the growing extent of the lesion. Scale bar 10 µm. The movie shows an image stack through the villus 25 min. after application of the UV laser pulse, corresponding to column C in the figure. Locations of polymorphonuclear leucocytes are indicated with white arrows.
Fig. 15
Fig. 15
Response of small intestinal mucosa after creation of a bubble with Rmax > 7 µm and luminal application of propidium iodide (PI) (Media 7). (A-C) The target cell and two adjacent cells lost autofluorescence and take up PI. (A’-C’) Epithelial restitution (arrows) is seen in the basal part of the epithelium. The insert in C’ is a magnified image section showing a polymorphonuclear leucocyte in the epithelium. The outline of the cell is marked with a white line, and the dark nucleus shows the characteristic complex shape. (D, D’) Two hours after laser exposure, necrotic cells (*) that took up PI are seen above the villus. The insert in D presents a sectional side view of the villus with intact epithelial lining. In the basal part of the epithelium shown in D’ the defect is sealed. Scale bar 20 µm. The movie shows the focus plane in A’-C’ during minutes 3-27 after application of the UV laser pulse, with the sequence being repeated 9 times. Epithelial restitution and a polymorphonuclear lymphocyte are highlighted.
Fig. 16
Fig. 16
(A, B) Two-photon excited autofluorescence images of polymorphonuclear leucocytes in small intestinal mucosa after application of type II bubbles. Cells show either multilobular (A) or ring shaped nuclei (B). Arrows show highly fluorescent granules in the cytoplasm. (C, D) Merged confocal microscopic images of frozen sections from the small intestine of mice stained with anti CCR 3 for eosinophils (C) and anti Ly-6Gfor neutrophils (D). Like in the two-photon images, the nuclei are either multilobular (C) or ring shaped (D). Scale bar 5 µm.

Similar articles

Cited by

References

    1. Mowat A. M., Viney J. L., “The anatomical basis of intestinal immunity,” Immunol. Rev. 156(1), 145–166 (1997).10.1111/j.1600-065X.1997.tb00966.x - DOI - PubMed
    1. Moore R., Carlson S., Madara J. L., “Rapid barrier restitution in an in vitro model of intestinal epithelial injury,” Lab. Invest. 60(2), 237–244 (1989). - PubMed
    1. McCormack S. A., Viar M. J., Johnson L. R., “Migration of IEC-6 cells: a model for mucosal healing,” Am. J. Physiol. 263(3), G426–G435 (1992). - PubMed
    1. Nusrat A., Delp C., Madara J. L., “Intestinal epithelial restitution. Characterization of a cell culture model and mapping of cytoskeletal elements in migrating cells,” J. Clin. Invest. 89(5), 1501–1511 (1992).10.1172/JCI115741 - DOI - PMC - PubMed
    1. Derikx J. P. M., Matthijsen R. A., De Bruïne A. P., Van Bijnen A. A., Heineman E., Van Dam R. M., Dejong C. H. C., Buurman W. A., “Rapid reversal of human intestinal ischemia-reperfusion induced damage by shedding of injured enterocytes and reepithelialisation,” PLoS ONE 3(10), e3428 (2008).10.1371/journal.pone.0003428 - DOI - PMC - PubMed

LinkOut - more resources