

Automated identification of basal cell carcinoma by polarization-sensitive optical coherence tomography
- PMID: 25360384
- PMCID: PMC4206336
- DOI: 10.1364/BOE.5.003717
Automated identification of basal cell carcinoma by polarization-sensitive optical coherence tomography
Abstract
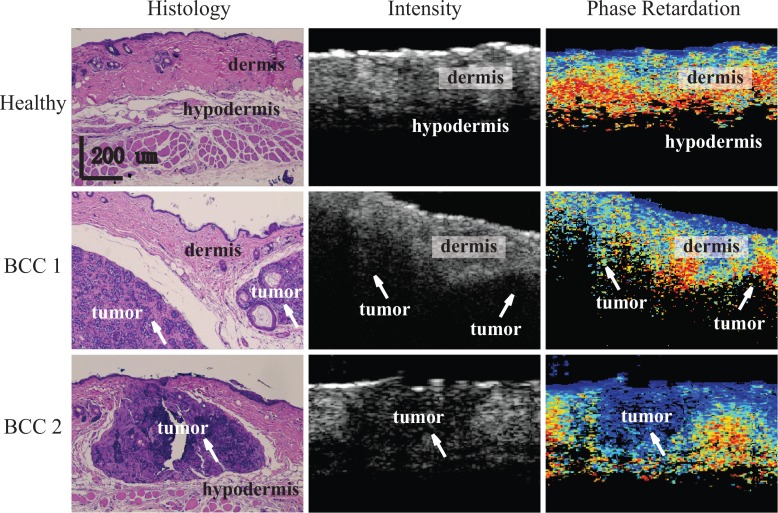
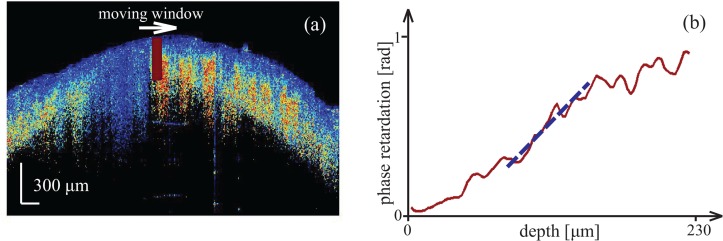
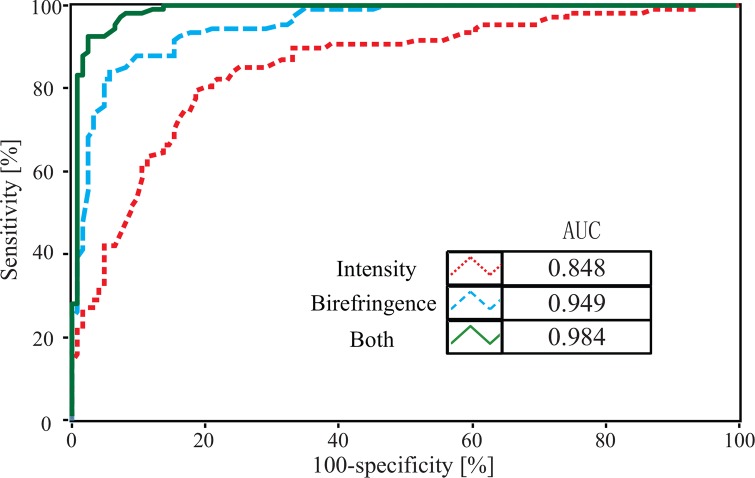
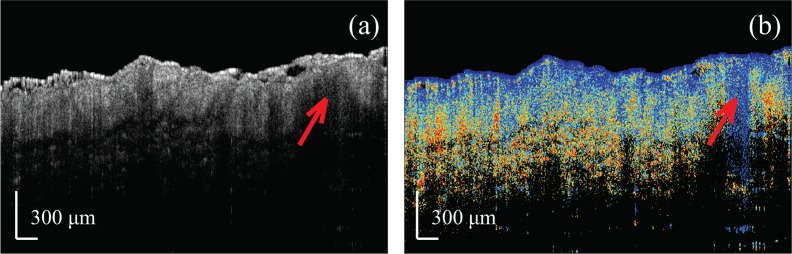
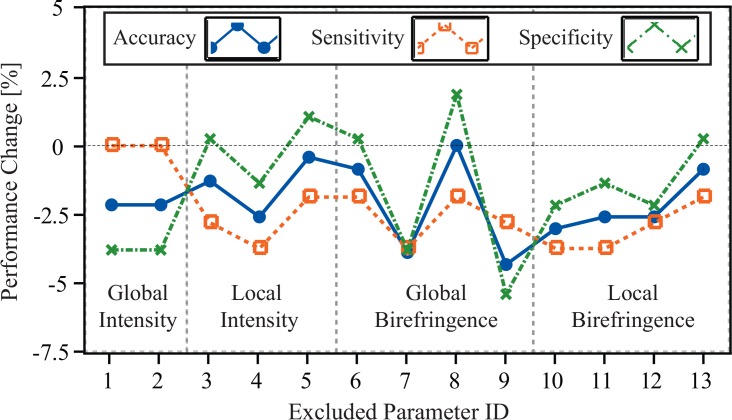
We report an automated classifier to detect the presence of basal cell carcinoma in images of mouse skin tissue samples acquired by polarization-sensitive optical coherence tomography (PS-OCT). The sensitivity and specificity of the classifier based on combined information of the scattering intensity and birefringence properties of the samples are significantly higher than when intensity or birefringence information are used alone. The combined information offers a sensitivity of 94.4% and specificity of 92.5%, compared to 78.2% and 82.2% for intensity-only information and 85.5% and 87.9% for birefringence-only information. These results demonstrate that analysis of the combination of complementary optical information obtained by PS-OCT has great potential for accurate skin cancer diagnosis.
Keywords: (100.2960) Image analysis; (110.5405) Polarimetric imaging; (170.1870) Dermatology; (170.3880) Medical and biological imaging; (170.4500) Optical coherence tomography.
Figures
Similar articles
-
Determination of characteristics of degenerative joint disease using optical coherence tomography and polarization sensitive optical coherence tomography.Lasers Surg Med. 2006 Oct;38(9):852-65. doi: 10.1002/lsm.20394. Lasers Surg Med. 2006. PMID: 16998913
-
Classification of basal cell carcinoma in human skin using machine learning and quantitative features captured by polarization sensitive optical coherence tomography.Biomed Opt Express. 2016 Aug 29;7(9):3721-3735. doi: 10.1364/BOE.7.003721. eCollection 2016 Sep 1. Biomed Opt Express. 2016. PMID: 27699133 Free PMC article.
-
Differentiation of ex vivo human breast tissue using polarization-sensitive optical coherence tomography.Biomed Opt Express. 2014 Sep 4;5(10):3417-26. doi: 10.1364/BOE.5.003417. eCollection 2014 Oct 1. Biomed Opt Express. 2014. PMID: 25360360 Free PMC article.
-
Polarization sensitive optical coherence tomography - a review [Invited].Biomed Opt Express. 2017 Feb 24;8(3):1838-1873. doi: 10.1364/BOE.8.001838. eCollection 2017 Mar 1. Biomed Opt Express. 2017. PMID: 28663869 Free PMC article. Review.
-
Review of polarization sensitive optical coherence tomography and Stokes vector determination.J Biomed Opt. 2002 Jul;7(3):359-71. doi: 10.1117/1.1483879. J Biomed Opt. 2002. PMID: 12175285 Review.
Cited by
-
Automatically Determining the Confocal Parameters From OCT B-Scans for Quantification of the Attenuation Coefficients.IEEE Trans Med Imaging. 2019 Jan;38(1):261-268. doi: 10.1109/TMI.2018.2861570. Epub 2018 Jul 31. IEEE Trans Med Imaging. 2019. PMID: 30072317 Free PMC article.
-
Birefringence imaging of posterior eye by multi-functional Jones matrix optical coherence tomography.Biomed Opt Express. 2015 Nov 19;6(12):4951-74. doi: 10.1364/BOE.6.004951. eCollection 2015 Dec 1. Biomed Opt Express. 2015. PMID: 26713208 Free PMC article.
-
Quantitative single-mode fiber based PS-OCT with single input polarization state using Mueller matrix.Biomed Opt Express. 2015 Apr 22;6(5):1828-43. doi: 10.1364/BOE.6.001828. eCollection 2015 May 1. Biomed Opt Express. 2015. PMID: 26137383 Free PMC article.
-
3-D Adaptive Sparsity Based Image Compression With Applications to Optical Coherence Tomography.IEEE Trans Med Imaging. 2015 Jun;34(6):1306-20. doi: 10.1109/TMI.2014.2387336. Epub 2015 Jan 1. IEEE Trans Med Imaging. 2015. PMID: 25561591 Free PMC article.
-
Polarization-sensitive optical coherence tomography for renal tumor detection in ex vivo human kidneys.Opt Lasers Eng. 2024 Feb;173:107900. doi: 10.1016/j.optlaseng.2023.107900. Epub 2023 Oct 23. Opt Lasers Eng. 2024. PMID: 37982078 Free PMC article.
References
LinkOut - more resources
Full Text Sources
Other Literature Sources