

Tumor suppressors TSC1 and TSC2 differentially modulate actin cytoskeleton and motility of mouse embryonic fibroblasts
- PMID: 25360538
- PMCID: PMC4216017
- DOI: 10.1371/journal.pone.0111476
Tumor suppressors TSC1 and TSC2 differentially modulate actin cytoskeleton and motility of mouse embryonic fibroblasts
Erratum in
-
Correction: Tumor suppressors TSC1 and TSC2 differentially modulate actin cytoskeleton and motility of mouse embryonic fibroblasts.PLoS One. 2015 Mar 5;10(3):e0118637. doi: 10.1371/journal.pone.0118637. eCollection 2015. PLoS One. 2015. PMID: 25742127 Free PMC article. No abstract available.
Abstract
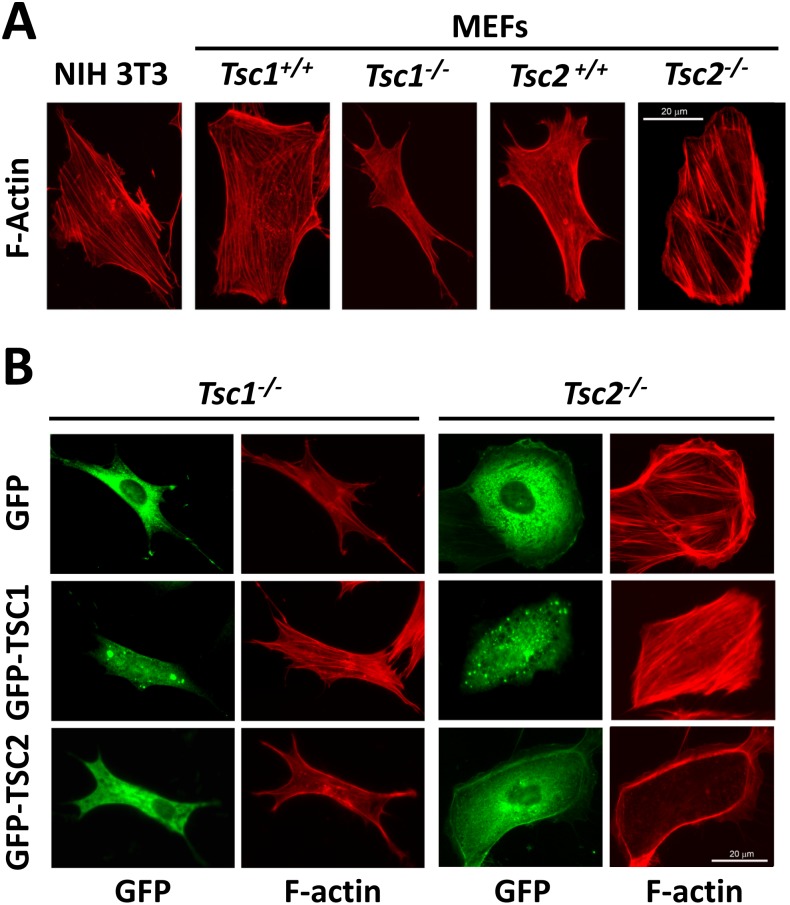
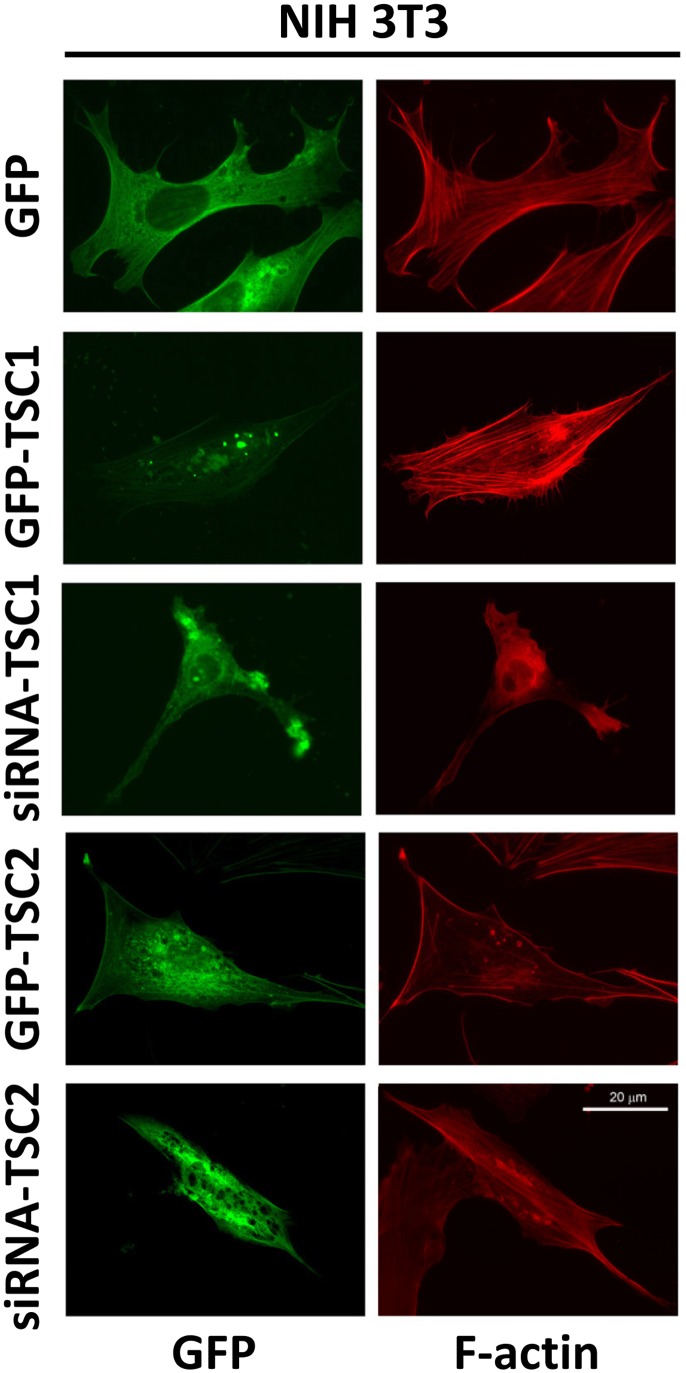
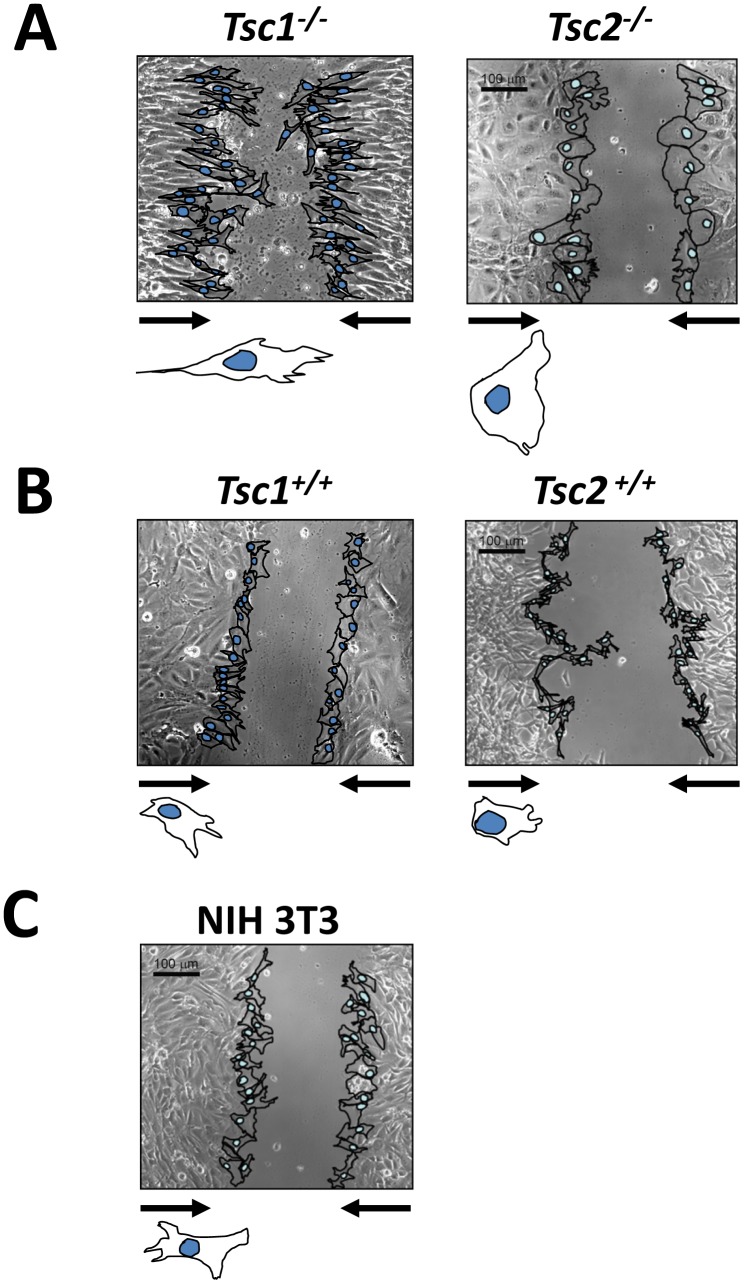
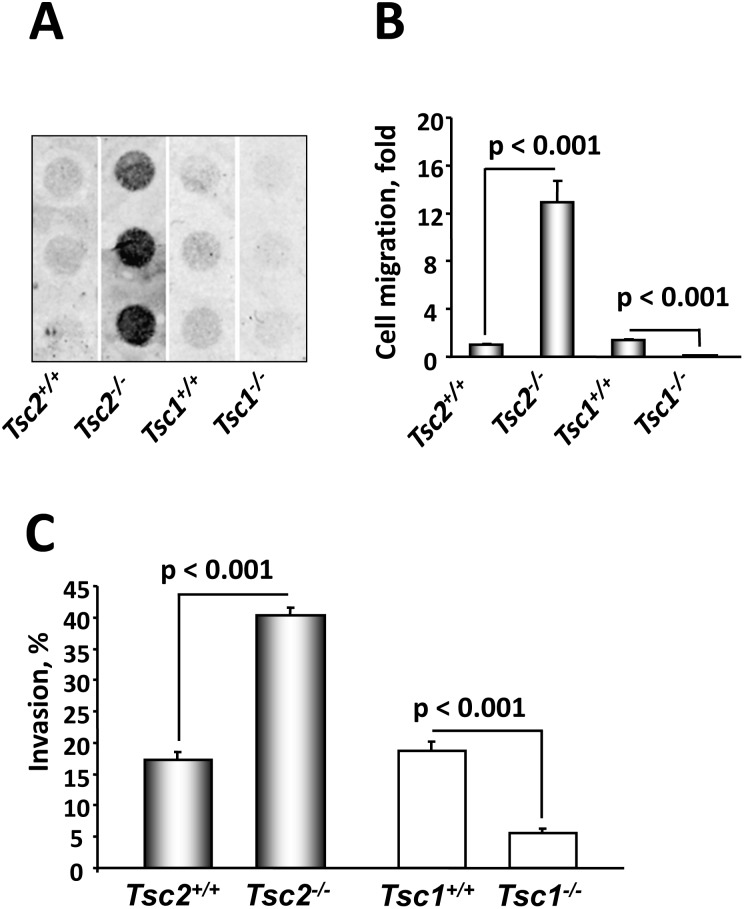
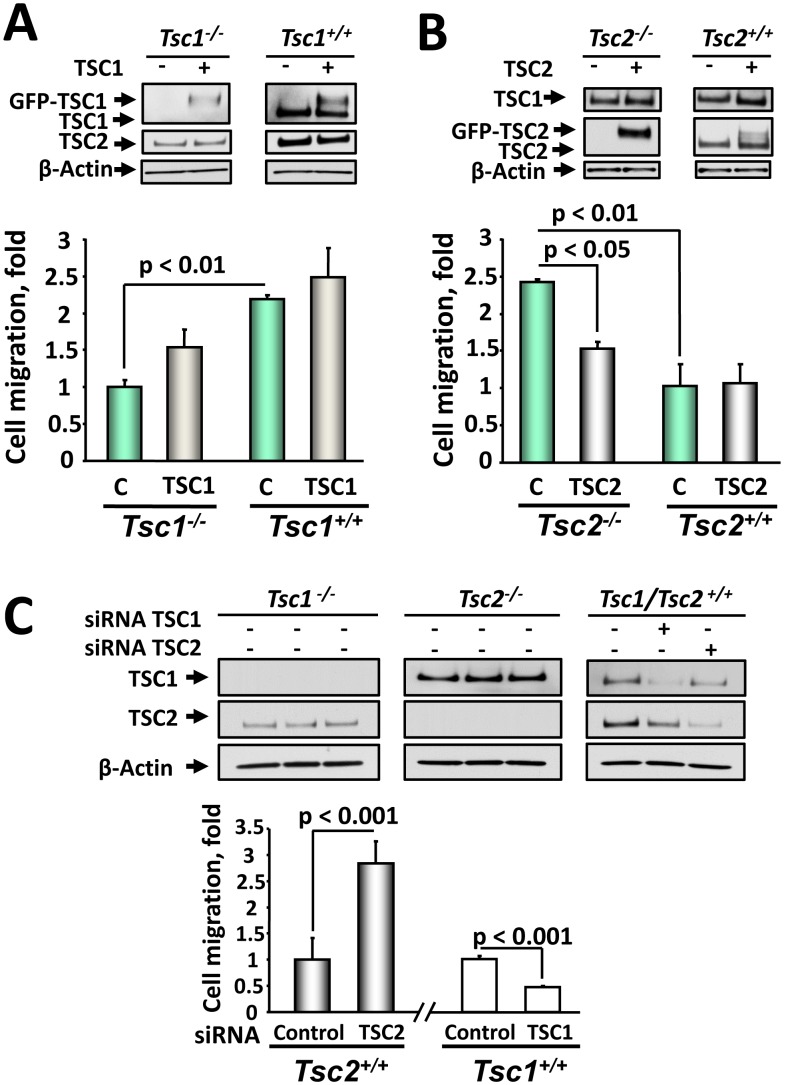
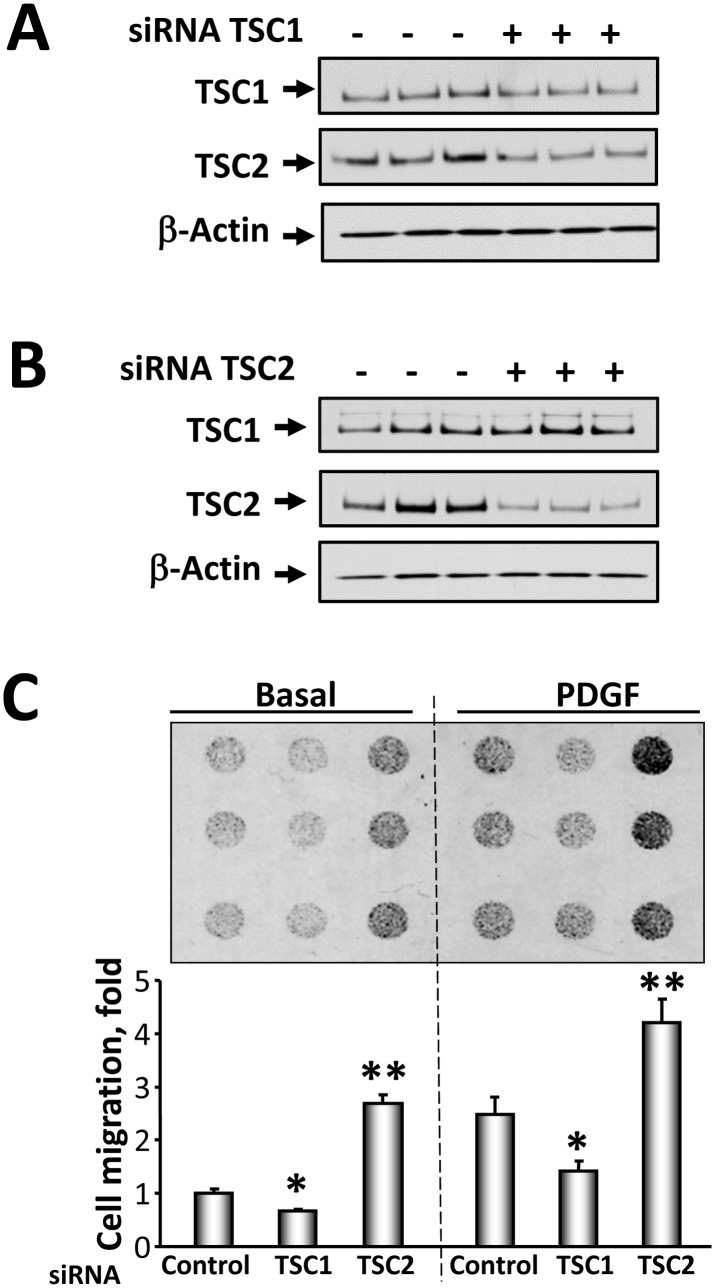
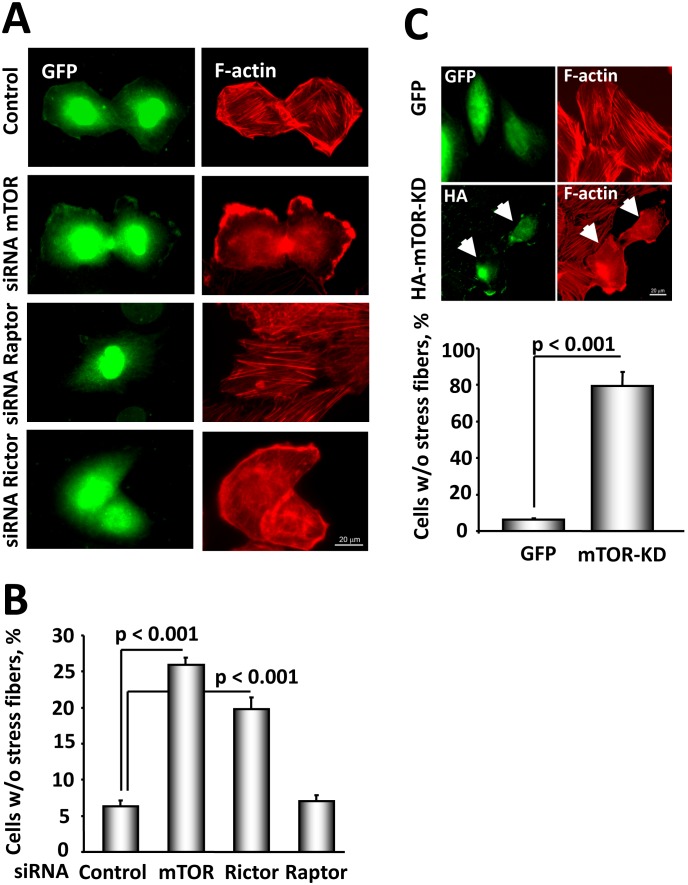
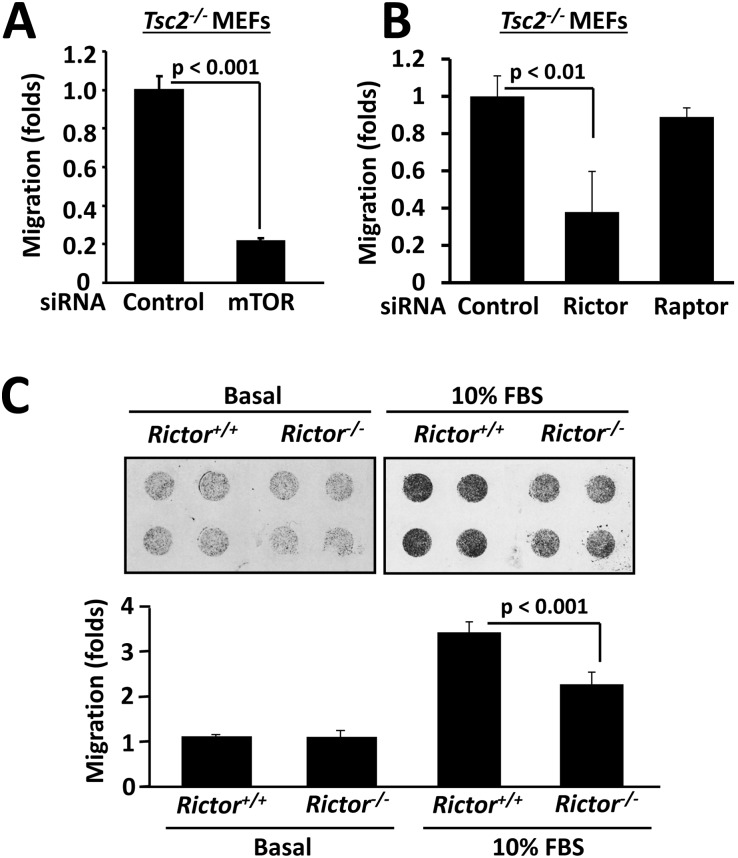
TSC1 and TSC2 mutations cause neoplasms in rare disease pulmonary LAM and neuronal pathfinding in hamartoma syndrome TSC. The specific roles of TSC1 and TSC2 in actin remodeling and the modulation of cell motility, however, are not well understood. Previously, we demonstrated that TSC1 and TSC2 regulate the activity of small GTPases RhoA and Rac1, stress fiber formation and cell adhesion in a reciprocal manner. Here, we show that Tsc1(-/-) MEFs have decreased migration compared to littermate-derived Tsc1(+/+) MEFs. Migration of Tsc1(-/-) MEFs with re-expressed TSC1 was comparable to Tsc1(+/+) MEF migration. In contrast, Tsc2(-/-) MEFs showed an increased migration compared to Tsc2(+/+) MEFs that were abrogated by TSC2 re-expression. Depletion of TSC1 and TSC2 using specific siRNAs in wild type MEFs and NIH 3T3 fibroblasts also showed that TSC1 loss attenuates cell migration while TSC2 loss promotes cell migration. Morphological and immunochemical analysis demonstrated that Tsc1(-/-) MEFs have a thin protracted shape with a few stress fibers; in contrast, Tsc2(-/-) MEFs showed a rounded morphology and abundant stress fibers. Expression of TSC1 in either Tsc1(-/-) or Tsc2(-/-) MEFs promoted stress fiber formation, while TSC2 re-expression induced stress fiber disassembly and the formation of cortical actin. To assess the mechanism(s) by which TSC2 loss promotes actin re-arrangement and cell migration, we explored the role of known downstream effectors of TSC2, mTORC1 and mTORC2. Increased migration of Tsc2(-/-) MEFs is inhibited by siRNA mTOR and siRNA Rictor, but not siRNA Raptor. siRNA mTOR or siRNA Rictor promoted stress fiber disassembly in TSC2-null cells, while siRNA Raptor had little effect. Overexpression of kinase-dead mTOR induced actin stress fiber disassembly and suppressed TSC2-deficient cell migration. Our data demonstrate that TSC1 and TSC2 differentially regulate actin stress fiber formation and cell migration, and that only TSC2 loss promotes mTOR- and mTORC2-dependent pro-migratory cell phenotype.
Conflict of interest statement
Figures
Similar articles
-
mTORC2 is required for proliferation and survival of TSC2-null cells.Mol Cell Biol. 2011 Jun;31(12):2484-98. doi: 10.1128/MCB.01061-10. Epub 2011 Apr 11. Mol Cell Biol. 2011. PMID: 21482669 Free PMC article.
-
TSC1 controls distribution of actin fibers through its effect on function of Rho family of small GTPases and regulates cell migration and polarity.PLoS One. 2013;8(1):e54503. doi: 10.1371/journal.pone.0054503. Epub 2013 Jan 23. PLoS One. 2013. PMID: 23355874 Free PMC article.
-
Signaling events downstream of mammalian target of rapamycin complex 2 are attenuated in cells and tumors deficient for the tuberous sclerosis complex tumor suppressors.Cancer Res. 2009 Aug 1;69(15):6107-14. doi: 10.1158/0008-5472.CAN-09-0975. Epub 2009 Jul 14. Cancer Res. 2009. PMID: 19602587 Free PMC article.
-
A complex interplay between Akt, TSC2 and the two mTOR complexes.Biochem Soc Trans. 2009 Feb;37(Pt 1):217-22. doi: 10.1042/BST0370217. Biochem Soc Trans. 2009. PMID: 19143635 Free PMC article. Review.
-
Mourning Dr. Alfred G. Knudson: the two-hit hypothesis, tumor suppressor genes, and the tuberous sclerosis complex.Cancer Sci. 2017 Jan;108(1):5-11. doi: 10.1111/cas.13116. Epub 2017 Jan 23. Cancer Sci. 2017. PMID: 27862655 Free PMC article. Review.
Cited by
-
Beyond Protein Synthesis; The Multifaceted Roles of Tuberin in Cell Cycle Regulation.Front Cell Dev Biol. 2022 Jan 14;9:806521. doi: 10.3389/fcell.2021.806521. eCollection 2021. Front Cell Dev Biol. 2022. PMID: 35096832 Free PMC article. Review.
-
Lymphangioleiomyomatosis: A Monogenic Model of Malignancy.Annu Rev Med. 2017 Jan 14;68:69-83. doi: 10.1146/annurev-med-050715-104245. Annu Rev Med. 2017. PMID: 28099079 Free PMC article. Review.
-
The Andes Virus Nucleocapsid Protein Directs Basal Endothelial Cell Permeability by Activating RhoA.mBio. 2016 Oct 25;7(5):e01747-16. doi: 10.1128/mBio.01747-16. mBio. 2016. PMID: 27795403 Free PMC article.
-
Emerging Link between Tsc1 and FNIP Co-Chaperones of Hsp90 and Cancer.Biomolecules. 2022 Jul 1;12(7):928. doi: 10.3390/biom12070928. Biomolecules. 2022. PMID: 35883484 Free PMC article. Review.
-
Exome sequencing reveals a high genetic heterogeneity on familial Hirschsprung disease.Sci Rep. 2015 Nov 12;5:16473. doi: 10.1038/srep16473. Sci Rep. 2015. PMID: 26559152 Free PMC article.
References
Publication types
MeSH terms
Substances
Grants and funding
LinkOut - more resources
Full Text Sources
Other Literature Sources
Research Materials
Miscellaneous
