. 2014 Dec 19;3(12):880-91.
doi: 10.1021/sb5002856. Epub 2014 Nov 20.

Systematic transfer of prokaryotic sensors and circuits to mammalian cells

Affiliations

Systematic transfer of prokaryotic sensors and circuits to mammalian cells

Brynne C Stanton et al. ACS Synth Biol. .

Abstract

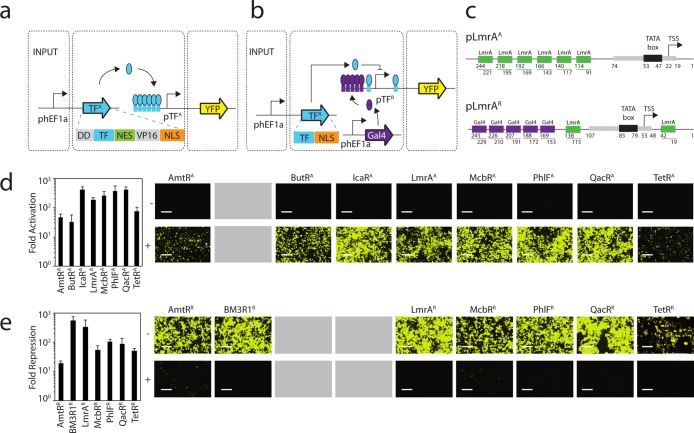
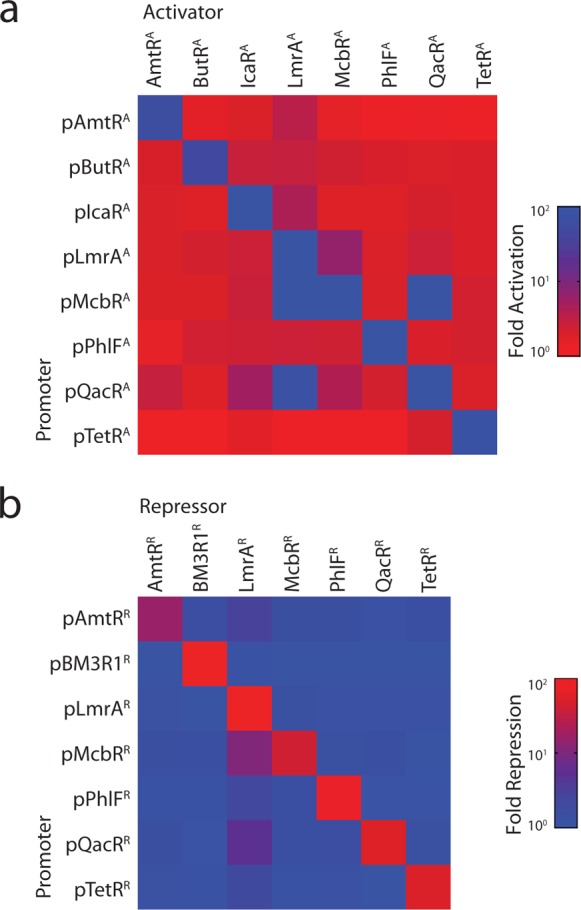
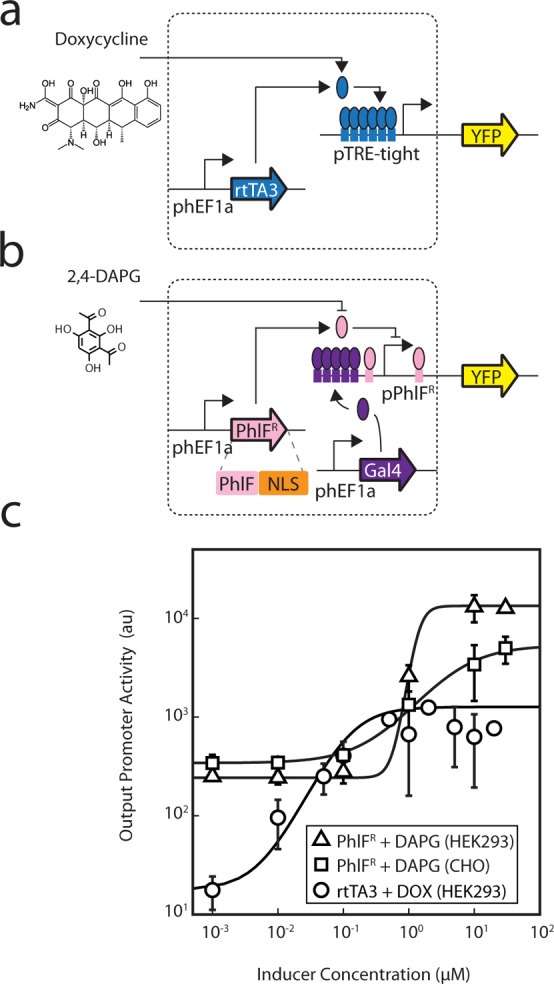
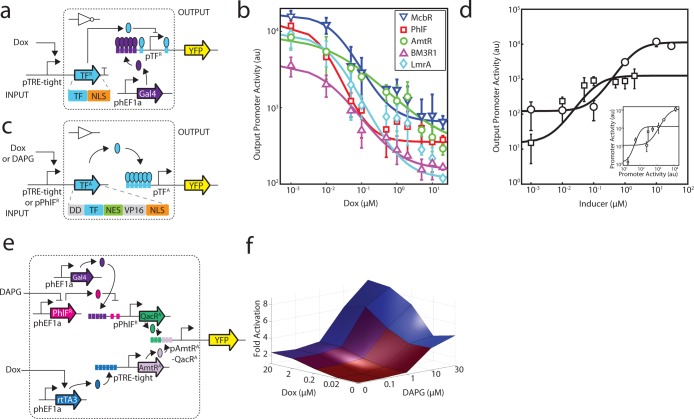
Prokaryotic regulatory proteins respond to diverse signals and represent a rich resource for building synthetic sensors and circuits. The TetR family contains >10(5) members that use a simple mechanism to respond to stimuli and bind distinct DNA operators. We present a platform that enables the transfer of these regulators to mammalian cells, which is demonstrated using human embryonic kidney (HEK293) and Chinese hamster ovary (CHO) cells. The repressors are modified to include nuclear localization signals (NLS) and responsive promoters are built by incorporating multiple operators. Activators are also constructed by modifying the protein to include a VP16 domain. Together, this approach yields 15 new regulators that demonstrate 19- to 551-fold induction and retain both the low levels of crosstalk in DNA binding specificity observed between the parent regulators in Escherichia coli, as well as their dynamic range of activity. By taking advantage of the DAPG small molecule sensing mediated by the PhlF repressor, we introduce a new inducible system with 50-fold induction and a threshold of 0.9 μM DAPG, which is comparable to the classic Dox-induced TetR system. A set of NOT gates is constructed from the new repressors and their response function quantified. Finally, the Dox- and DAPG- inducible systems and two new activators are used to build a synthetic enhancer (fuzzy AND gate), requiring the coordination of 5 transcription factors organized into two layers. This work introduces a generic approach for the development of mammalian genetic sensors and circuits to populate a toolbox that can be applied to diverse applications from biomanufacturing to living therapeutics.

Keywords: 2,4-diacetylphloroglucinol (DAPG); eukaryote; inducible system; mammalian synthetic biology; systems biology.


Figures

Figure 1
Figure 1
Design and characterization of synthetic transcription factors. (a) Expression of TFA is controlled by the constitutive hEF1a promoter. Operator sequences are shown as boxes. pTFA controls expression of the YFP output, which is activated by its cognate transcription factor. (b) The control system for TFR is similar to part a except that Gal4-VP16 is constitutively expressed from a third plasmid. pTFR controls expression of the YFP output, which is activated by Gal4-VP16 and repressed by its cognate transcription factor. (c) A detailed positional view of the activated (pLmrAA, top) and repressed (pLmrAR, bottom) LmrA promoters is illustrated. The pLmrAA promoter contains a minimal CMV promoter core with six upstream operators. The pLmrAR promoter consists of a minimal CMV promoter that is surrounded by two LmrA operators and five upstream Gal4 operators. The corresponding transcriptional start site (TSS) and TATA box are illustrated. (d) The function of the activators are shown and compared to the TetR activator (TetRA). The fold-activation was calculated by comparing the average fluorescence in the presence of a plasmid encoding the activator (P-constitutive TFA) with that obtained from the reporter plasmid (P-pTFA reporter) in the absence of the P-constitutive TFA plasmid. Cells were grown for 48 h post-transfection and assayed using flow cytometry (Methods). Representative histograms are shown in Supporting Information Figure 5. Microscopic images of cells transfected with the reporter only (−, top panel) or the cotransfected reporter and activator (+, bottom panel) are shown. BFP transfection controls are shown in Supporting Information Figure 6. (e) The function of the repressors are shown and compared to the TetR repressor (TetRR). Fold-repression is calculated by comparing the average fluorescence in the presence and absence of the plasmid containing the repressor (P-constitutive TFR). Microscopic images of cells transfected with the reporter and Gal4-VP16 (−, top panel) or the reporter, Gal4-VP16, and the repressor (+, bottom panel) are shown. Fluorescence histograms generated from the FITC-A geometric mean and BFP transfection control images are shown in Supporting Information Figures 7 and 8, respectively. In both parts d and e, the error bars were calculated based on the standard deviation of three independent experiments performed on different days. Cells are visualized using a YFP filter at 10× magnification, and images were taken 48 h post-transfection. The scale bars correspond to 400 μm. Gray boxes indicate that a particular TetR homologue was converted into only an activator or repressor and the other version was either not built or is nonfunctional.
Figure 2
Figure 2
Orthogonality between synthetic transcription factors. (a) Crosstalk is shown between all combinations of activators and promoters. The fold-activation is calculated by dividing the average fluorescence of cells containing both the reporter and activator plasmids by the average fluorescence of cells only transfected with the reporter plasmid. Raw data underlying the matrix are shown in Supporting Information Figure 9, and data correspond to the average FITC-A geometric mean values from flow cytometry data collected from three independent transfections carried out on separate days. (b) Crosstalk is shown between all combinations of repressors and promoters. The fold-repression is calculated by dividing the average fluorescence of cells containing the reporter and Gal4-VP16 encoded plasmids by the fluorescence of cells transfected with plasmids encoding the reporter, Gal4-VP16, and cognate repressor. Raw data underlying the matrix are shown in Supporting Information Figure 10, and data correspond to the average FITC-A geometric mean values from flow cytometry data collected from three independent transfections carried out on separate days.
Figure 3
Figure 3
Characterization of the DAPG-inducible PhlFR system. (a) The structure of doxycycline and the Tet-On inducible system, comprised of the rtTA3 regulator, are shown. In this system, rtTA3 is constitutively expressed from the phEF1a constitutive promoter and activates expression of its cognate promoter which contains 6 copies of the TetR operator sequence situated upstream of the minimal CMV promoter (referred to as pTRE-tight). The rtTA3 regulator binds to and activates expression from the pTRE-tight promoter in the presence of doxycycline. (b) The structure of DAPG and the PhlF inducible system are shown. In this system, PhlFR is constitutively expressed from the phEF1a promoter. The pPhlFR output promoter is activated by Gal4-VP16, which is constitutively expressed by the phEF1a promoter. PhlFR binds to and represses expression from the pPhlFR promoter in the absence of DAPG. (c) Induction of the Dox- and DAPG- inducible systems are compared and were measured in both HEK293 (Dox and DAPG systems) and CHO cells (DAPG system only). YFP fluorescence was measured after induction at [0, 0.01, 0.1, 1, 10, and 30 μM DAPG] or [0, 0.01, 0.05, 0.1, 0.5, 1, 2, 5, 10, 20 μM Dox]. The lines were fit to a Hill equation (Methods), the parameters for which are shown in Supporting Information Table 1. The data shown correspond to the average of three experiments from different transfections performed on different days, and error bars correspond to the standard deviation. Representative cytometry histograms for the three inducible systems are shown in Supporting Information Figure 11.
Figure 4
Figure 4
Gate and circuit response functions. (a) The Dox inducible system is used to characterize NOT gates. Symbols are as described in Figure 1. Expression of TFR is controlled by the TRE-tight promoter, which is activated by the TetR activator (rtTA3) in the presence of Dox. Expression of the rtTA3 gene is controlled by the constitutive hEF1a promoter. (b) The response of each NOT gate is shown: McbR (blue inverted triangles), PhlF (red squares), AmtR (green circles), BM3R1 (purple triangles), and LmrA (light blue diamonds). The expression of the fluorescent reporter from the output promoter (pTFR) with respect to the induction of the input promoter (pTRE-tight) via Dox is shown. The average and standard deviation are plotted from three replicates from transfections performed on different days. Cytometry distributions corresponding to the FITC-A geometric mean of the 0, 0.5, and 5 μM induction points are shown in Supporting Information Figure 12 and fit parameters for each curve are listed in Table 2. (c) Two inducible systems (Dox or DAPG via pPhlFR) are used to measure the response function of the buffer gates based on transcriptional activators (TFA). (d) The response functions of the buffer gates are shown. The Dox-inducible system is used to characterize the AmtRA gate (circles) and the DAPG-inducible system is used to characterize the QacRA gate (squares). The inset shows the response as a function of input promoter activity (pTRE-tight or pPhlFR), rather than inducer concentration (Methods). Cytometry distributions corresponding to data for several induction points are shown in Supporting Information Figure 13 and fit parameters for each curve are listed in Table 3. (e) A schematic of the circuit that behaves as an enhancer is shown. The pAmtRA-QacRA promoter contains three upstream operators for each TF. (f) Enhancer fold activation of the output promoter (pAmtRA-QacRA) is shown as a function of the two inducers, where inducer concentrations vary from 0 to 20 μM doxycyline and 0–30 μM DAPG. Activation is indicated in blue, and data correspond to average fluorescence values from three replicates collected on different days. Cytometry distributions and error bars are shown in Supporting Information Figures 15 and 16, respectively.

References

    1. Fischbach M. A.; Bluestone J. A.; Lim W. A. (2013) Cell-based therapeutics: The next pillar of medicine. Sci. Transl. Med. 5, 179ps177. - PMC - PubMed
    1. Bacchus W.; Aubel D.; Fussenegger M. (2013) Biomedically relevant circuit-design strategies in mammalian synthetic biology. Mol. Syst. Biol. 9, 691. - PMC - PubMed
    1. Chen Y. Y.; Smolke C. D. (2011) From DNA to targeted therapeutics: Bringing synthetic biology to the clinic. Sci. Transl. Med. 3, 106ps142. - PMC - PubMed
    1. Slusarczyk A. L.; Lin A.; Weiss R. (2012) Foundations for the design and implementation of synthetic genetic circuits. Nat. Rev. Genet. 13, 406–420. - PubMed
    1. Fussenegger M.; Schlatter S.; Datwyler D.; Mazur X.; Bailey J. E. (1998) Controlled proliferation by multigene metabolic engineering enhances the productivity of Chinese hamster ovary cells. Nat. Biotechnol. 16, 468–472. - PubMed

Publication types