Myelin-forming cell-specific cadherin-19 is a marker for minimally infiltrative glioblastoma stem-like cells
- PMID: 25361488
- PMCID: PMC4337891
- DOI: 10.3171/2014.9.JNS132373
Myelin-forming cell-specific cadherin-19 is a marker for minimally infiltrative glioblastoma stem-like cells
Abstract
Object: Glioblastoma stem-like cells (GSCs) exhibit stem-like properties, are highly efficient at forming tumor xenografts, and are resistant to many current therapies. Current molecular identifiers of GSCs are scarce and controversial. The authors describe differential cell-surface gene expression profiling to identify GSC-specific markers.
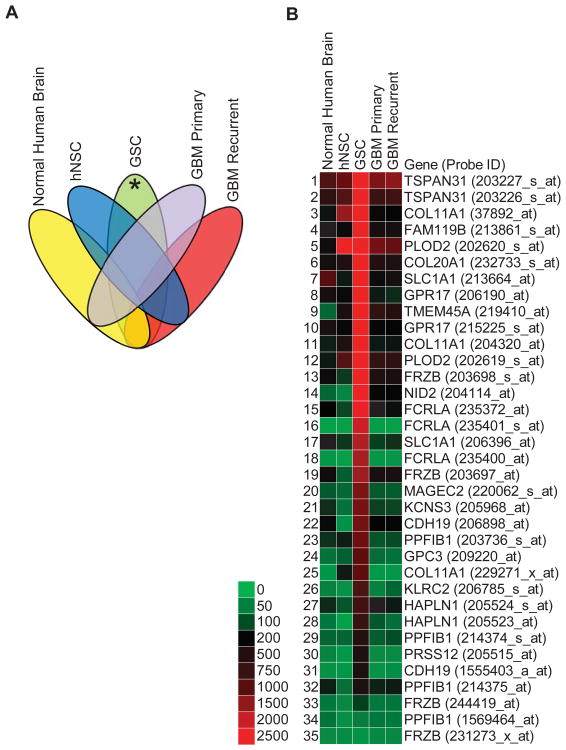
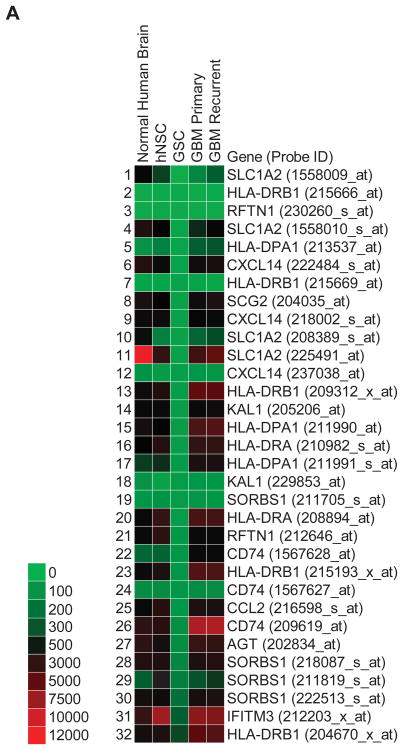
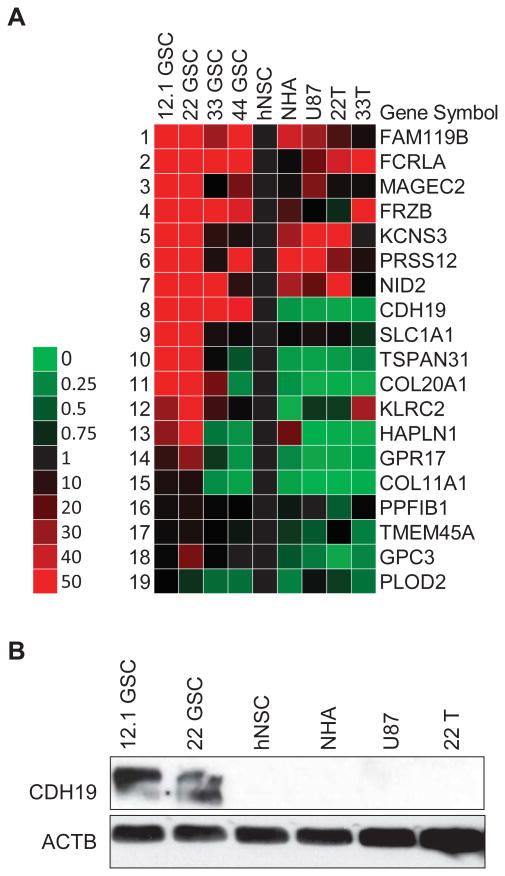
Methods: Independent human GSC lines were isolated and maintained in standard neural stem cell (NSC) media and were validated for self-renewal, multipotent differentiation, and tumor initiation properties. Candidate upregulated GSCspecific plasma membrane markers were identified through differential Affymetrix U133 Plus 2.0 Array gene expression profiling of GSCs, human NSCs (hNSCs), normal brain tissue, and primary/recurrent glioblastoma multiforme samples. Results were validated by using comparative quantitative reverse transcription polymerase chain reaction and Western blot analysis of GSCs, hNSCs, normal human astrocytes, U87 glioma cell line, and patient-matched serum-cultured glioblastoma multiforme samples.
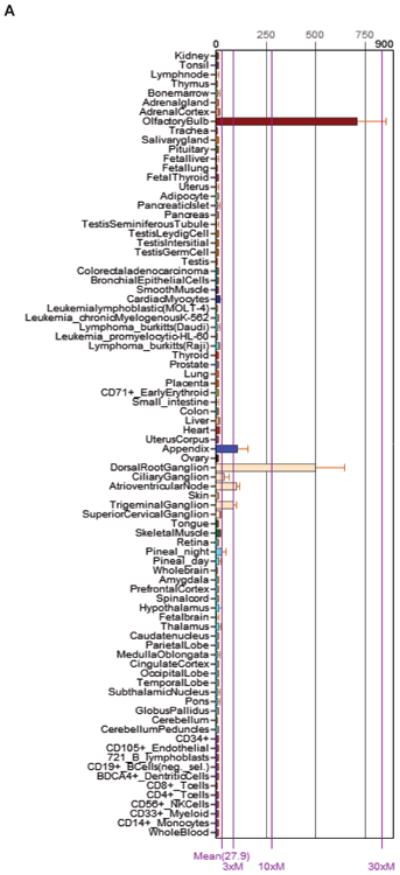
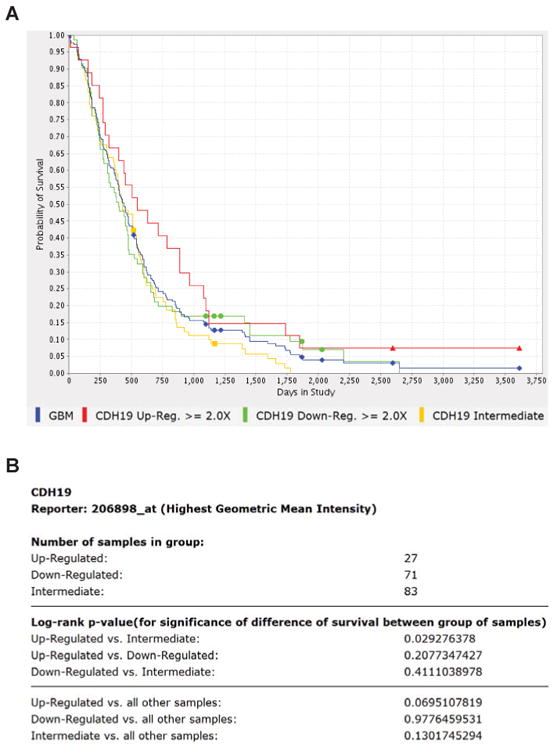
Results: A candidate GSC-specific signature of 19 upregulated known and novel plasma membrane-associated genes was identified. Preferential upregulation of these plasma membrane-linked genes was validated by quantitative polymerase chain reaction. Cadherin-19 (CDH19) protein expression was enhanced in minimally infiltrative GSC lines.
Conclusions: Gene expression profiling of GSCs has shown CDH19 to be an exciting new target for drug development and study of GBM tumorigenesis.
Keywords: ACTB = β-actin; CDH = cadherin; CDH19; CNP = 2′, 3′-cyclic-nucleotide 3′-phosphodiesterase; GBM = glioblastoma multiforme; GPC3 = glypican-3; GPR17 = G protein–coupled receptor 17; GSC = glioblastoma stem-like cell; HLA = human leukocyte antigen; MCPIP = monocyte chemotactic protein 1–induced protein; MHC = major histocompatibility complex; NCBI GEO = National Center for Biotechnology Information Gene Expression Omnibus; NCI REMBRANDT = National Cancer Institute Repository of Molecular Brain Neoplasia Database; NHA = normal human astrocyte; OPC = oligodendrocyte progenitor cell; cadherin-19; gene expression profiling; glioblastoma multiforme; glioblastoma stem-like cells; hNSC = human neural stem cell; oncology; qRT-PCR = quantitative reverse transcription polymerase chain reaction.
Conflict of interest statement
Figures
Similar articles
-
Differential expression of 2',3'-cyclic-nucleotide 3'-phosphodiesterase and neural lineage markers correlate with glioblastoma xenograft infiltration and patient survival.Clin Cancer Res. 2012 Jul 1;18(13):3628-36. doi: 10.1158/1078-0432.CCR-12-0339. Epub 2012 May 15. Clin Cancer Res. 2012. PMID: 22589395 Free PMC article.
-
CDH5 is specifically activated in glioblastoma stemlike cells and contributes to vasculogenic mimicry induced by hypoxia.Neuro Oncol. 2013 Jul;15(7):865-79. doi: 10.1093/neuonc/not029. Epub 2013 May 3. Neuro Oncol. 2013. PMID: 23645533 Free PMC article.
-
Combined expressional analysis, bioinformatics and targeted proteomics identify new potential therapeutic targets in glioblastoma stem cells.Oncotarget. 2015 Sep 22;6(28):26192-215. doi: 10.18632/oncotarget.4613. Oncotarget. 2015. PMID: 26295306 Free PMC article.
-
Targeting glioblastoma stem cells: cell surface markers.Curr Med Chem. 2012;19(35):6050-5. Curr Med Chem. 2012. PMID: 22963566 Review.
-
New aspects of glioblastoma multiforme revealed by similarities between neural and glioblastoma stem cells.Cell Biol Toxicol. 2018 Dec;34(6):425-440. doi: 10.1007/s10565-017-9420-y. Epub 2018 Jan 31. Cell Biol Toxicol. 2018. PMID: 29383547 Review.
Cited by
-
Exosomal circZNF800 Derived from Glioma Stem-like Cells Regulates Glioblastoma Tumorigenicity via the PIEZO1/Akt Axis.Mol Neurobiol. 2024 Sep;61(9):6556-6571. doi: 10.1007/s12035-024-04002-0. Epub 2024 Feb 7. Mol Neurobiol. 2024. PMID: 38324181 Free PMC article.
-
The effects of tumor treating fields and temozolomide in MGMT expressing and non-expressing patient-derived glioblastoma cells.J Clin Neurosci. 2017 Feb;36:120-124. doi: 10.1016/j.jocn.2016.10.042. Epub 2016 Nov 16. J Clin Neurosci. 2017. PMID: 27865821 Free PMC article.
-
Hippocampal transcriptome profiling reveals common disease pathways in chronic hypoperfusion and aging.Aging (Albany NY). 2021 Jun 1;13(11):14651-14674. doi: 10.18632/aging.203123. Epub 2021 Jun 1. Aging (Albany NY). 2021. PMID: 34074801 Free PMC article.
-
SIX2 Mediates Late-Stage Metastasis via Direct Regulation of SOX2 and Induction of a Cancer Stem Cell Program.Cancer Res. 2019 Feb 15;79(4):720-734. doi: 10.1158/0008-5472.CAN-18-1791. Epub 2019 Jan 3. Cancer Res. 2019. PMID: 30606720 Free PMC article.
-
In Silico Identification of Key Genes and Immune Infiltration Characteristics in Epicardial Adipose Tissue from Patients with Coronary Artery Disease.Biomed Res Int. 2022 Oct 29;2022:5610317. doi: 10.1155/2022/5610317. eCollection 2022. Biomed Res Int. 2022. PMID: 36345357 Free PMC article.
References
-
- Bao S, Wu Q, McLendon RE, Hao Y, Shi Q, Hjelmeland AB, et al. Glioma stem cells promote radioresistance by preferential activation of the DNA damage response. Nature. 2006;444:756–760. - PubMed
-
- Bonnet D, Dick JE. Human acute myeloid leukemia is organized as a hierarchy that originates from a primitive hematopoietic cell. Nat Med. 1997;3:730–737. - PubMed
-
- Chen R, Nishimura MC, Bumbaca SM, Kharbanda S, Forrest WF, Kasman IM, et al. A hierarchy of self-renewing tumor-initiating cell types in glioblastoma. Cancer Cell. 2010;17:362–375. - PubMed
Web Resources
-
- Geospiza GeneSifter. [Accessed September 30, 2011];Online Microarray Database and Analysis Software. https://login.genesifter.net.
-
- National Cancer Institute (NCI) Repository for Molecular Brain Neoplasia Data (REMBRANDT) [Accessed June 5, 2013];Database. http://rembrandt-db.nci.nih.gov.
-
- BioGPS. [Accessed June 5, 2013];Customizable Gene Annotation Portal. http://biogps.org/#goto=welcome.
Publication types
MeSH terms
Substances
Grants and funding
LinkOut - more resources
Full Text Sources
Other Literature Sources
Medical
Molecular Biology Databases
Research Materials
Miscellaneous