. 2015 Jan 1;308(1):L22-32.
doi: 10.1152/ajplung.00163.2014. Epub 2014 Oct 31.

Linking increased airway hydration, ciliary beating, and mucociliary clearance through ENaC inhibition

Affiliations

Linking increased airway hydration, ciliary beating, and mucociliary clearance through ENaC inhibition

Annika B M Åstrand et al. Am J Physiol Lung Cell Mol Physiol. .

Abstract

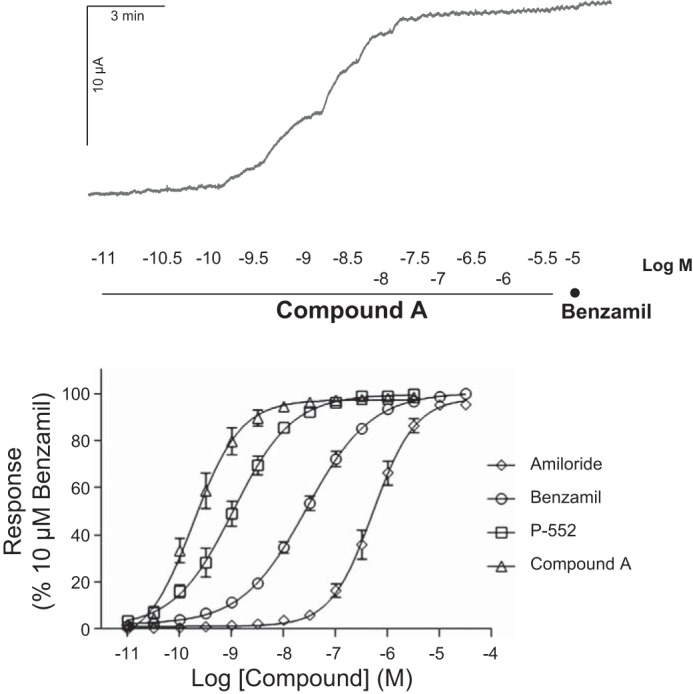
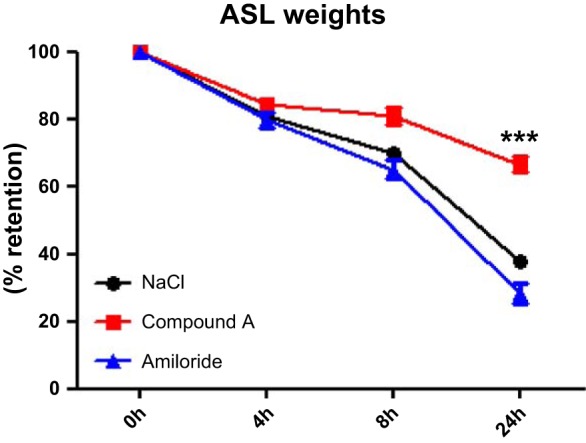
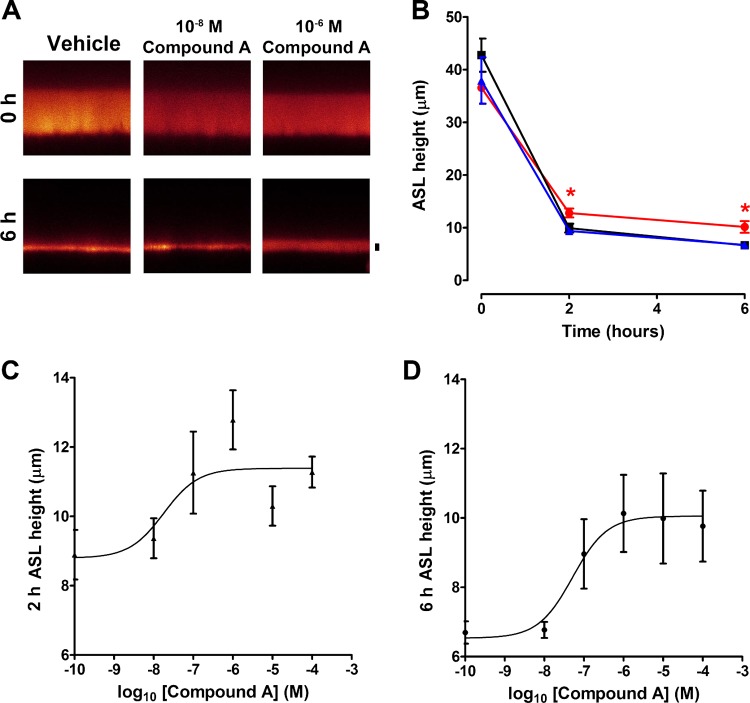
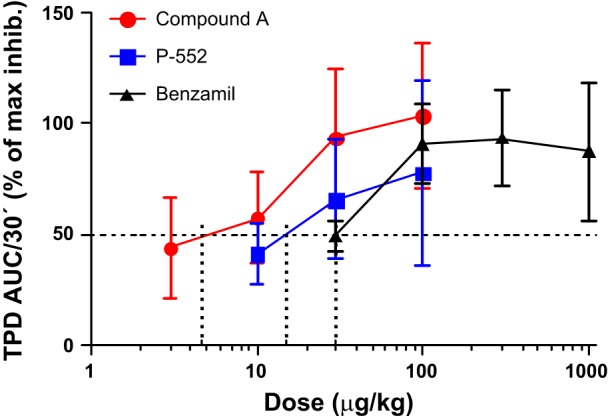
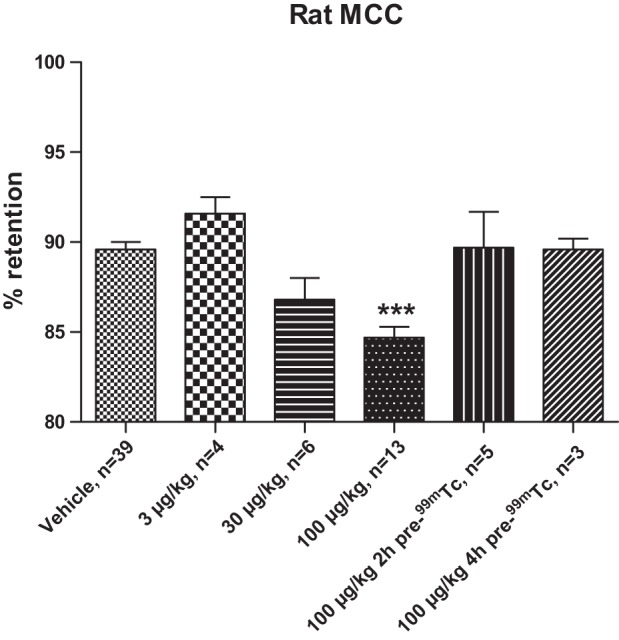
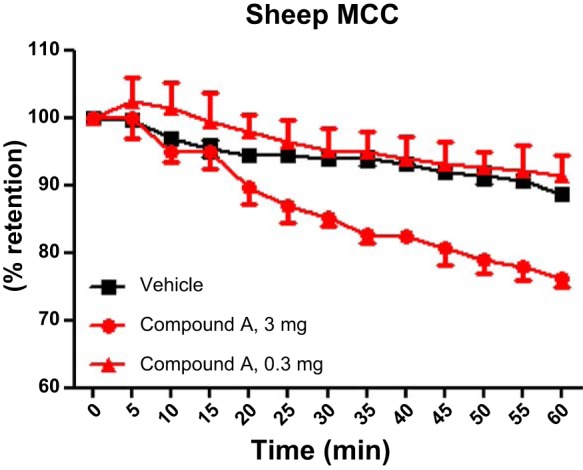
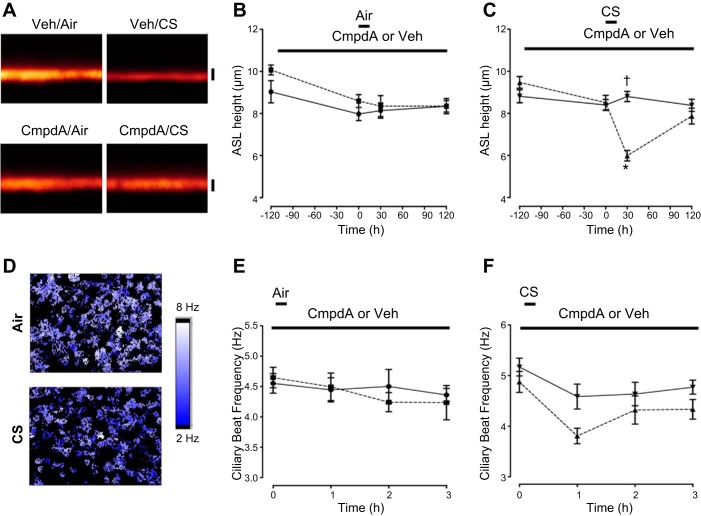
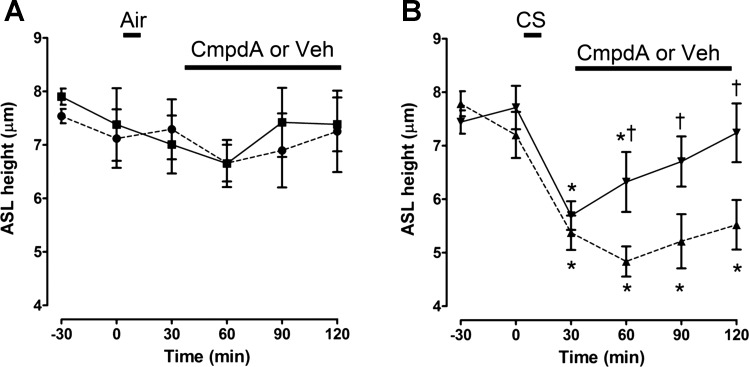
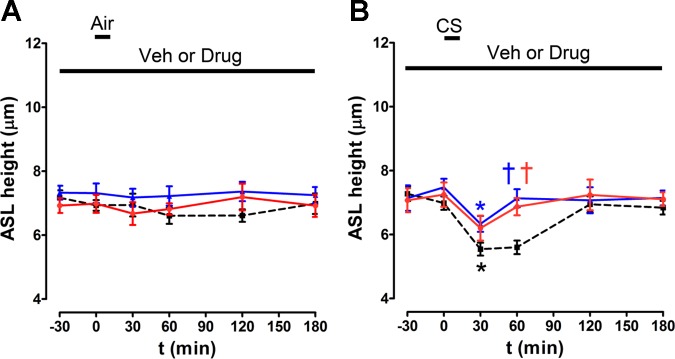
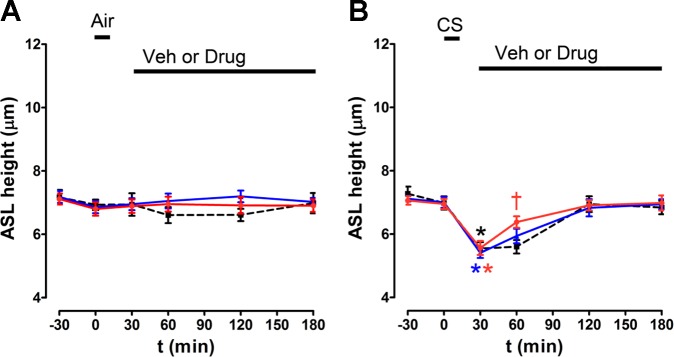
Airway dehydration causes mucus stasis and bacterial overgrowth in cystic fibrosis and chronic bronchitis (CB). Rehydration by hypertonic saline is efficacious but suffers from a short duration of action. We tested whether epithelial sodium channel (ENaC) inhibition would rehydrate normal and dehydrated airways to increase mucociliary clearance (MCC) over a significant time frame. For this, we used a tool compound (Compound A), which displays nanomolar ENaC affinity and retention in the airway surface liquid (ASL). Using normal human bronchial epithelial cultures (HBECs) grown at an air-liquid interface, we evaluated in vitro potency and efficacy using short-circuit current (I(sc)) and ASL height measurements where it inhibited I(sc) and increased ASL height by ∼ 50% (0.052 μM at 6 h), respectively. The in vivo efficacy was investigated in a modified guinea pig tracheal potential difference model, where we observed an effective dose (ED50) of 5 μg/kg (i.t.), and by MCC measures in rats and sheep, where we demonstrated max clearance rates at 100 μg/kg (i.t.) and 75 μg/kg (i.t.), respectively. Acute cigarette smoke-induced ASL height depletion in HBECs was used to mimic the situation in patients with CB, and pretreatment prevented both cigarette smoke-induced ASL dehydration and lessened the decrease in ciliary beat frequency. Furthermore, when added after cigarette smoke exposure, Compound A increased the rate of ASL rehydration. In conclusion, Compound A demonstrated significant effects and a link between increased airway hydration, ciliary function, and MCC. These data support the hypothesis that ENaC inhibition may be efficacious in the restoration of mucus hydration and transport in patients with CB.

Keywords: airway surface liquid; chronic bronchitis; chronic obstructive pulmonary disease; ciliary beat frequency; cystic fibrosis; cystic fibrosis transmembrane conductance regulator; mucociliary clearance; tracheal potential difference.


Figures

Fig. 1.
Fig. 1.
Compound A is a potent inhibitor of epithelial sodium channel (ENaC)-mediated short-circuit current (Isc). Top: representative Ussing chamber trace for Compound A vs. benzamil. Bottom: effective concentration (EC) curves for Compound A (EC50 0.177 nM, n = 8), P-552 (EC50 1.29 nM, n = 5), benzamil (EC50 21.9 nM, n = 13), and amiloride (EC50 0.454 μM, n = 2) in the Ussing chamber assay on normal human bronchial epithelial cells (HBEC) from healthy donors. Means ± SE.
Fig. 2.
Fig. 2.
Retention of airway surface liquid (ASL) in HBECs. Airway surface hydration was determined by gravimetric methods. Vehicle (n = 30) and the short-acting ENaC inhibitor amiloride at 1 μM (n = 12) did not manage to restore the apically added volume from penetrating through the membranes, whereas Compound A at 1 μM (n = 12) significantly (***P < 0.001) retained 66% of the added volume at 24 h. Means ± SD.
Fig. 3.
Fig. 3.
Compound A reduces ASL absorption under thin film conditions in HBEC cultures. A: typical XZ confocal micrographs of ASL height (red) before (0 h) and 6 h after exposure to Compound A or vehicle (control; PBS). Scale bar = 7 μm. B: mean ASL height over time in normal HBECs without (■), or with 10−8 M (▲) and 10−6 M (●) Compound A. All n = 6–11. C and D: dose responses for Compound A vs. ASL height taken 2 and 6 h after Compound A exposure, respectively. All n = 6–11. Data shown as means ± SE. *P < 0.05 different ± Compound A.
Fig. 4.
Fig. 4.
Compound A potently inhibits the trachea potential difference (TPD) in the anaesthetized guinea pig. Percent inhibition of the TPD with an ED50 of 4.7 μg/kg for Compound A (n = 11, red circles). 15 μg/kg for P-552 (n = 4, blue squares), and 30 μg/kg benzamil (n = 9, black triangles). Means ± SE. AUC, area under the curve.
Fig. 5.
Fig. 5.
Compound A dose dependently increases mucociliary clearance (MCC) in the conscious rat. Compound A at 100 μg/kg (4th bar) demonstrates a significantly (***P < 0.001) increased MCC vs. vehicle (1st bar) as demonstrated by the lower percentage of retention of 99mTc colloids. For the dose-response evaluation, Compound A was administered just before 99mTc. For the evaluation of duration, 100 μg/kg of Compound A was administered 2 and 4 h before the 99mTc administration (denoted as pre-99mTc). The retention of colloids was in all cases evaluated 2 h after the administration of 99mTc. Means ± SE, n = 3–39.
Fig. 6.
Fig. 6.
Compound A increases sheep MCC 4–5 h after dosing. Compound A was given at t = 0 h in 2 doses; 0.3 mg (red triangles) with no effect vs. vehicle (black squares) 4–5 h after dosing, whereas 3 mg (red circles) demonstrated clearly increased MCC vs. vehicle, given as percent retention of the 99mTc signal 60 min after colloid administration. Means ± SD, n = 2–3 (descriptive statistical analysis, only).
Fig. 7.
Fig. 7.
Compound A affects renal electrolyte handling at urine concentrations in the nM range. Anaesthetized rats were given Compound A in a 3-step iv infusion dose design, where each step had a duration of 30 min (bolus for 6 min + infusion for 24 min, giving a total of: 0.02–0.2–2.0 μg/kg per min * 30) or vehicle in corresponding volumes. Urinary excretion of potassium (B) is significantly (*P = 0.028) decreased as plasma and urine concentration of compound A approaches 10 nM (D), which significantly (P = 0.010) increases blood potassium levels (C), whereas urinary excretion of sodium (A) is not significantly altered. Means ± SD, n = 6.
Fig. 8.
Fig. 8.
Compound A prevents cigarette smoke (CS)-induced ASL volume depletion. A: typical XZ confocal micrographs of ASL height (red) in the presence of either Compound A or vehicle (PBS) and following exposure to air (control) or 10 puffs of CS as indicated. Scale bar = 7 μm. B and C: mean ASL height over time when cultures were dosed with 1 μM Compound A or vehicle for 2 h followed by air or CS, respectively. All n = 9–12. Importantly, baseline ASL was set to ∼7 μm to induce a comparative situation between the 2 groups. D: heat maps of ciliary beat frequency (CBF) following air (control) or CS exposure in HBECs measured using the Sisson-Ammons Video Analysis system. E: mean CBF measured immediately before (0) or up to 3 h after exposure to air in the presence of vehicle or Compound A (1 μM). All n = 6. F: mean CBF measured immediately before (0) or up to 3 h after CS exposure with vehicle or Compound A (1 μM). ■, air/vehicle; ●, air/Compound A; ▲, CS/vehicle; ▼, CS/Compound A. Data shown as means ± SE. *P < 0.05 different ± air or CS; †P < 0.05 different ± Compound A.
Fig. 9.
Fig. 9.
Compound A increases ASL recovery after CS exposure. ASL height was measured by XZ confocal microscopy. A: effect of Compound A, added as a dry powder in perfluorocarbon, on ASL height after air exposure. All n = 6–8. B: effect of Compound A, added as a dry powder in perfluorocarbon on ASL height after CS exposure as indicated. All n = 5–8. Perfluorocarbon alone served as the vehicle. Data shown as mean ± SE. *P < 0.05 different ± air or CS; †P < 0.05 different ± Compound A.
Fig. 10.
Fig. 10.
Benzamil, but not amiloride, pretreatment prevents CS-induced ASL volume depletion. ASL height was measured by XZ confocal microscopy over time in air and CS-exposed HBECs with either amiloride, benzamil, or vehicle (PBS) pretreatment as indicated. A and B: mean ASL height over time when cultures were predosed with 10 μM of either amiloride, benzamil, or vehicle for 2 h followed by air or CS, respectively. All n = 6. Red, benzamil; blue, amiloride; black, vehicle. Data shown as means ± SE. *P < 0.05 different ± CS exposure for any given drug treatment; †P < 0.05 different to CS exposure at any given time point.
Fig. 11.
Fig. 11.
Benzamil, but not amiloride, increases ASL volume recovery after CS exposure. ASL height was measured by XZ confocal microscopy with time before and after air and CS-exposure in HBECs. 30 min after air or CS, either amiloride, benzamil, or vehicle (perfluorocarbon) was added as indicated. A and B: mean ASL height over time following air or CS and then amiloride, benzamil, or vehicle. All n = 6. Red, benzamil; blue, amiloride; black, vehicle. Data shown as means ± SE. *P < 0.05 different ± CS exposure for any given drug treatment; †P < 0.05 different to CS exposure at any given time point.

Similar articles

Cited by

References

    1. Abraham WM. Modeling of asthma, COPD and cystic fibrosis in sheep. Pulm Pharmacol Ther 21: 743–754, 2008. - PubMed
    1. App EM, King M, Helfesrieder R, Kohler D, Matthys H. Acute and long-term amiloride inhalation in cystic fibrosis lung disease. A rational approach to cystic fibrosis therapy. Am Rev Respir Dis 141: 605–612, 1990. - PubMed
    1. Ballard ST, Spadafora D. Fluid secretion by submucosal glands of the tracheobronchial airways. Respir Physiol Neurobiol 159: 271–277, 2007. - PMC - PubMed
    1. Bartlett JA, Fischer AJ, McCray PB Jr.. Innate immune functions of the airway epithelium. Contrib Microbiol 15: 147–163, 2008. - PubMed
    1. Boucher RC. Regulation of airway surface liquid volume by human airway epithelia. Pflügers Arch 445: 495–498, 2003. - PubMed

Publication types

Substances

LinkOut - more resources