. 2014 Nov 1;15(1):948.
doi: 10.1186/1471-2164-15-948.

Evaluation of variant identification methods for whole genome sequencing data in dairy cattle

Affiliations

Evaluation of variant identification methods for whole genome sequencing data in dairy cattle

Christine F Baes et al. BMC Genomics. .

Abstract

Background: Advances in human genomics have allowed unprecedented productivity in terms of algorithms, software, and literature available for translating raw next-generation sequence data into high-quality information. The challenges of variant identification in organisms with lower quality reference genomes are less well documented. We explored the consequences of commonly recommended preparatory steps and the effects of single and multi sample variant identification methods using four publicly available software applications (Platypus, HaplotypeCaller, Samtools and UnifiedGenotyper) on whole genome sequence data of 65 key ancestors of Swiss dairy cattle populations. Accuracy of calling next-generation sequence variants was assessed by comparison to the same loci from medium and high-density single nucleotide variant (SNV) arrays.

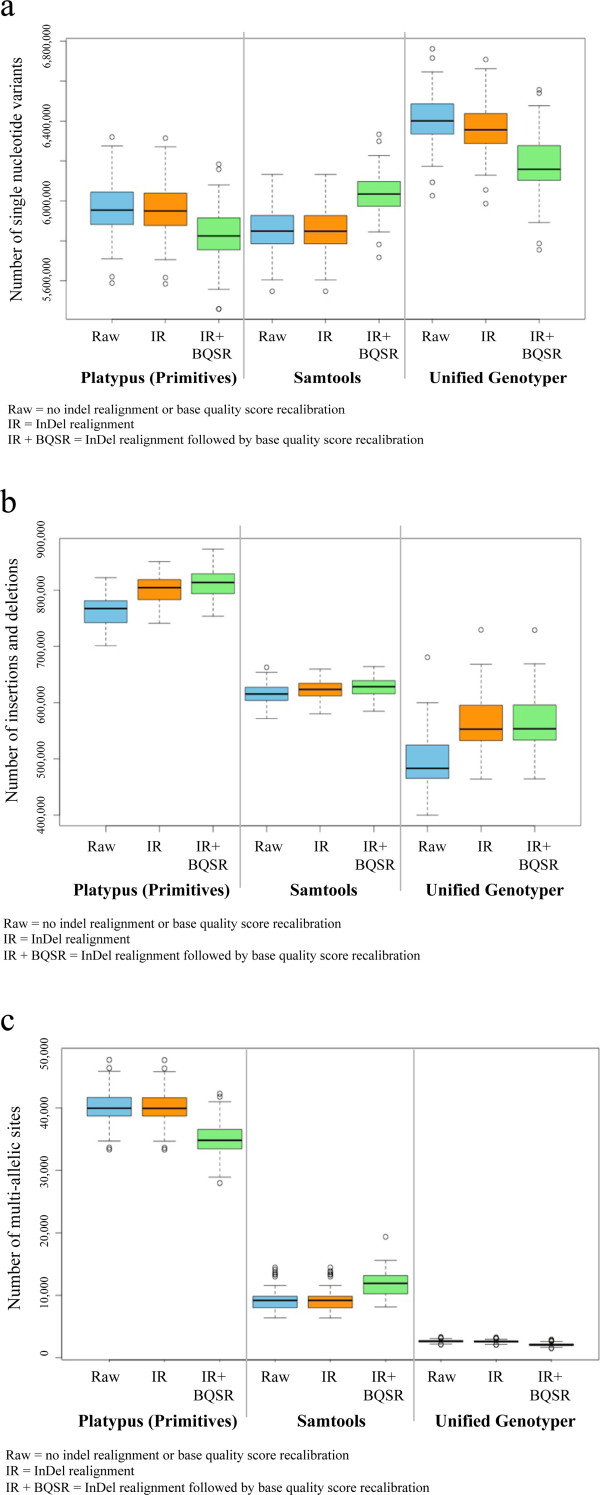
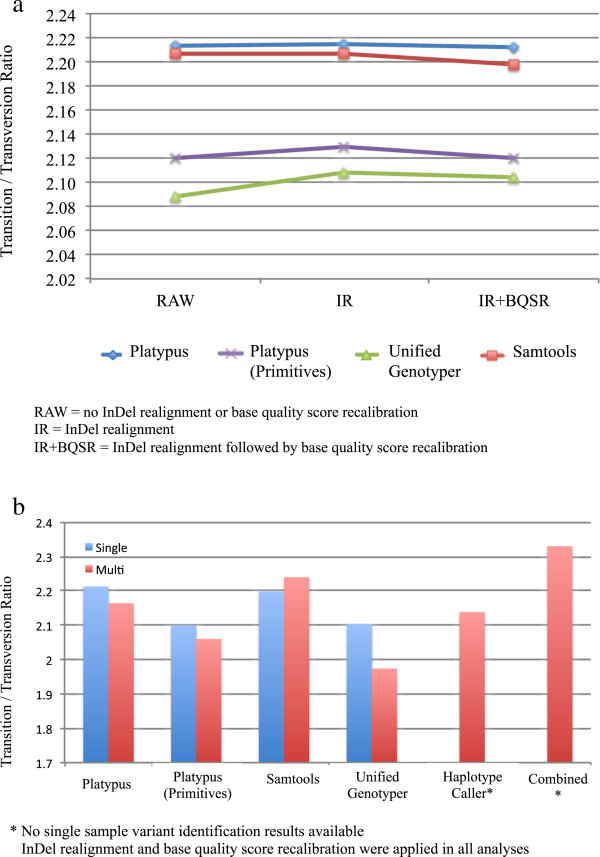
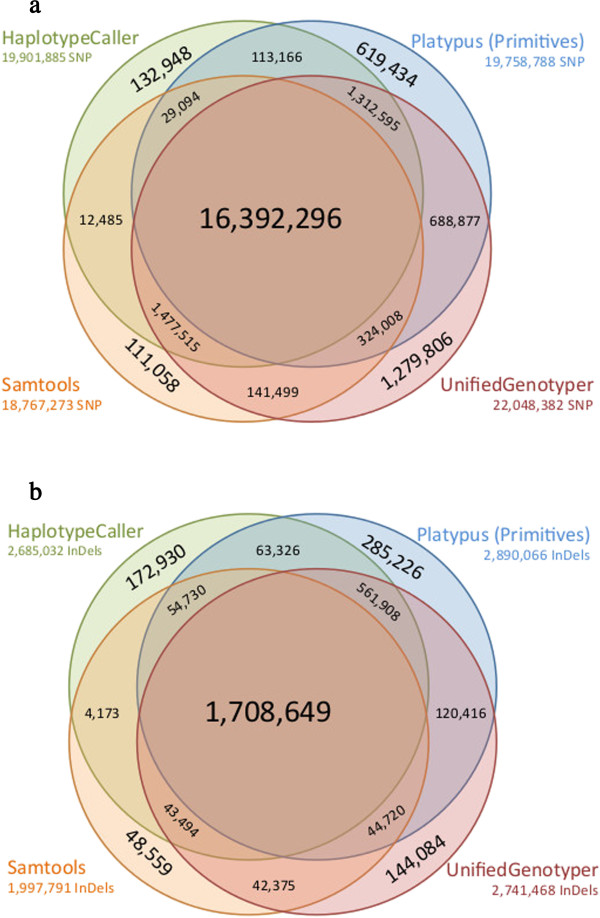
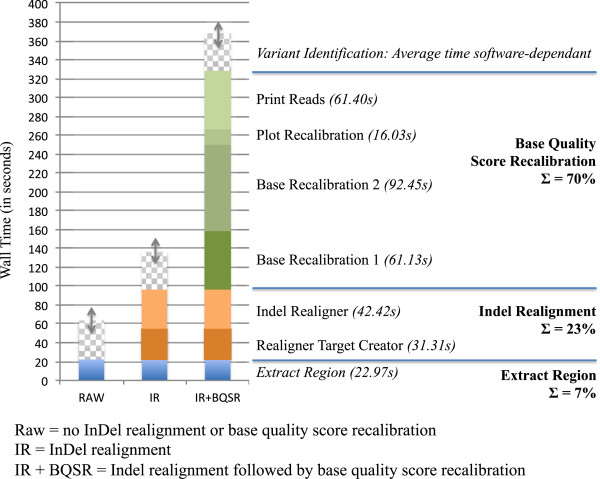
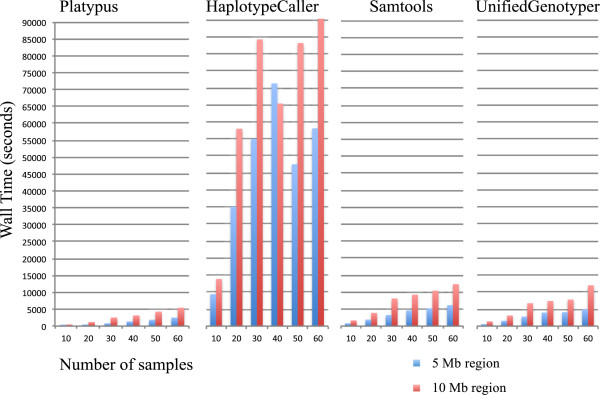
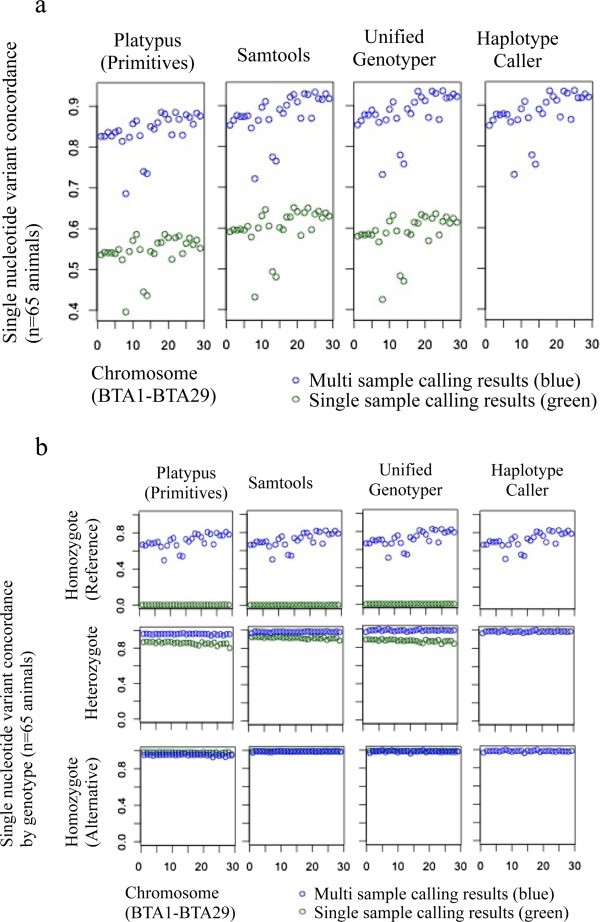
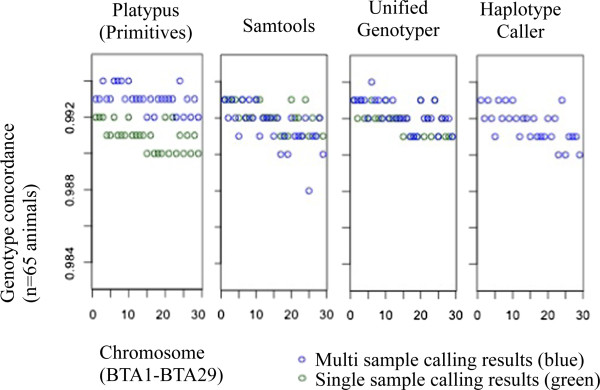
Results: The total number of SNVs identified varied by software and method, with single (multi) sample results ranging from 17.7 to 22.0 (16.9 to 22.0) million variants. Computing time varied considerably between software. Preparatory realignment of insertions and deletions and subsequent base quality score recalibration had only minor effects on the number and quality of SNVs identified by different software, but increased computing time considerably. Average concordance for single (multi) sample results with high-density chip data was 58.3% (87.0%) and average genotype concordance in correctly identified SNVs was 99.2% (99.2%) across software. The average quality of SNVs identified, measured as the ratio of transitions to transversions, was higher using single sample methods than multi sample methods. A consensus approach using results of different software generally provided the highest variant quality in terms of transition/transversion ratio.

Conclusions: Our findings serve as a reference for variant identification pipeline development in non-human organisms and help assess the implication of preparatory steps in next-generation sequencing pipelines for organisms with incomplete reference genomes (pipeline code is included). Benchmarking this information should prove particularly useful in processing next-generation sequencing data for use in genome-wide association studies and genomic selection.


Figures

Figure 1
Figure 1
Distributions of single nucleotide variant counts (a), insertion and deletion counts (b), and multi-allelic site counts (c) identified per animal. For Platypus results, multi-nucleotide variants were split into allelic primitives for fair comparison between software. Single nucleotide variant counts (a), insertion and deletion counts (b), and multi-allelic site counts (c) identified per animal (n = 65; BTA1-29, BTAX) using single sample variant detection with Platypus, Samtools, and the UnifiedGenotyper following three pre-calling approaches.
Figure 2
Figure 2
Average transition/transversion ratios over all animals using single sample variant identification (a) and transition/transversion ratios for variant identification with single and multi sample detection methods, as well as combined over all multi sample detection methods (b). Average transition/transversion ratios for variant identification with single sample detection methods using Platypus, Platypus Primitives, Samtools, UnifiedGenotyper and HaplotypeCaller (n = 65 samples, BTA1-29) are shown in (a). Transition / transversion ratios for variant identification with single and multi sample detection methods using Platypus, Platypus Primitives, Samtools, UnifiedGenotyper and HaplotypeCaller (n = 65 samples, BTA1-29) and a consensus data set (variants called by Platypus Primitives + Samtools + UnifiedGenotyper + HaplotypeCaller) are shown in (b).
Figure 3
Figure 3
Consensus single nucleotide variants (a) and insertions and deletions (b) identified using multi sample variant detection methods. Consensus single nucleotide variants (a) and insertions and deletions (b) identified from whole genome sequencing data using four multi sample variant detection methods (Platypus Primitives, Samtools, UnifiedGenotyper and HaplotypeCaller).
Figure 4
Figure 4
Average per-sample wall clock computation time required for common preparatory steps InDel realignment and base quality score recalibration (n = 65 samples, chromosomal region 5 Mb in length).
Figure 5
Figure 5
Wall clock computation time required for variant identification using Platypus, HaplotypeCaller, Samtools and UnifiedGenotyper on a chromosomal region 5 Mb in length with single (SS) or multi (MS) sample variant identification methods and varying numbers of samples (10, 20, 30 40, 50, 60).
Figure 6
Figure 6
Average wall clock computation time required for multi sample variant identification with varying numbers of samples (10, 20, 30, 40, 50, 60) and different lengths of chromosomal regions (5 Mb and 10 Mb) using different software (Platypus, HaplotypeCaller, Samtools and UnifiedGenotyper).
Figure 7
Figure 7
Non-reference sensitivity (a) and non-reference discrepancy (b) for single nucleotide variants identified using Platypus Primitives, Samtools, UnifiedGenotyper and Haplotype Caller (single vs. multi sample variant identification) using variants identified with the Illumina BovineHD BeadChip® as a gold standard. Indel realignment and base quality score recalibration were conducted for both single and multi sample calling results.
Figure 8
Figure 8
Single nucleotide variant concordance (a) and single nucleotide variant concordance by array genotype (b) with variants identified using Platypus Primitives, Samtools, UnifiedGenotyper and Haplotype Caller (single vs. multi sample variant identification) and variants identified with the Illumina BovineHD BeadChip® as a gold standard. Indel realignment and base quality score recalibration were conducted for both single and multi sample calling results.
Figure 9
Figure 9
Genotype concordance between genotypes identified using Platypus Primitives, Samtools, UnifiedGenotyper and HaplotypeCaller (single vs. multi sample variant identification) and genotypes identified with the Illumina BovineHD BeadChip® as a gold standard. Indel realignment and base quality score recalibration were conducted for both single and multi sample calling results.
Figure 10
Figure 10
Genomic relationship between the 65 sequenced animals. Genomic relationship between the 65 sequenced animals was estimated using array genotypes (autosomal SNPs with known position) filtered separately for Cluster 1 (Brown Swiss, Braunvieh, Original Braunvieh; lower left corner of heat map) and Cluster 2 (Simmental, Swiss Fleckvieh, Holstein, Red Holstein; upper right corner of heat map). After filtering, the merged data set consisted of 38,317 common SNPs. The off-diagonals reflect the estimated pairwise identities by descent.

References

    1. Jensen J, Su G, Madsen P. Partitioning additive genetic variance into genomic and remaining polygenic components for complex traits in dairy cattle. BMC Genet. 2012;13:44. doi: 10.1186/1471-2156-13-44. - DOI - PMC - PubMed
    1. Van Raden P, O’Connell JR, Wiggans GR, Weigel KA. Genomic evaluations with many more genotypes. Gen Sel Evol. 2011;43(1):10. doi: 10.1186/1297-9686-43-10. - DOI - PMC - PubMed
    1. Horner DS, Pavesi G, Castrignano T, D’Onorio De Meo P, Liuni S, Sammeth M, Picardi E, Pesole G. Bioinformatics approaches for genomics and post genomics applications of next-generation sequencing. Brief Bioinformatics. 2009;11:181–197. doi: 10.1093/bib/bbp046. - DOI - PubMed
    1. Stratton M. Genome resequencing and genetic variation. Nat Biotechnol. 2009;26:65–66. doi: 10.1038/nbt0108-65. - DOI - PubMed
    1. Flicek P, Birney E. Sense from sequence reads: methods for alignment and assembly. Nat Methods. 2009;6:S6–S12. doi: 10.1038/nmeth.1376. - DOI - PubMed

Publication types

LinkOut - more resources