

Reliable gene expression analysis by reverse transcription-quantitative PCR: reporting and minimizing the uncertainty in data accuracy
- PMID: 25361954
- PMCID: PMC4247583
- DOI: 10.1105/tpc.114.130641
Reliable gene expression analysis by reverse transcription-quantitative PCR: reporting and minimizing the uncertainty in data accuracy
Abstract
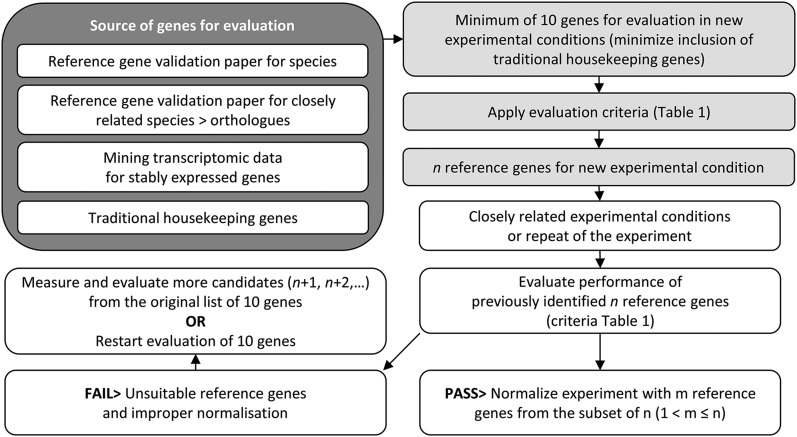
Reverse transcription-quantitative PCR (RT-qPCR) has been widely adopted to measure differences in mRNA levels; however, biological and technical variation strongly affects the accuracy of the reported differences. RT-qPCR specialists have warned that, unless researchers minimize this variability, they may report inaccurate differences and draw incorrect biological conclusions. The Minimum Information for Publication of Quantitative Real-Time PCR Experiments (MIQE) guidelines describe procedures for conducting and reporting RT-qPCR experiments. The MIQE guidelines enable others to judge the reliability of reported results; however, a recent literature survey found low adherence to these guidelines. Additionally, even experiments that use appropriate procedures remain subject to individual variation that statistical methods cannot correct. For example, since ideal reference genes do not exist, the widely used method of normalizing RT-qPCR data to reference genes generates background noise that affects the accuracy of measured changes in mRNA levels. However, current RT-qPCR data reporting styles ignore this source of variation. In this commentary, we direct researchers to appropriate procedures, outline a method to present the remaining uncertainty in data accuracy, and propose an intuitive way to select reference genes to minimize uncertainty. Reporting the uncertainty in data accuracy also serves for quality assessment, enabling researchers and peer reviewers to confidently evaluate the reliability of gene expression data.
© 2014 American Society of Plant Biologists. All rights reserved.
Figures
Similar articles
-
Identification of reference genes for RT-qPCR expression analysis in Arabidopsis and tomato seeds.Plant Cell Physiol. 2012 Jan;53(1):28-37. doi: 10.1093/pcp/pcr113. Epub 2011 Aug 18. Plant Cell Physiol. 2012. PMID: 21852359
-
Bacterial reference genes for gene expression studies by RT-qPCR: survey and analysis.Antonie Van Leeuwenhoek. 2015 Sep;108(3):685-93. doi: 10.1007/s10482-015-0524-1. Epub 2015 Jul 7. Antonie Van Leeuwenhoek. 2015. PMID: 26149127
-
Validation and application of normalization factors for gene expression studies in rubella virus-infected cell lines with quantitative real-time PCR.J Cell Biochem. 2010 May;110(1):118-28. doi: 10.1002/jcb.22518. J Cell Biochem. 2010. PMID: 20217898 Free PMC article.
-
Careful selection of reference genes is required for reliable performance of RT-qPCR in human normal and cancer cell lines.PLoS One. 2013;8(3):e59180. doi: 10.1371/journal.pone.0059180. Epub 2013 Mar 15. PLoS One. 2013. PMID: 23554992 Free PMC article. Review.
-
RNA quality assessment: a view from plant qPCR studies.J Exp Bot. 2012 Oct;63(17):6069-77. doi: 10.1093/jxb/ers276. Epub 2012 Oct 8. J Exp Bot. 2012. PMID: 23045609 Review.
Cited by
-
Identification of reference genes for real-time quantitative PCR experiments in the liverwort Marchantia polymorpha.PLoS One. 2015 Mar 23;10(3):e0118678. doi: 10.1371/journal.pone.0118678. eCollection 2015. PLoS One. 2015. PMID: 25798897 Free PMC article.
-
Role of oxidative stress in the physiology of sensitive and resistant Amaranthus palmeri populations treated with herbicides inhibiting acetolactate synthase.Front Plant Sci. 2023 Jan 6;13:1040456. doi: 10.3389/fpls.2022.1040456. eCollection 2022. Front Plant Sci. 2023. PMID: 36684786 Free PMC article.
-
Does long-term cadmium exposure influence the composition of pectic polysaccharides in the cell wall of Medicago sativa stems?BMC Plant Biol. 2019 Jun 21;19(1):271. doi: 10.1186/s12870-019-1859-y. BMC Plant Biol. 2019. PMID: 31226937 Free PMC article.
-
quantGenius: implementation of a decision support system for qPCR-based gene quantification.BMC Bioinformatics. 2017 May 25;18(1):276. doi: 10.1186/s12859-017-1688-7. BMC Bioinformatics. 2017. PMID: 28545393 Free PMC article.
-
Metabolite and transcript markers for the prediction of potato drought tolerance.Plant Biotechnol J. 2018 Apr;16(4):939-950. doi: 10.1111/pbi.12840. Epub 2017 Oct 17. Plant Biotechnol J. 2018. PMID: 28929574 Free PMC article.
References
-
- Andersen C.L., Jensen J.L., Ørntoft T.F. (2004). Normalization of real-time quantitative reverse transcription-PCR data: a model-based variance estimation approach to identify genes suited for normalization, applied to bladder and colon cancer data sets. Cancer Res. 64: 5245–5250. - PubMed
-
- Baker M. (2011). qPCR: quicker and easier but don’t be sloppy. Nat. Methods 8: 207–212.
-
- Bustin S.A., et al. . . (2013). The need for transparency and good practices in the qPCR literature. Nat. Methods 10: 1063–1067. - PubMed
-
- Bustin S.A., Benes V., Garson J.A., Hellemans J., Huggett J., Kubista M., Mueller R., Nolan T., Pfaffl M.W., Shipley G.L., Vandesompele J., Wittwer C.T. (2009). The MIQE guidelines: minimum information for publication of quantitative real-time PCR experiments. Clin. Chem. 55: 611–622. - PubMed
Publication types
MeSH terms
Substances
LinkOut - more resources
Full Text Sources
Other Literature Sources
