. 2014 Dec 1;42(21):13254-68.
doi: 10.1093/nar/gku976. Epub 2014 Oct 31.

Transcriptome analysis reveals novel regulatory mechanisms in a genome-reduced bacterium

Affiliations

Transcriptome analysis reveals novel regulatory mechanisms in a genome-reduced bacterium

Pavel V Mazin et al. Nucleic Acids Res. .

Abstract

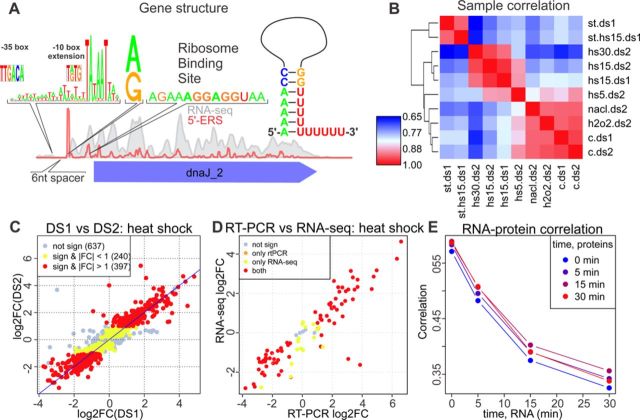
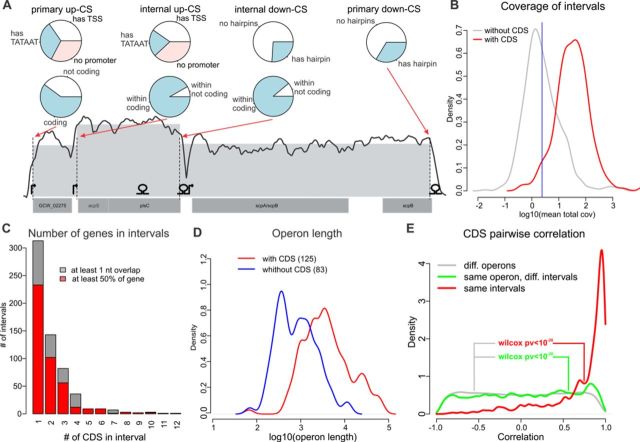
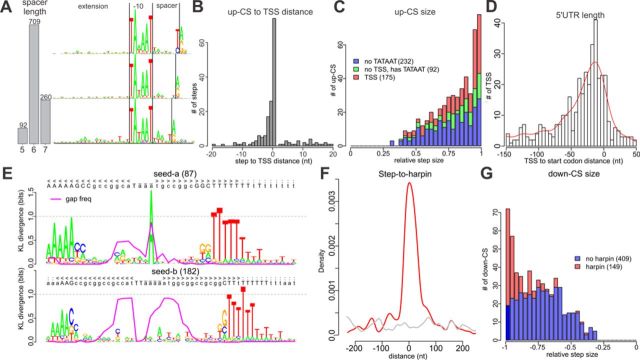
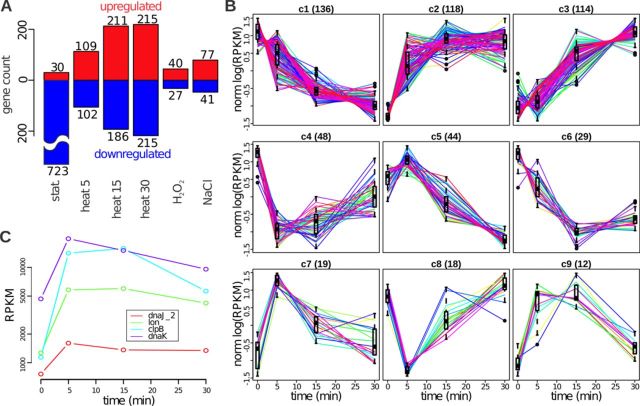
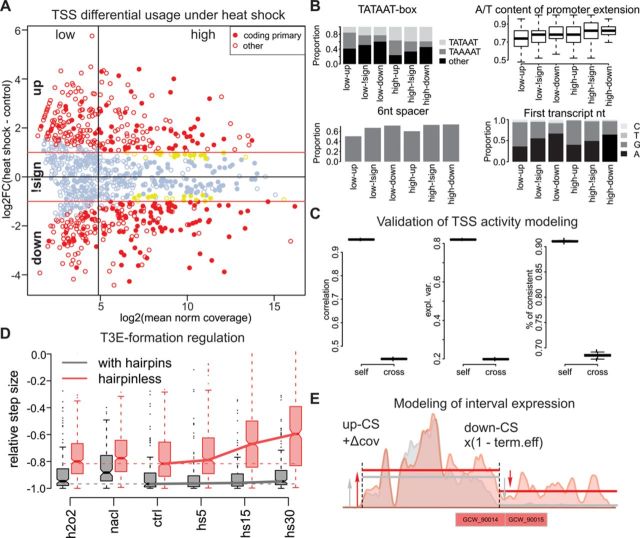
The avian bacterial pathogen Mycoplasma gallisepticum is a good model for systems studies due to small genome and simplicity of regulatory pathways. In this study, we used RNA-Seq and MS-based proteomics to accurately map coding sequences, transcription start sites (TSSs) and transcript 3'-ends (T3Es). We used obtained data to investigate roles of TSSs and T3Es in stress-induced transcriptional responses. We identified 1061 TSSs at a false discovery rate of 10% and showed that almost all transcription in M. gallisepticum is initiated from classic TATAAT promoters surrounded by A/T-rich sequences. Our analysis revealed the pronounced operon structure complexity: on average, each coding operon has one internal TSS and T3Es in addition to the primary ones. Our transcriptomic approach based on the intervals between the two nearest transcript ends allowed us to identify two classes of T3Es: strong, unregulated, hairpin-containing T3Es and weak, heat shock-regulated, hairpinless T3Es. Comparing gene expression levels under different conditions revealed widespread and divergent transcription regulation in M. gallisepticum. Modeling suggested that the core promoter structure plays an important role in gene expression regulation. We have shown that the heat stress activation of cryptic promoters combined with the hairpinless T3Es suppression leads to widespread, seemingly non-functional transcription.


Figures

Figure 1.
Figure 1.
(A) Typical RNA-Seq and 5′-ERS coverage profiles near the dnaJ2 gene. The diagram of the promoter sequence, the first nucleotide of the transcript, RBS and a schematic representation of the TT are shown above the plot. (B) Correlation heatmap (correlation increases from 0.65 (blue) to 1 (red); one minus the Spearman's correlation coefficient was used as the distance metric for clustering for different conditions (c, h2o2, nacl, hs5, hs15 and hs30 denote the control, oxidative stress, osmotic stress and heat stress for 5, 15 and 30 min, respectively) and data sets (ds1 and ds2). The expression values represent the average values of the replicates. (C) Agreement of the heat shock (15 min)-related expression changes (log2-fold change) between DS1 (x-axis) and DS2 (y-axis). One dot denotes one CDS. Not significant, significant but with a fold change below 2 and significant with a fold change above 2 are shown in gray, yellow and red, respectively. (D) Agreement of the heat shock (15 min)-related expression changes between RT-PCR (x-axis, differences in cycle number) and DS2 (y-axis, log2-fold change). The same color scheme as in panel C was used. (E) Dependence of the Spearman's correlation coefficient between the protein abundance (PAI) measured for different heat shock durations (shown with different colors) and the mRNA abundance (RPKM) on the heat shock duration used for the RNA-Seq experiments.
Figure 2.
Figure 2.
SOT prediction. (A) Example of a predicted SOT. Annotated CDSs are shown at the bottom; the TSSs identified by 5′-ERS and the hairpins predicted by RNIE are shown above. The smoothed coverage (running mean in a 100 nt window; log scale) is shown with a solid line; the dashed vertical lines represent up- and down-CSs; and the mean interval coverage is represented by the gray area. Classifications of primary and internal CSs by TSS/hairpin existence and the coding potential of the SOT to which they belong are shown with pie charts. (B) Distribution of intervals with (red) and without (gray) CDSs by log coverage. The 5% quantile of the former is shown as a blue vertical line. (C) Distribution of intervals by the number of genes. (D) Distribution of SOTs with (red) and without (blue) CDSs by log length. (E) Distribution of Pearson's correlation coefficients for the pairs of genes that belong to the same interval (red), same SOT (but not interval, green) and genes from different SOTs (gray).
Figure 3.
Figure 3.
Structure of M. gallisepticum TSSs and T3Es. (A) Distribution of TSSs by spacer (between the −10 element and the TSS) length (left) and logo-images of the promoter region for each spacer length (7 to 5 nt from top to bottom). The −10 element and TSS are shown with vertical black lines. (B) Distribution of distances between the TSSs and the nearest up-CS. (C) Distribution of up-CSs by step size. The up-CSs that have 5′-ERS-detected TSSs, have only a good −10 element (detected by PWM) and have no signs of a TATAAT-like promoter are shown in red, green and blue, respectively. (D) Distribution of distances from the nearest start codon to a TSS (negative values correspond to TSSs placed before the start codon). (E) The logo-images of alignments of RNIE-predicted hairpins to two seeds. The proportion of gaps in a given position is shown with a magenta line. (F) Distribution of distances between down-CSs and RNIE-predicted hairpins. (G) Distribution of down-CSs by relative step size. The down-CSs with and without hairpins are shown in red and blue, respectively.
Figure 4.
Figure 4.
Transcription regulation. (A) Number of CDSs whose expression changes significantly under different conditions. The up- and down-regulated genes are shown in red and blue, respectively. (B) Nine patterns of gene expression changes under heat shock. The patterns are ordered by their size (shown in brackets in the panel titles). The normalized log expression of individual genes is shown with lines, and the distribution of the normalized log expression at each time point is shown with a box. (C) Gene expression profiles (RPKM) of four genes that have the CIRCE motif in the upstream region.
Figure 5.
Figure 5.
TSS and T3S formation contributions to gene expression regulation. (A) Fold change versus mean activity plot (log scale) for TSSs under heat shock. The TSSs associated with the coding genes are shown with filled circles, the TSSs with significant changes and with |FC| > 1 are shown in red, and the TSSs with significant changes but with |FC| < 1 are shown in yellow. The TSSs are divided into six groups by the change direction (up, down and not significant (denoted by ‘!sign’)) and by the average activity (low or high; the vertical line represents the median). (B) Distributions of TSS properties among the six TSS groups defined in A: type of −10 box, A/T content of the −10 element extension, proportion of promoters with a 6-nt-long spacer between the −10 element and the TSS and frequencies of first transcript nucleotide. (C) Pearson's correlation, proportion of explained variance and proportion of TSSs with the correct direction of change prediction for the self- and cross-validation of the random forest modeling of the heat-shock fold change. In total, 500 permutations were performed, and in each case, the learning and test sets consisted of 90% and 10% of 495 significant TSSs, respectively. (D) Distributions of down-CS efficiency under different conditions and dependence on the presence of hairpins. (E) Modeling of the interval expression by additive TSS and multiplicative T3S formation activity. The colored areas represent a smoothed read coverage, the interval borders are shown with vertical lines, and the mean interval coverage is shown with solid lines. The read coverage profiles under the control conditions and heat shock are shown in gray and red, respectively.

References

    1. Davis J.J., Xia F., Overbeek R.A., Olsen G.J. Genomes of the class Erysipelotrichia clarify the firmicute origin of the class Mollicutes. International journal of systematic and evolutionary microbiology. 2013;63:2727–2741. - PMC - PubMed
    1. Levisohn S., Kleven S.H. Avian mycoplasmosis (Mycoplasma gallisepticum) Rev. sci. tech. Off. int. Epiz. 2000;19:425–442. - PubMed
    1. Razin S., Yogev D. Molecular biology and pathogenicity of mycoplasmas. Microbiology and Molecular Biology. 1998;62:1094–1156. - PMC - PubMed
    1. Moreno-Campuzano S., Janga S.C., Pérez-Rueda E. Identification and analysis of DNA-binding transcription factors in Bacillus subtilis and other Firmicutes-a genomic approach. BMC genomics. 2006;7:147. - PMC - PubMed
    1. Chang L.-J., Chen W.-H., Minion F.C., Shiuan D. Mycoplasmas regulate the expression of heat-shock protein genes through CIRCE-HrcA interactions. Biochemical and biophysical research communications. 2008;367:213–218. - PubMed

Publication types

MeSH terms