. 2014 Dec 23;111(51):18116-25.
doi: 10.1073/pnas.1407502111. Epub 2014 Oct 31.

Intracellular metabolite levels shape sulfur isotope fractionation during microbial sulfate respiration

Affiliations

Intracellular metabolite levels shape sulfur isotope fractionation during microbial sulfate respiration

Boswell A Wing et al. Proc Natl Acad Sci U S A. .

Abstract

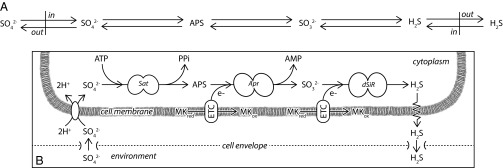
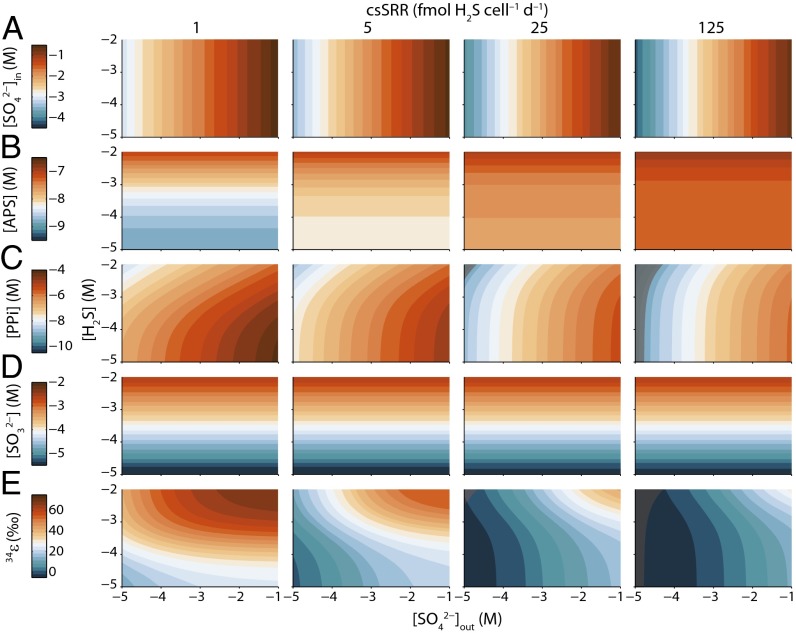
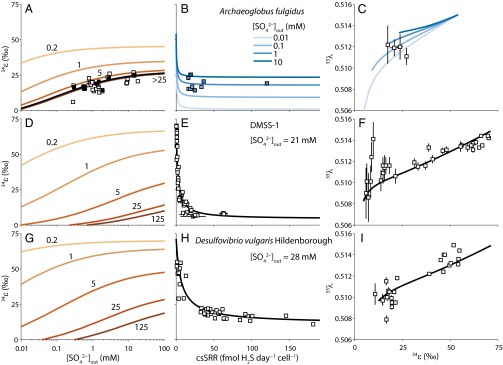
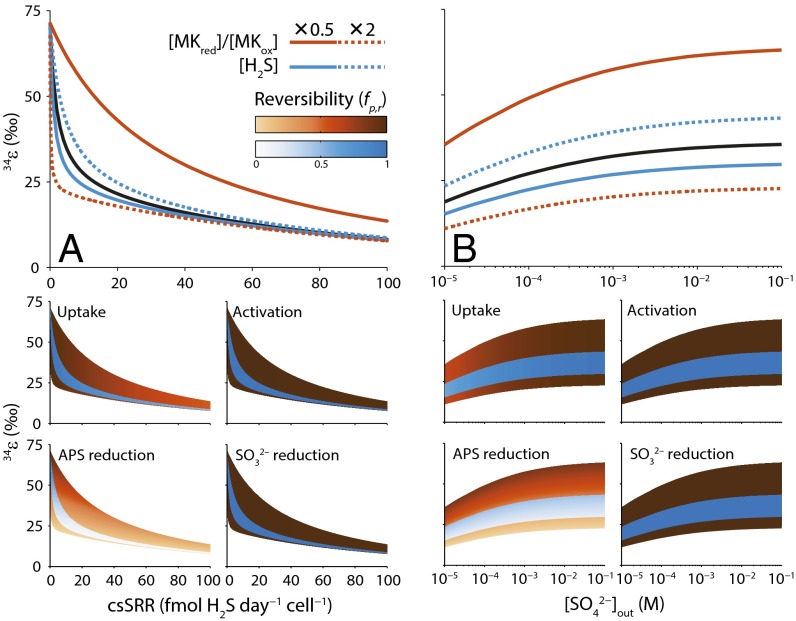
We present a quantitative model for sulfur isotope fractionation accompanying bacterial and archaeal dissimilatory sulfate respiration. By incorporating independently available biochemical data, the model can reproduce a large number of recent experimental fractionation measurements with only three free parameters: (i) the sulfur isotope selectivity of sulfate uptake into the cytoplasm, (ii) the ratio of reduced to oxidized electron carriers supporting the respiration pathway, and (iii) the ratio of in vitro to in vivo levels of respiratory enzyme activity. Fractionation is influenced by all steps in the dissimilatory pathway, which means that environmental sulfate and sulfide levels control sulfur isotope fractionation through the proximate influence of intracellular metabolites. Although sulfur isotope fractionation is a phenotypic trait that appears to be strain specific, we show that it converges on near-thermodynamic behavior, even at micromolar sulfate levels, as long as intracellular sulfate reduction rates are low enough (<<1 fmol H2S⋅cell(-1)⋅d(-1)).

Keywords: dissimilatory sulfate reduction; flux–force relationship; sulfur isotope fractionation.


Conflict of interest statement

The authors declare no conflict of interest.

Figures

Fig. 1.
Fig. 1.
Two illustrations of the dissimilatory sulfate respiration network. (A) Sulfur-focused representation of S-isotope fractionation. Bidirectional arrows represent reversible S transformations. In this framework the “back flux” on any one step is a phenomenological constraint. (B) Metabolite-focused representation used here to quantify back flux. Arrows indicate net flux through the individual steps of the pathway, with the ratio of backward to forward flux controlled by the relative abundances of the reactants and products for each step as well as the kinetics of their associated enzymes. Sat is sulfate adenylyl transferase. Apr is APS reductase. dSiR is dissimilatory sulfite reductase. MKred refers to the reduced form of menaquinone (menaquinol) and MKox refers to the oxidized form of menaquinone. ETC stands for “electron transfer complex.” The likely identities of these complexes in sulfate-reducing microbes are discussed in the text.
Fig. 2.
Fig. 2.
Predicted metabolite concentrations and isotopic fractionation in a model sulfate reducer. Shown are intracellular concentrations of sulfate ([SO42]in, row A), APS ([APS], row B), PPi ([PPi], row C), and sulfite ([SO32], row D) and the net isotopic fractionation between the substrate sulfate and product sulfide (ε34, row E) as functions of extracellular sulfate ([SO42]out, horizontal axis) and sulfide concentrations ([H2S], vertical axis). All concentrations are shown on logarithmic scales. Intracellular metabolite levels are calculated from Eqs. S22S25, whereas isotopic fractionation is calculated by application of Eqs. 2 and 5. Regions where calculated PPi concentrations (and associated fractionations) are physiologically unlikely are shown as gray shaded fields (SI Materials and Methods) (rows C and E).
Fig. 3.
Fig. 3.
Model calibration to experimental data. (A) Net isotopic fractionation (ε34) by A. fulgidus grown at 80 °C at constant csSRR (6, 7) as a function of extracellular sulfate concentrations ([SO42]out). Orange contours show the value of ε34 for different values of csSRR in fmol H2S⋅cell−1⋅d−1. The black curve shows ε34 for the harmonic mean of the csSRR values that were reported for some of the experiments (black squares). The csSRR values were not reported for other experiments (white squares), resulting in the scatter around the black curve. (B) Predicted ε34 as a function of csSRR for [SO42]out between 10 μM and 100 mM. Experiments for which [SO42]out, csSRR, and ε34 were all reported are also shown, color coded by [SO42]out. (C) Predicted fractionation exponent (λ33) as a function of ε34 for the same [SO42]out as in B. Experiments for which minor isotope data exist are also shown (14). (D) Predicted ε34-[SO42]out relationship for Desulfovibrio strain DMSS-1 grown at ∼20 °C, 21–14 mM [SO42]out, and 2–7 mM sulfide (–10). (E) Measured (white squares) and model (black curve) ε34 vs. csSRR for the experiments in D. These experiments were run in batch culture, so we assumed the average [SO42]out and external sulfide concentrations for the interval over which ε34 vs. csSRRs were determined (SI Materials and Methods). (F) λ33 vs. ε34 for the experiments in D. Error bars are 1σ reported in the experiments. (G–I) Same as D–F, but for D. vulgaris Hildenborough, grown at 25 °C and with precisely controlled [SO42]out of 28 mM (11). Sulfide concentrations for the model curves were assumed to be 0.1 mM.
Fig. 4.
Fig. 4.
Sensitivity of ε34–csSRR (A) and ε34[SO42] (B) relationships to a halving (solid curves) and a doubling (broken curves) of the default [MKred]/[MKox] (= 100) and [H2S] (= 0.1 mM) values. Fractionation resulting from the default state is shown by the black curves. Shaded envelopes in A and B show the reversibility of the steps in the sulfate reduction pathway resulting from variation of [MKred]/[MKox] and [H2S] for a range of [SO42] and csSRRs. Values of fp,r range from 0.45 to 0.99 for SO42 uptake, 0.98 to ∼1 for activation, ∼0 to 0.98 for APS reduction, and 0.99 to ∼1 for SO32 reduction.
Fig. 5.
Fig. 5.
Sensitivity of the λ33ε34 relationship to the ratio of reduced to oxidized menaquinone ([MKred]/[MKox], orange) and the kinetic isotope fractionation during sulfate uptake (εuptakekin34, blue).

Comment in

References

    1. Rabus R, Hansen T, Widdel F. In: Dissimilatory Sulfate- and Sulfur-Reducing Prokaryotes. Rosenberg E, DeLong E, Lory S, Stackebrandt E, Thompson F, editors. Springer; Berlin: 2013. pp. 309–404.
    1. Thode H, Kleerekoper H, McElcheran D. Isotope fractionation in the bacterial reduction of sulphate. Research. 1951;4:581–582.
    1. Harrison A, Thode H. Mechanism of the bacterial reduction of sulphate from isotope fractionation studies. Trans Faraday Soc. 1958;54:84–92.
    1. Kaplan IR, Rittenberg SC. Microbiological fractionation of sulphur isotopes. J Gen Microbiol. 1964;34(2):195–212. - PubMed
    1. Chambers LA, Trudinger PA, Smith JW, Burns MS. Fractionation of sulfur isotopes by continuous cultures of Desulfovibrio desulfuricans. Can J Microbiol. 1975;21(10):1602–1607. - PubMed

Publication types

Substances

LinkOut - more resources